Introduction #
The creators of the 38-Cloud: Cloud Segmentation in Satellite Images dataset present an innovative deep learning algorithm designed to accurately identify clouds in satellite images, especially when working with a limited set of available spectral bands. This algorithm employs a fully convolutional network (FCN) known as Cloud-Net, which is trained using various patches extracted from Landsat 8 satellite images. Cloud-Net is specifically crafted to efficiently capture global and local cloud features within an image through its convolutional components. An important feature of this approach is its end-to-end nature, eliminating the requirement for intricate preprocessing procedures.
The accurate measurement and identification of cloud coverage bear immense importance in analyzing satellite imagery, as clouds can obscure land-based objects and pose challenges for various remote sensing applications, including change detection, geophysical parameter retrieval, and object tracking. Moreover, transmitting images with substantial cloud cover from satellites to ground stations proves unnecessary and inefficient. Cloud coverage data can also offer valuable insights into climate parameters and natural disasters, such as hurricanes and volcanic eruptions. Consequently, identifying cloud regions within images emerges as a pivotal preprocessing step across multiple applications.
To train Cloud-Net, the authors harnessed Landsat 8 spectral images, which encompass eleven spectral bands. Four of these bands (from band 2 to band 5) were selected for utilization in their research, as they are among the more commonly accessible bands provided by numerous remote sensing satellites like Sentinel-2, HJ-1, GF-2, among others. Given the substantial spatial dimensions of Landsat 8 images, the authors extracted multiple non-overlapping patches, each measuring 384 × 384 pixels, from these images. Before inputting them into Cloud-Net, these patches underwent downsizing to 192 × 192 pixels and normalization by dividing by 65535. Consequently, the input size of the network stands at 192 × 192 × 4, while the output cloud mask dimensions are 192 × 192 × 1.
Regarding the dataset utilized for training and testing, the authors drew from the dataset introduced in a prior study with some modifications. This dataset encompasses 18 Landsat 8 images for training and 20 images for testing. During their assessment, the authors identified five images (four from the training set and one from the test set) with inaccurate and uncertain ground truths (GTs). These problematic images were subsequently replaced with five new images. Additionally, the GTs for all images in the training set underwent manual annotation, departing from the automatically generated GTs employed in the previous dataset. This adjustment contributes to the algorithm’s performance, as it enables the network to learn cloud features from accurate images and GTs instead of inconsistent data. After cropping the images into 384 × 384 multiband patches, the dataset yields 8400 patches for training and 9201 patches for testing, all of which Cloud-Net is trained on.
In the test phase, to generate the cloud mask for an unseen test image, the image is initially divided into multiple non-overlapping patches measuring 384 × 384 pixels. Subsequently, each patch undergoes normalization (without downsizing to 192 × 192) before being input into Cloud-Net.
Summary #
38-Cloud: Cloud Segmentation in Satellite Images is a dataset for instance segmentation, semantic segmentation, and object detection tasks. It is used in the geospatial and environmental domains.
The dataset consists of 70404 images with 292496 labeled objects belonging to 1 single class (cloud).
Images in the 38-Cloud dataset have pixel-level instance segmentation annotations. Due to the nature of the instance segmentation task, it can be automatically transformed into a semantic segmentation (only one mask for every class) or object detection (bounding boxes for every object) tasks. There are 51484 (73% of the total) unlabeled images (i.e. without annotations). There are 2 splits in the dataset: test (36804 images) and training (33600 images). Additionally, every one-channel image has channel tag and grouped by its image_id. Explore them in supervisely advanced labeling tool. The dataset was released in 2018 by the Simon Fraser University, Canada.

Explore #
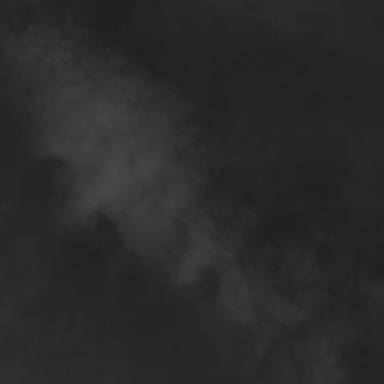
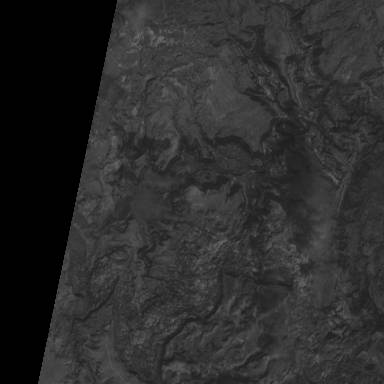
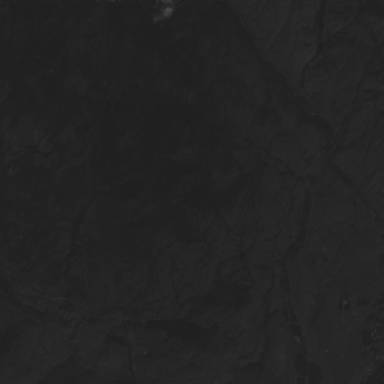
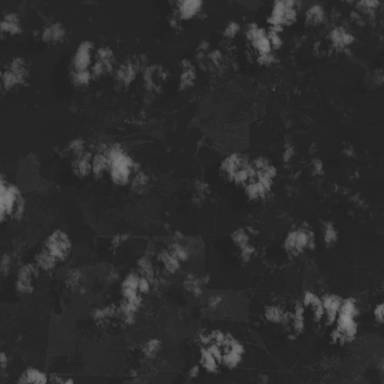
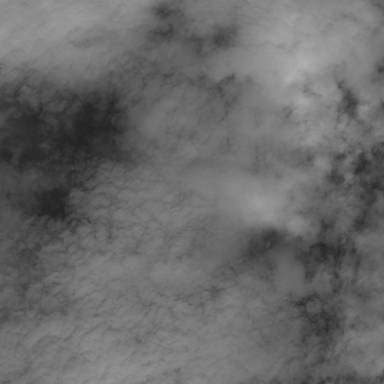
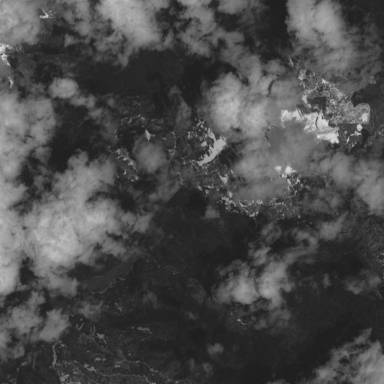
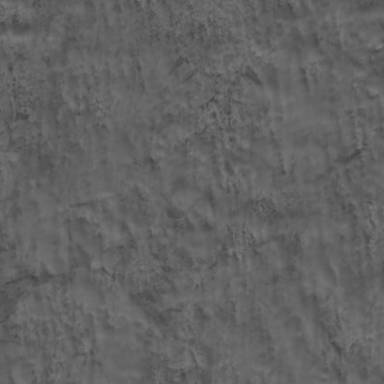
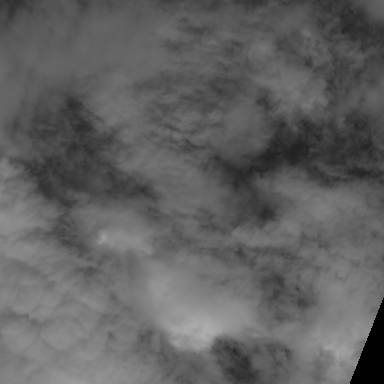
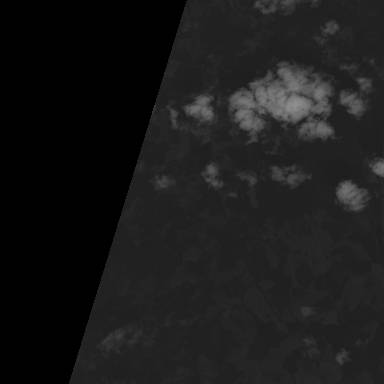
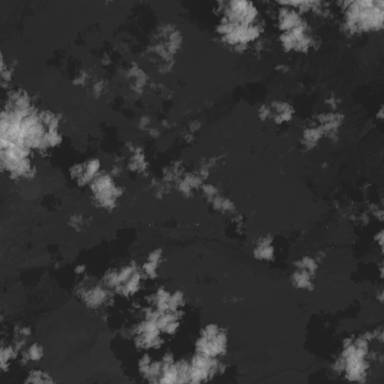
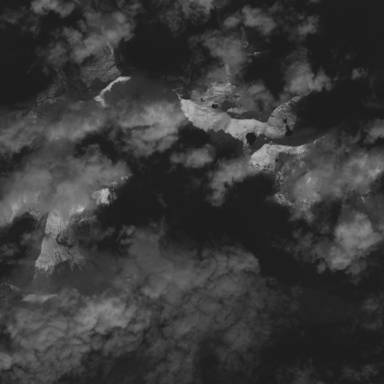
38-Cloud dataset has 70404 images. Click on one of the examples below or open "Explore" tool anytime you need to view dataset images with annotations. This tool has extended visualization capabilities like zoom, translation, objects table, custom filters and more. Hover the mouse over the images to hide or show annotations.











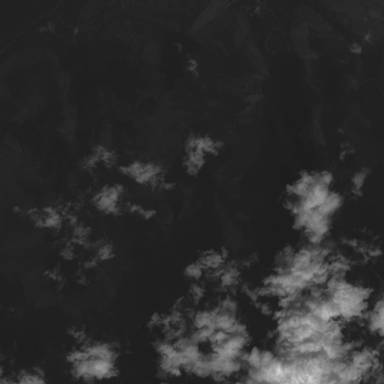

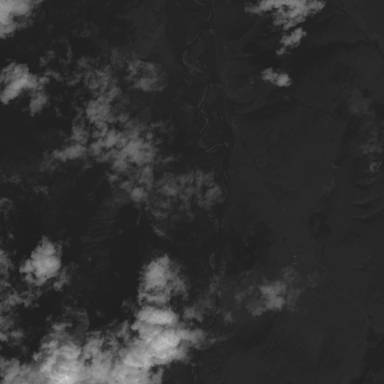

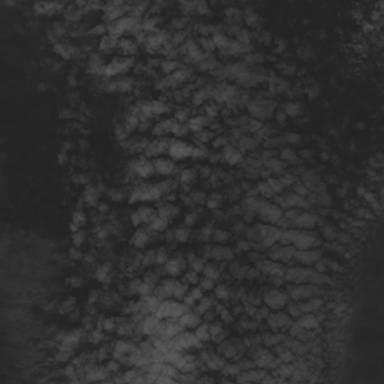

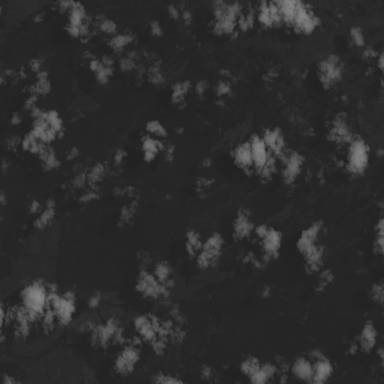
















Class balance #
There are 1 annotation classes in the dataset. Find the general statistics and balances for every class in the table below. Click any row to preview images that have labels of the selected class. Sort by column to find the most rare or prevalent classes.
Class ㅤ | Images ㅤ | Objects ㅤ | Count on image average | Area on image average |
|---|---|---|---|---|
cloud➔ mask | 18920 | 292496 | 15.46 | 53.67% |
Images #
Explore every single image in the dataset with respect to the number of annotations of each class it has. Click a row to preview selected image. Sort by any column to find anomalies and edge cases. Use horizontal scroll if the table has many columns for a large number of classes in the dataset.
Class sizes #
The table below gives various size properties of objects for every class. Click a row to see the image with annotations of the selected class. Sort columns to find classes with the smallest or largest objects or understand the size differences between classes.
Class | Object count | Avg area | Max area | Min area | Min height | Min height | Max height | Max height | Avg height | Avg height | Min width | Min width | Max width | Max width |
|---|---|---|---|---|---|---|---|---|---|---|---|---|---|---|
cloud mask | 292496 | 3.47% | 100% | 0.01% | 1px | 0.26% | 384px | 100% | 36px | 9.29% | 1px | 0.26% | 384px | 100% |
Spatial Heatmap #
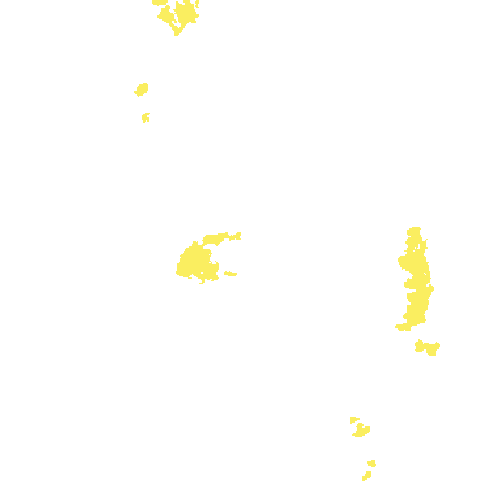
The heatmaps below give the spatial distributions of all objects for every class. These visualizations provide insights into the most probable and rare object locations on the image. It helps analyze objects' placements in a dataset.

Objects #
Table contains all 104857 objects. Click a row to preview an image with annotations, and use search or pagination to navigate. Sort columns to find outliers in the dataset.
Object ID ㅤ | Class ㅤ | Image name click row to open | Image size height x width | Height ㅤ | Height ㅤ | Width ㅤ | Width ㅤ | Area ㅤ |
|---|---|---|---|---|---|---|---|---|
1➔ | cloud mask | nir_patch_123_6_by_18_LC08_L1TP_045026_20160720_20170221_01_T1.TIF.tiff | 384 x 384 | 384px | 100% | 381px | 99.22% | 50.89% |
2➔ | cloud mask | nir_patch_123_6_by_18_LC08_L1TP_045026_20160720_20170221_01_T1.TIF.tiff | 384 x 384 | 55px | 14.32% | 50px | 13.02% | 0.93% |
3➔ | cloud mask | nir_patch_123_6_by_18_LC08_L1TP_045026_20160720_20170221_01_T1.TIF.tiff | 384 x 384 | 88px | 22.92% | 42px | 10.94% | 1.26% |
4➔ | cloud mask | nir_patch_123_6_by_18_LC08_L1TP_045026_20160720_20170221_01_T1.TIF.tiff | 384 x 384 | 23px | 5.99% | 13px | 3.39% | 0.08% |
5➔ | cloud mask | nir_patch_123_6_by_18_LC08_L1TP_045026_20160720_20170221_01_T1.TIF.tiff | 384 x 384 | 12px | 3.12% | 15px | 3.91% | 0.04% |
6➔ | cloud mask | nir_patch_123_6_by_18_LC08_L1TP_045026_20160720_20170221_01_T1.TIF.tiff | 384 x 384 | 37px | 9.64% | 59px | 15.36% | 0.77% |
7➔ | cloud mask | nir_patch_123_6_by_18_LC08_L1TP_045026_20160720_20170221_01_T1.TIF.tiff | 384 x 384 | 7px | 1.82% | 9px | 2.34% | 0.02% |
8➔ | cloud mask | nir_patch_123_6_by_18_LC08_L1TP_045026_20160720_20170221_01_T1.TIF.tiff | 384 x 384 | 5px | 1.3% | 4px | 1.04% | 0.01% |
9➔ | cloud mask | nir_patch_123_6_by_18_LC08_L1TP_045026_20160720_20170221_01_T1.TIF.tiff | 384 x 384 | 15px | 3.91% | 25px | 6.51% | 0.13% |
10➔ | cloud mask | nir_patch_123_6_by_18_LC08_L1TP_045026_20160720_20170221_01_T1.TIF.tiff | 384 x 384 | 69px | 17.97% | 57px | 14.84% | 1.63% |
License #
38-Cloud: Cloud Segmentation in Satellite Images is under Apache 2.0 license.
Citation #
If you make use of the 38-Cloud data, please cite the following reference:
@INPROCEEDINGS{38-cloud-1,
  author={S. {Mohajerani} and P. {Saeedi}},
  booktitle={IGARSS 2019 - 2019 IEEE International Geoscience and Remote Sensing Symposium},
  title={Cloud-Net: An End-To-End Cloud Detection Algorithm for Landsat 8 Imagery},
  year={2019},
  volume={},
  number={},
  pages={1029-1032},
  doi={10.1109/IGARSS.2019.8898776},
  ISSN={2153-6996},
  month={July},
}

@INPROCEEDINGS{38-cloud-2,
  author={S. Mohajerani and T. A. Krammer and P. Saeedi},
  booktitle={2018 IEEE 20th International Workshop on Multimedia Signal Processing (MMSP)},
  title={{"A Cloud Detection Algorithm for Remote Sensing Images Using Fully Convolutional Neural Networks"}},
  year={2018},
  pages={1-5},
  doi={10.1109/MMSP.2018.8547095},
  ISSN={2473-3628},
  month={Aug},
}
If you are happy with Dataset Ninja and use provided visualizations and tools in your work, please cite us:
@misc{ visualization-tools-for-38-cloud-dataset,
  title = { Visualization Tools for 38-Cloud Dataset },
  type = { Computer Vision Tools },
  author = { Dataset Ninja },
  howpublished = { \url{ https://datasetninja.com/38-cloud } },
  url = { https://datasetninja.com/38-cloud },
  journal = { Dataset Ninja },
  publisher = { Dataset Ninja },
  year = { 2026 },
  month = { feb },
  note = { visited on 2026-02-23 },
}
Download #
Dataset 38-Cloud can be downloaded in Supervisely format:
As an alternative, it can be downloaded with dataset-tools package:
pip install --upgrade dataset-tools
… using following python code:
import dataset_tools as dtools

dtools.download(dataset='38-Cloud', dst_dir='~/dataset-ninja/')
Make sure not to overlook the python code example available on the Supervisely Developer Portal. It will give you a clear idea of how to effortlessly work with the downloaded dataset.
The data in original format can be downloaded here.
Disclaimer #
Our gal from the legal dep told us we need to post this:
Dataset Ninja provides visualizations and statistics for some datasets that can be found online and can be downloaded by general audience. Dataset Ninja is not a dataset hosting platform and can only be used for informational purposes. The platform does not claim any rights for the original content, including images, videos, annotations and descriptions. Joint publishing is prohibited.
You take full responsibility when you use datasets presented at Dataset Ninja, as well as other information, including visualizations and statistics we provide. You are in charge of compliance with any dataset license and all other permissions. You are required to navigate datasets homepage and make sure that you can use it. In case of any questions, get in touch with us at hello@datasetninja.com.


