

Introduction #
In this study, the authors of the AAU-PD-T: Aalborg University Person Detection Thermal Dataset explore the effectiveness of thermal cameras in surveillance, emphasizing their precision in dark environments and privacy preservation. The authors highlight the inefficiency of manual data annotation in the era of data-driven problem-solving and advocate for the importance of a diverse dataset for transfer learning. The investigation involves a comprehensive analysis of a large thermal dataset recorded over 20 weeks, identifying nine distinct phenomena and assessing their impact on model adaptation in transfer learning.
The authors conduct a thorough review of publicly available thermal datasets, particularly focusing on those suitable for person detection. They identify limitations in existing datasets, such as short sequences with limited scene variability, and emphasize the necessity for datasets encompassing diverse weather and light conditions. The discussion notes the scarcity of datasets providing weather information, highlighting one dataset with weather conditions but with limited generalization potential due to its small size.
Novel Dataset
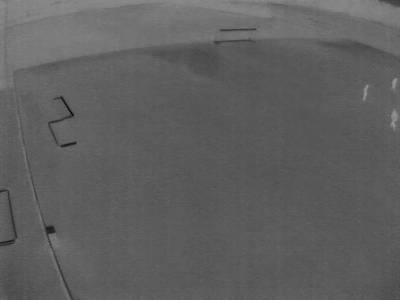
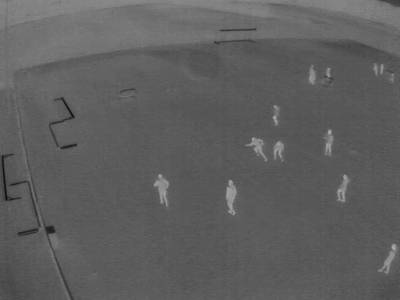
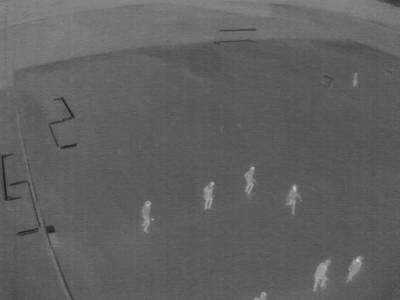
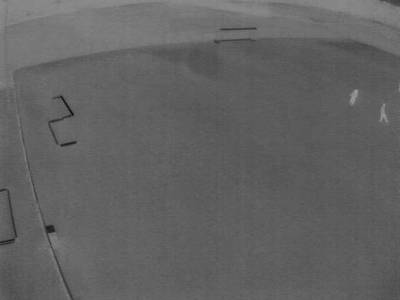
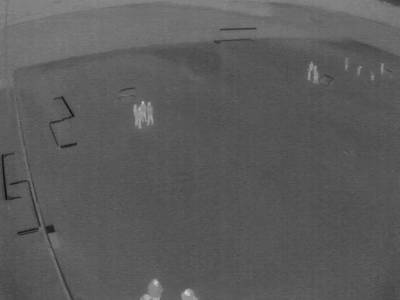
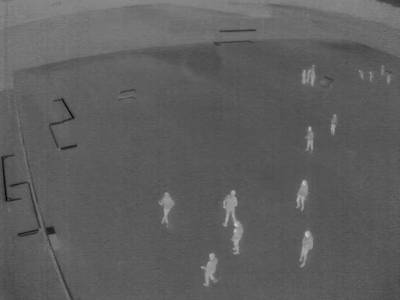
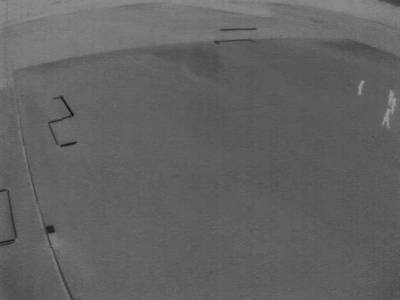
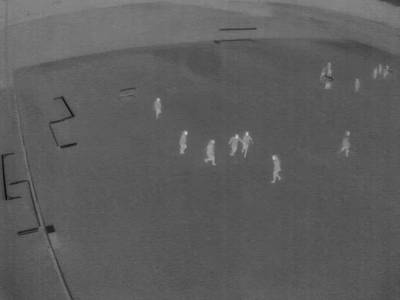
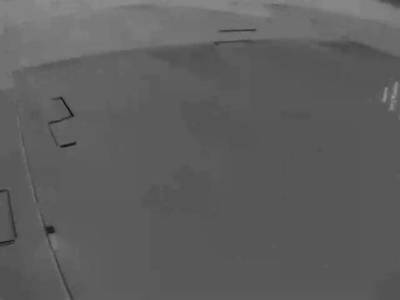
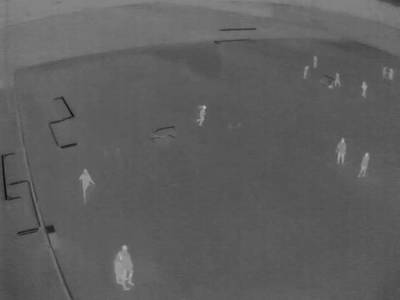
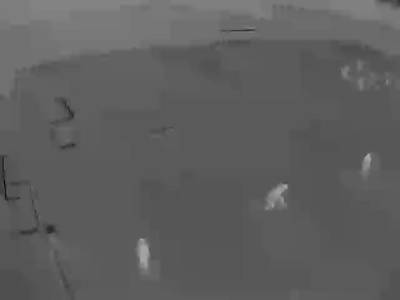
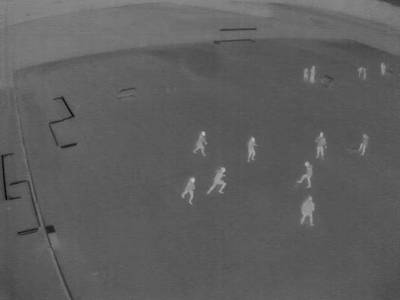
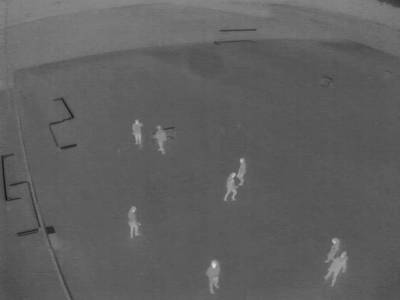
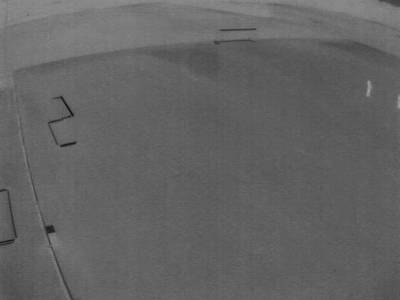
The primary contribution of this paper is the creation and exploration of a diverse thermal dataset for person detection. The dataset, recorded over 20 weeks in outdoor sports fields, addresses challenges related to varying scales, pose variations, interactions between people, and dynamic motions. The dataset spans different weather conditions, from winter snow to spring days, incorporating challenges like varying temperatures, shadows, wind, snow, and occlusions in thermal images. The authors propose nine distinct phenomena crucial for dataset diversity:
(a) low_resolution (b) far_viewpoint © wind (d) occlusion (e) shadow (f) snow (g) opposite_temperature (h) similar_temperature (i) good_condition
Data Recording
The authors detail the data acquisition process, involving the recording of thermal videos from 10 different sports fields using Axis Q1921 and Axis 1922 cameras. The cameras, mounted approximately 9 meters above the ground, captured sequences from various perspectives. The recordings spanned from January 2018 to April 2018, totaling 20 weeks of data.
| Category | Phenomena | # of Frames | # of Persons |
|---|---|---|---|
| Viewpoint | Good condition | 122 | 632 |
| Viewpoint | Far viewpoint | 64 | 652 |
| Heat effects | Opposite temperature | 72 | 792 |
| Heat effects | Similar temperature | 107 | 644 |
| Image artifacts | Low resolution | 158 | 734 |
| Image artifacts | fOcclusion | 20 | 305 |
| Weather effects | Shadow | 171 | 742 |
| Weather effects | Snow | 1060 | 168 |
| Weather effects | Wind | 167 | 921 |
Data Description
To facilitate model adaptation in transfer learning, the authors used 3000 indoor publicly available images for pre-training. The new dataset, designed for generalization in outdoor person detection, was recorded in an outdoor environment and included annotations for all nine identified phenomena. Due to the impracticality of manual annotation for the entire dataset, frames were selected at a temporal gap of 160 seconds, resulting in 1941 frames for the train split. test split involved randomly selecting 1000 frames from the recorded data, ensuring no overlap with the training set.
 Homepage
 Research Paper
 Kaggle
Summary #
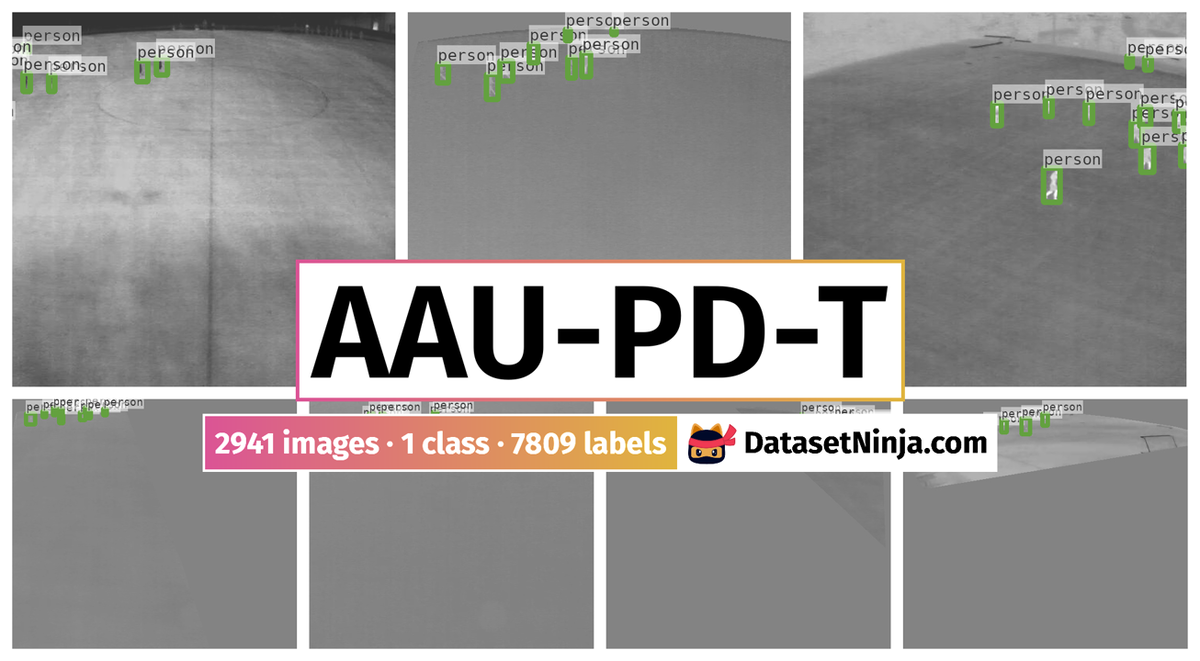
AAU-PD-T: Aalborg University Person Detection Thermal Dataset is a dataset for an object detection task. It is used in the surveillance domain.
The dataset consists of 2941 images with 7809 labeled objects belonging to 1 single class (person).
Images in the AAU-PD-T dataset have bounding box annotations. There are 1997 (68% of the total) unlabeled images (i.e. without annotations). There are 2 splits in the dataset: train (1941 images) and test (1000 images). Alternatively, the dataset could be split into 9 phenomena: snow (1060 images), shadow (171 images), wind (167 images), low_resolution (158 images), good_condition (122 images), similar_temperature (107 images), opposite_temperature (72 images), far_viewpoint (64 images), and occlusion (20 images). The dataset was released in 2020 by the Aalborg University, Denmark.
Explore #
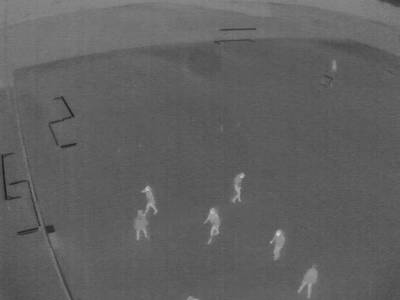
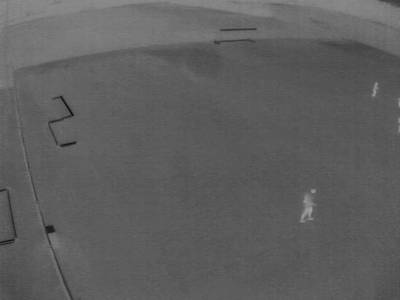
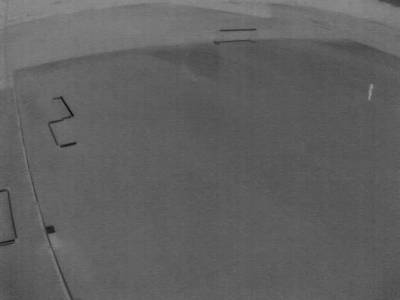
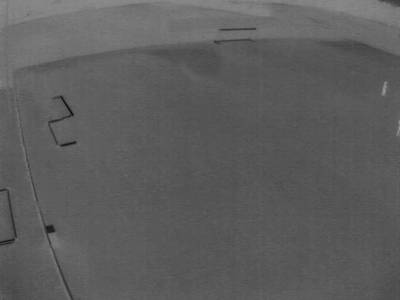
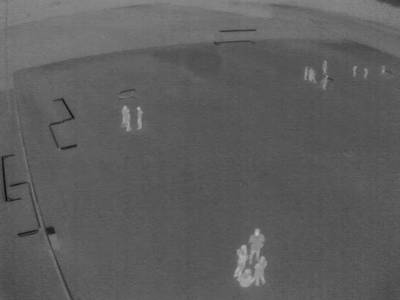
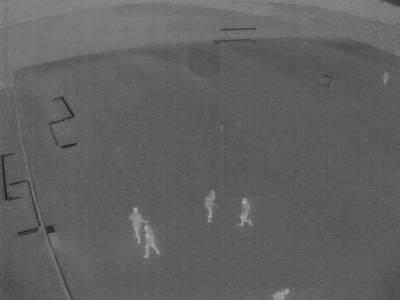
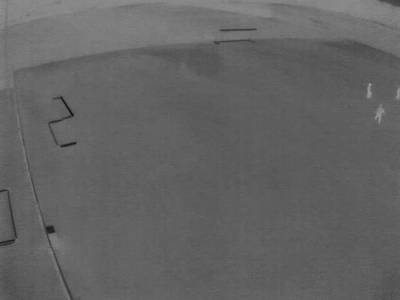
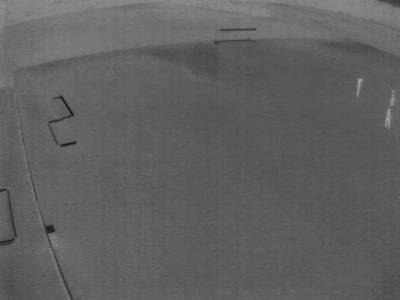
AAU-PD-T dataset has 2941 images. Click on one of the examples below or open "Explore" tool anytime you need to view dataset images with annotations. This tool has extended visualization capabilities like zoom, translation, objects table, custom filters and more. Hover the mouse over the images to hide or show annotations.


Class balance #
There are 1 annotation classes in the dataset. Find the general statistics and balances for every class in the table below. Click any row to preview images that have labels of the selected class. Sort by column to find the most rare or prevalent classes.

Class ㅤ | Images ㅤ | Objects ㅤ | Count on image average | Area on image average |
|---|---|---|---|---|
person➔ rectangle | 944 | 7809 | 8.27 | 1.37% |
Images #
Explore every single image in the dataset with respect to the number of annotations of each class it has. Click a row to preview selected image. Sort by any column to find anomalies and edge cases. Use horizontal scroll if the table has many columns for a large number of classes in the dataset.
Object distribution #
Interactive heatmap chart for every class with object distribution shows how many images are in the dataset with a certain number of objects of a specific class. Users can click cell and see the list of all corresponding images.
Class sizes #
The table below gives various size properties of objects for every class. Click a row to see the image with annotations of the selected class. Sort columns to find classes with the smallest or largest objects or understand the size differences between classes.
Class | Object count | Avg area | Max area | Min area | Min height | Min height | Max height | Max height | Avg height | Avg height | Min width | Min width | Max width | Max width |
|---|---|---|---|---|---|---|---|---|---|---|---|---|---|---|
person rectangle | 7809 | 0.17% | 99.64% | 0% | 1px | 0.21% | 479px | 99.79% | 28px | 5.88% | 2px | 0.31% | 639px | 99.84% |
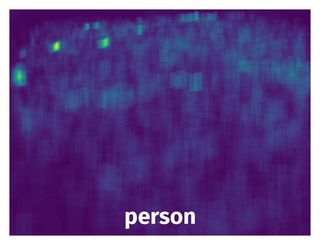
Spatial Heatmap #
The heatmaps below give the spatial distributions of all objects for every class. These visualizations provide insights into the most probable and rare object locations on the image. It helps analyze objects' placements in a dataset.
Objects #
Table contains all 7809 objects. Click a row to preview an image with annotations, and use search or pagination to navigate. Sort columns to find outliers in the dataset.
Object ID ㅤ | Class ㅤ | Image name click row to open | Image size height x width | Height ㅤ | Height ㅤ | Width ㅤ | Width ㅤ | Area ㅤ |
|---|---|---|---|---|---|---|---|---|
1➔ | person rectangle | Wind_Image_106.jpg | 480 x 640 | 46px | 9.58% | 29px | 4.53% | 0.43% |
2➔ | person rectangle | Wind_Image_106.jpg | 480 x 640 | 62px | 12.92% | 25px | 3.91% | 0.5% |
3➔ | person rectangle | Wind_Image_106.jpg | 480 x 640 | 47px | 9.79% | 24px | 3.75% | 0.37% |
4➔ | person rectangle | Wind_Image_106.jpg | 480 x 640 | 49px | 10.21% | 32px | 5% | 0.51% |
5➔ | person rectangle | Wind_Image_106.jpg | 480 x 640 | 51px | 10.62% | 27px | 4.22% | 0.45% |
6➔ | person rectangle | Wind_Image_106.jpg | 480 x 640 | 48px | 10% | 20px | 3.12% | 0.31% |
7➔ | person rectangle | Wind_Image_106.jpg | 480 x 640 | 54px | 11.25% | 24px | 3.75% | 0.42% |
8➔ | person rectangle | Wind_Image_106.jpg | 480 x 640 | 56px | 11.67% | 27px | 4.22% | 0.49% |
9➔ | person rectangle | Similar_temperature_Image_96.jpg | 480 x 640 | 16px | 3.33% | 9px | 1.41% | 0.05% |
10➔ | person rectangle | Similar_temperature_Image_96.jpg | 480 x 640 | 21px | 4.38% | 10px | 1.56% | 0.07% |
License #
The AAU-PD-T: Aalborg University Person Detection Thermal Dataset is publicly available.
Citation #
If you make use of the AAU-PD-T data, please cite the following reference:
@article{DiverseData,
  title={The Effect of a Diverse Dataset for Transfer Learning in Thermal Person Detection},
  author={Huda, Noor Ul and Hansen, Bolette D. and Gade, Rikke and Moeslund, Thomas B},
  journal={Sensors},
  volume={20},
  number={7},
  year={2020},
}
If you are happy with Dataset Ninja and use provided visualizations and tools in your work, please cite us:
@misc{ visualization-tools-for-aau-pd-t-dataset,
  title = { Visualization Tools for AAU-PD-T Dataset },
  type = { Computer Vision Tools },
  author = { Dataset Ninja },
  howpublished = { \url{ https://datasetninja.com/aau-pd-t } },
  url = { https://datasetninja.com/aau-pd-t },
  journal = { Dataset Ninja },
  publisher = { Dataset Ninja },
  year = { 2026 },
  month = { jul },
  note = { visited on 2026-07-27 },
}
Download #
Dataset AAU-PD-T can be downloaded in Supervisely format:
As an alternative, it can be downloaded with dataset-tools package:
pip install --upgrade dataset-tools
… using following python code:
import dataset_tools as dtools

dtools.download(dataset='AAU-PD-T', dst_dir='~/dataset-ninja/')
Make sure not to overlook the python code example available on the Supervisely Developer Portal. It will give you a clear idea of how to effortlessly work with the downloaded dataset.
The data in original format can be downloaded here.
Disclaimer #
Our gal from the legal dep told us we need to post this:
Dataset Ninja provides visualizations and statistics for some datasets that can be found online and can be downloaded by general audience. Dataset Ninja is not a dataset hosting platform and can only be used for informational purposes. The platform does not claim any rights for the original content, including images, videos, annotations and descriptions. Joint publishing is prohibited.
You take full responsibility when you use datasets presented at Dataset Ninja, as well as other information, including visualizations and statistics we provide. You are in charge of compliance with any dataset license and all other permissions. You are required to navigate datasets homepage and make sure that you can use it. In case of any questions, get in touch with us at hello@datasetninja.com.