
Introduction #
In pursuit of an accurate and dependable image-based fruit detection system to support advanced agricultural tasks such as yield mapping and robotic harvesting, the authors of the ACFR Orchard Fruit Dataset (ACFR is Australian Centre for Robotics) dataset introduce the application of an object detection framework, Faster R-CNN. This framework is employed within the context of orchard fruit detection, encompassing various fruit types, including mangoes, almonds, and apples.
In agricultural automation, vision-based fruit detection stands as a pivotal element. It provides the foundation for in-field automation, enabling tasks such as yield estimation, mapping, and ultimately contributing to efficient resource utilization and enhanced returns per unit area and time. Additionally, precise fruit localization is an indispensable aspect of automated robotic harvesting systems, offering relief from one of the most labor-intensive challenges in orchard management.
Data Acquisition
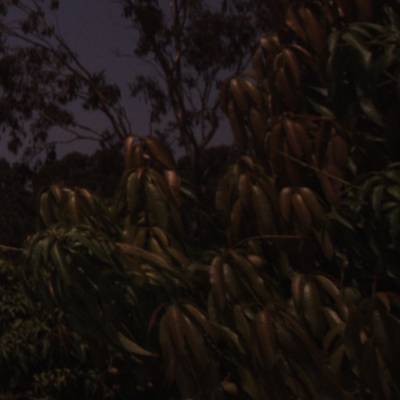
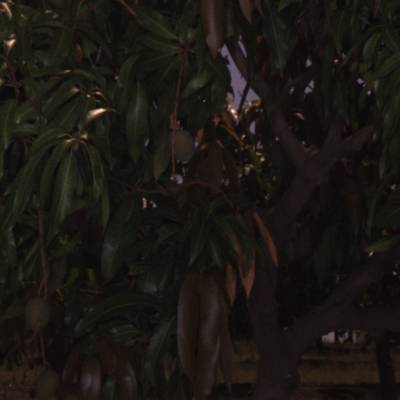
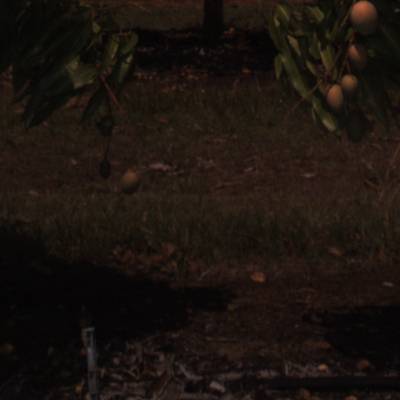
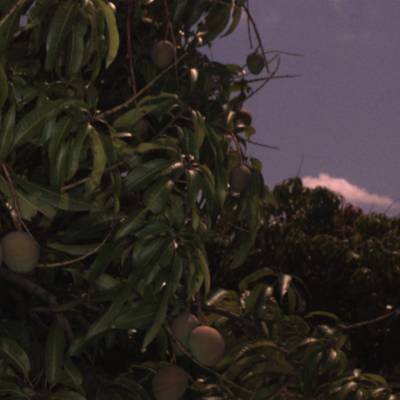
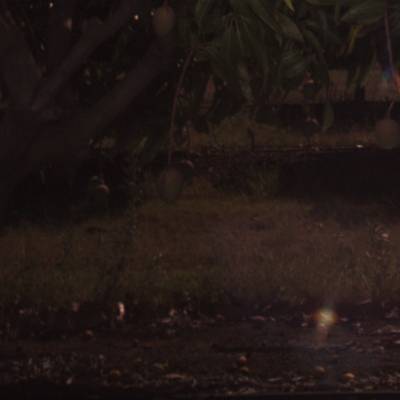
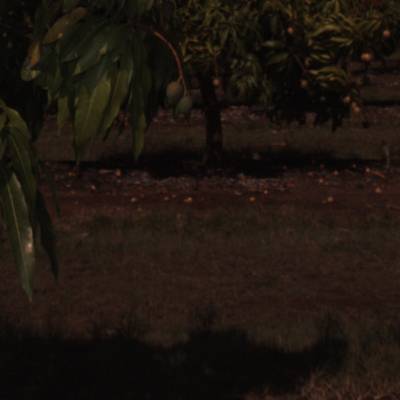
The dataset under evaluation in this study encompasses three distinct fruit varieties: apple, almond, and mango. These data were collected during daylight hours at orchards located in Victoria and Queensland, Australia. For data collection, apple and mango data were acquired through sensors integrated into a versatile research ground vehicle developed at the Australian Centre for Field Robotics. This vehicle traversed different orchard rows to collect tree image data. Apple trees, which are trellised, allow the ground vehicle to maintain close proximity to the fruit. In contrast, the greater distance between mangoes and the ground vehicle was compensated for with a higher resolution sensor. In the mango orchard, external strobe lighting with a brief exposure time (approximately 70 µs) was employed to mitigate variable illumination artifacts. Almond trees, characterized by larger canopies and the potential to host between 1000 to 10,000 almonds, necessitated high-resolution imagery, which was acquired using a handheld DSLR camera. The images captured for each orchard encompassed entire trees, aligning with the primary research goal of efficient yield estimation and mapping. The fruit detection aspect presented in this paper constitutes a pivotal component of this overarching project.
| Fruit | Image Info | Annotation Info | Notes |
|---|---|---|---|
| Apples | 1120 Images PNG Image Data 308 x 202, 8-bit/color RGB Sensor: PointGrey Ladybug3 |
Circle Annotation (x,y,radius) Pixel-wise annotation |
Collected at Warburton, Australia Apple varieties: Pink Lady, Kanzi |
| Mangoes | 1964 Images PNG Image Data 500 x 500, 16-bit/color RGB Sensor: Prosilica GT3300c Strobes Used |
Rectangle Annotation (x,y,dx,dy) | Collected at Bundaberg, Australia Mango varieties: Calypso |
| Almonds | 620 Images PNG Image Data 308 x 202, 8-bit/color RGB Sensor: Canon EOS60D |
Rectangle Annotation (x,y,dx,dy) | Collected at Mildura, Australia Almond variety: Nonpareil |
The tree image data exhibited variations in size, ranging from 2 to 17 megapixels, with each image containing approximately 100 fruit for apples and mangoes, and over 1000 fruit for almonds. However, hardware constraints limited the usage of large images. For instance, a 0.25-megapixel image requires around 2.5 gigabytes of GPU memory with the VGG16 network. Additionally, labeling a substantial number of small objects within large images proved to be a perceptually challenging task. To address these challenges, the authors mitigated them by randomly sampling smaller sub-image patches from the pool of larger images obtained across the farm. This approach yielded smaller images, akin in size to the PASCAL-VOC dataset used with Faster R-CNN, featuring lower fruit counts while effectively covering data variability across the farm.
Labeling Process
The ground truth fruit annotations for almonds and mangoes were established through rectangular annotations, while circular annotations were better suited for apples. However, since Faster R-CNN operates on bounding box predictions, circular annotations were initially converted to rectangles with equal width and height. Note, that DatasetNinja converted circle bounding boxes to rectangular ones. In practice, labeling apples and mangoes was relatively more straightforward compared to almonds, primarily due to the size and contrast of the fruit in relation to the surrounding foliage and the canopy’s complexity. To facilitate fruit-background differentiation in shadowed regions of the image, the annotation software incorporated sliders for contrast and brightness adjustments.
Finally, each fruit’s labeled dataset was subdivided into training, validation, and testing sets. This division was carefully structured to ensure that each set comprised data collected from different sections of the orchard block, minimizing potential biases in the results. Images in the training set lacking any fruit presence were excluded from consideration.
 Homepage
 Research Paper
Summary #
ACFR Orchard Fruit Dataset is a dataset for an object detection task. It is used in the agricultural and robotics industries.
The dataset consists of 3704 images with 17607 labeled objects belonging to 3 different classes including mango, apple, and almond.
Images in the ACFR dataset have bounding box annotations. There are 677 (18% of the total) unlabeled images (i.e. without annotations). There are 3 splits in the dataset: train (2780 images), test (462 images), and val (462 images). The dataset was released in 2016 by the University of Sydney, Australia.

Explore #
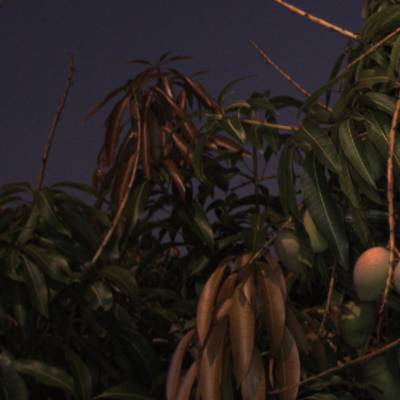
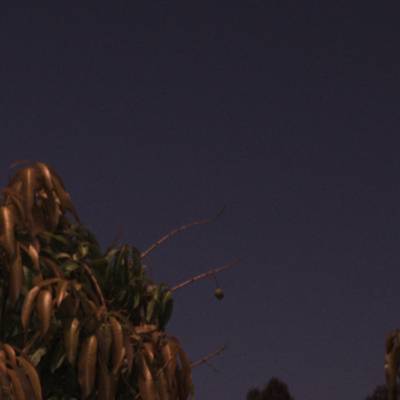
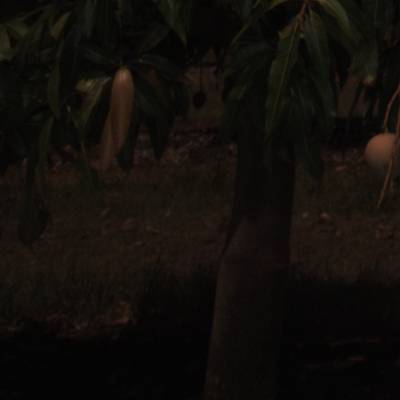
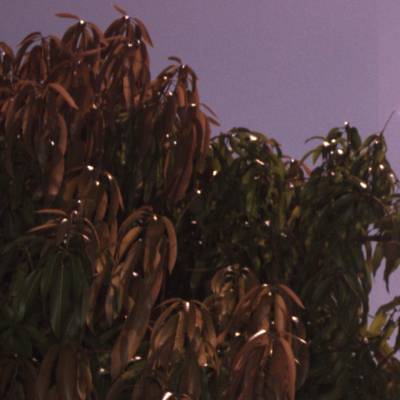
ACFR dataset has 3704 images. Click on one of the examples below or open "Explore" tool anytime you need to view dataset images with annotations. This tool has extended visualization capabilities like zoom, translation, objects table, custom filters and more. Hover the mouse over the images to hide or show annotations.


Class balance #
There are 3 annotation classes in the dataset. Find the general statistics and balances for every class in the table below. Click any row to preview images that have labels of the selected class. Sort by column to find the most rare or prevalent classes.

Class ㅤ | Images ㅤ | Objects ㅤ | Count on image average | Area on image average |
|---|---|---|---|---|
mango➔ rectangle | 1399 | 7065 | 5.05 | 2.9% |
apple➔ any | 1056 | 5765 | 5.46 | 11.26% |
almond➔ rectangle | 572 | 4777 | 8.35 | 6.63% |
Co-occurrence matrix #
Co-occurrence matrix is an extremely valuable tool that shows you the images for every pair of classes: how many images have objects of both classes at the same time. If you click any cell, you will see those images. We added the tooltip with an explanation for every cell for your convenience, just hover the mouse over a cell to preview the description.
Images #
Explore every single image in the dataset with respect to the number of annotations of each class it has. Click a row to preview selected image. Sort by any column to find anomalies and edge cases. Use horizontal scroll if the table has many columns for a large number of classes in the dataset.
Object distribution #
Interactive heatmap chart for every class with object distribution shows how many images are in the dataset with a certain number of objects of a specific class. Users can click cell and see the list of all corresponding images.
Class sizes #
The table below gives various size properties of objects for every class. Click a row to see the image with annotations of the selected class. Sort columns to find classes with the smallest or largest objects or understand the size differences between classes.
Class | Object count | Avg area | Max area | Min area | Min height | Min height | Max height | Max height | Avg height | Avg height | Min width | Min width | Max width | Max width |
|---|---|---|---|---|---|---|---|---|---|---|---|---|---|---|
mango rectangle | 7065 | 0.6% | 4.22% | 0.03% | 6px | 1.2% | 134px | 26.8% | 40px | 7.98% | 7px | 1.4% | 96px | 19.2% |
apple any | 5765 | 2.31% | 16.4% | 0.41% | 14px | 6.93% | 101px | 50% | 37px | 18.33% | 14px | 4.55% | 101px | 32.79% |
almond rectangle | 4777 | 0.84% | 3.48% | 0.18% | 11px | 3.67% | 59px | 19.67% | 27px | 8.99% | 11px | 3.67% | 57px | 19% |
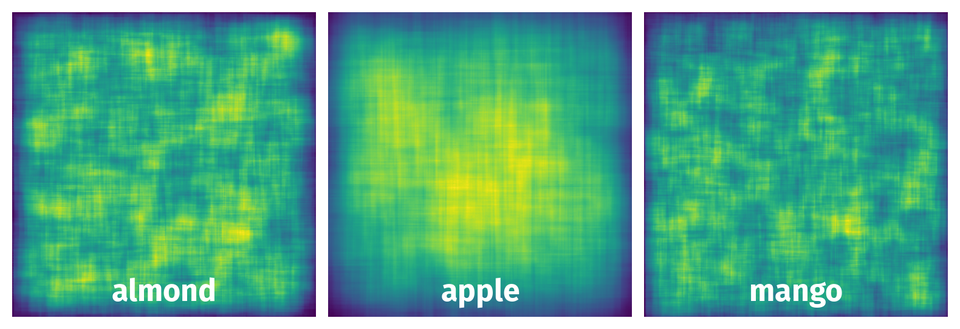
Spatial Heatmap #
The heatmaps below give the spatial distributions of all objects for every class. These visualizations provide insights into the most probable and rare object locations on the image. It helps analyze objects' placements in a dataset.
Objects #
Table contains all 17607 objects. Click a row to preview an image with annotations, and use search or pagination to navigate. Sort columns to find outliers in the dataset.
Object ID ㅤ | Class ㅤ | Image name click row to open | Image size height x width | Height ㅤ | Height ㅤ | Width ㅤ | Width ㅤ | Area ㅤ |
|---|---|---|---|---|---|---|---|---|
1➔ | mango rectangle | 20151124T031425.289422_i2237j1569.png | 500 x 500 | 47px | 9.4% | 36px | 7.2% | 0.68% |
2➔ | mango rectangle | 20151124T031425.289422_i2237j1569.png | 500 x 500 | 42px | 8.4% | 40px | 8% | 0.67% |
3➔ | mango rectangle | 20151124T031425.289422_i2237j1569.png | 500 x 500 | 40px | 8% | 36px | 7.2% | 0.58% |
4➔ | mango rectangle | 20151124T031425.289422_i2237j1569.png | 500 x 500 | 33px | 6.6% | 29px | 5.8% | 0.38% |
5➔ | mango rectangle | 20151124T032536.413978_i2373j1132.png | 500 x 500 | 34px | 6.8% | 29px | 5.8% | 0.39% |
6➔ | mango rectangle | 20151124T032028.220332_i2319j505.png | 500 x 500 | 31px | 6.2% | 31px | 6.2% | 0.38% |
7➔ | mango rectangle | 20151124T032028.220332_i2319j505.png | 500 x 500 | 28px | 5.6% | 27px | 5.4% | 0.3% |
8➔ | apple any | 20130320T005932.773614.Cam6_22.png | 202 x 308 | 49px | 24.26% | 49px | 15.91% | 3.86% |
9➔ | apple any | 20130320T005932.773614.Cam6_22.png | 202 x 308 | 45px | 22.28% | 45px | 14.61% | 3.25% |
10➔ | apple any | 20130320T005932.773614.Cam6_22.png | 202 x 308 | 45px | 22.28% | 45px | 14.61% | 3.25% |
License #
License is unknown for the ACFR Orchard Fruit Dataset dataset.
Citation #
If you make use of the ACFR data, please cite the following reference:
For fruit level annotations:
@article{bargoti2016deep,
  title={Deep Fruit Detection in Orchards},
  author={Bargoti, Suchet and Underwood, James},
  journal={arXiv preprint arXiv:1610.03677},
  year={2016}
}

For pixel level segmentations (apple only):
@article{Bargoti2016,
  author={Bargoti, Suchet and Underwood, James},
  journal={To Appear in Journal of Field Robotics},
  title={Image Segmentation for Fruit Detection and Yield Estimation in Apple Orchards},
  year={2016}
}
If you are happy with Dataset Ninja and use provided visualizations and tools in your work, please cite us:
@misc{ visualization-tools-for-acfr-multifruit-dataset,
  title = { Visualization Tools for ACFR Dataset },
  type = { Computer Vision Tools },
  author = { Dataset Ninja },
  howpublished = { \url{ https://datasetninja.com/acfr-multifruit-2016 } },
  url = { https://datasetninja.com/acfr-multifruit-2016 },
  journal = { Dataset Ninja },
  publisher = { Dataset Ninja },
  year = { 2026 },
  month = { jul },
  note = { visited on 2026-07-14 },
}
Download #
Please visit dataset homepage to download the data.
Disclaimer #
Our gal from the legal dep told us we need to post this:
Dataset Ninja provides visualizations and statistics for some datasets that can be found online and can be downloaded by general audience. Dataset Ninja is not a dataset hosting platform and can only be used for informational purposes. The platform does not claim any rights for the original content, including images, videos, annotations and descriptions. Joint publishing is prohibited.
You take full responsibility when you use datasets presented at Dataset Ninja, as well as other information, including visualizations and statistics we provide. You are in charge of compliance with any dataset license and all other permissions. You are required to navigate datasets homepage and make sure that you can use it. In case of any questions, get in touch with us at hello@datasetninja.com.