
Introduction #
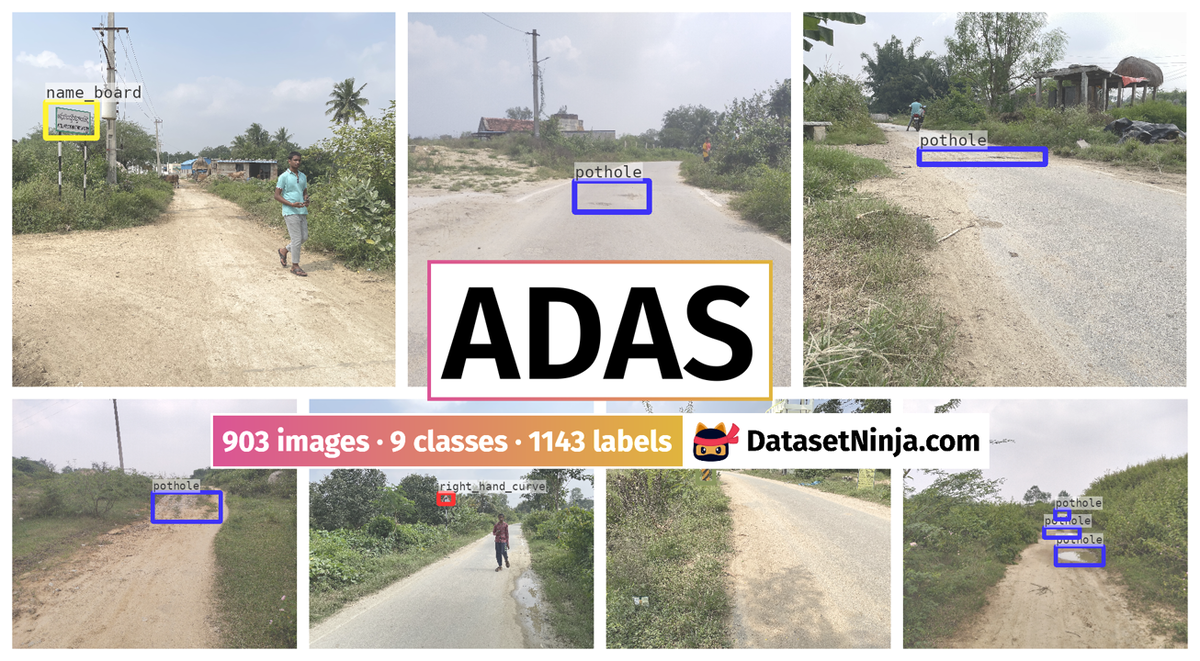
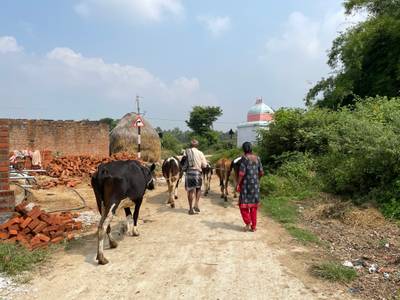
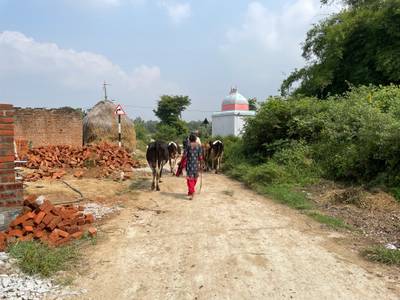
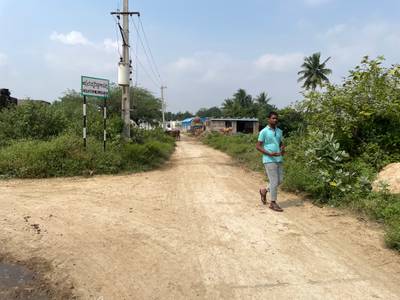
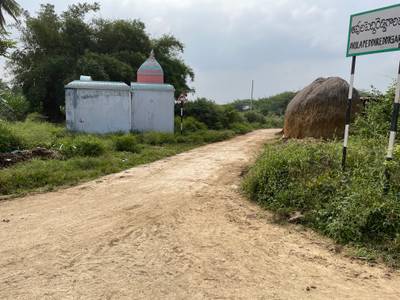
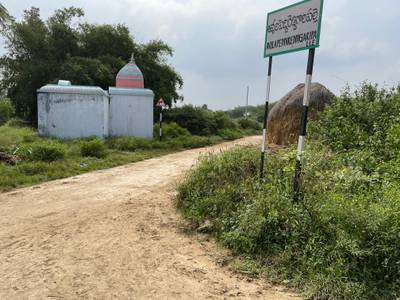
ADAS: Dataset for Advance Driver Assistant Systems is designed for object detection in Advanced Driver Assistance Systems, comprising 903 images and 1143 labeled objects across 9 classes like pothole, left_hand_curve, right_hand_curve, and other: speed_breaker, bridge_ahead, pedestrian, animal, name_board, and vehicle. The dataset covers diverse scenarios, including different road types, times of day, and capture angles. Notably, images were taken with two phone models, iPhone 12 and VIVO, ensuring variability for robust model evaluation.
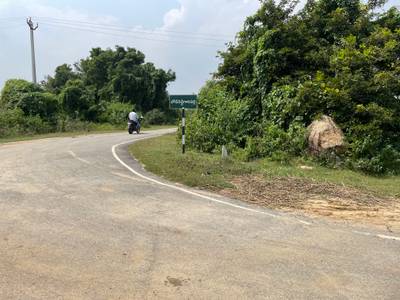
Based on the exploration conducted, the author identified a shortage of datasets catering to solving Driver Assistant use cases, encompassing critical tasks like road sign detection, pedestrian detection, vehicle detection, animal detection, pothole detection, speed breaker detection, and more.
Different scenarios that authors considered:
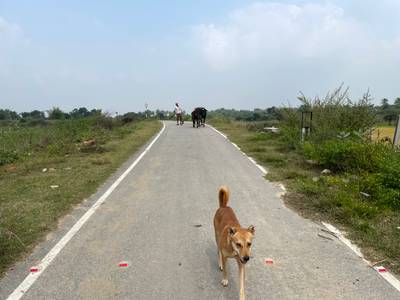
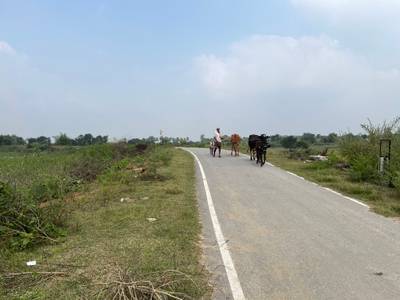
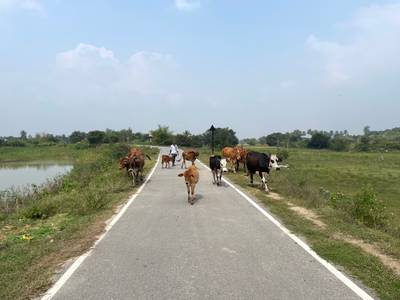
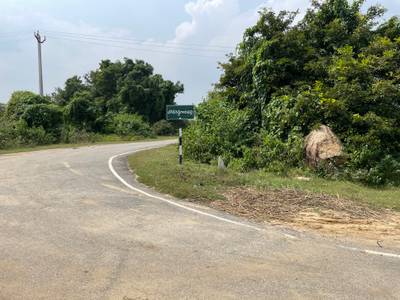
- Different type of roads (Highways, town roads, street/village roads)
- Different time (Darkness,Sunny, Rainy, Fog, crowded place and cloudy)
- Maintain distance/different angles to capture objects on the road.
Also used 2 different configuration phones to capture images. (iphone 12 and VIVO)
Authors labelled data using the “labelme” tool. There are considered labels, across all categories:
- animal
- pedestrian
- name_board
- speed_beaker
- pothole
- right_hand_curve
- bridge_ahead
- left_hand_curve
 Homepage
Summary #
ADAS: Dataset for Advance Driver Assistant Systems is a dataset for an object detection task. Possible applications of the dataset could be in the automotive industry.
The dataset consists of 903 images with 1143 labeled objects belonging to 9 different classes including pothole, left_hand_curve, right_hand_curve, and other: speed_breaker, bridge_ahead, pedestrian, animal, name_board, and vehicle.
Images in the ADAS dataset have bounding box annotations. There are 62 (7% of the total) unlabeled images (i.e. without annotations). There are no pre-defined train/val/test splits in the dataset. Also, the dataset contains id, camera and category tags. Pothole category with iPhone 12 camera tag also includes road_type tag. The dataset was released in 2022.
Explore #
ADAS dataset has 903 images. Click on one of the examples below or open "Explore" tool anytime you need to view dataset images with annotations. This tool has extended visualization capabilities like zoom, translation, objects table, custom filters and more. Hover the mouse over the images to hide or show annotations.


Class balance #
There are 9 annotation classes in the dataset. Find the general statistics and balances for every class in the table below. Click any row to preview images that have labels of the selected class. Sort by column to find the most rare or prevalent classes.

Class ㅤ | Images ㅤ | Objects ㅤ | Count on image average | Area on image average |
|---|---|---|---|---|
pothole➔ rectangle | 369 | 607 | 1.64 | 2.61% |
left_hand_curve➔ rectangle | 111 | 111 | 1 | 0.2% |
right_hand_curve➔ rectangle | 107 | 107 | 1 | 0.26% |
speed_breaker➔ rectangle | 96 | 96 | 1 | 4.69% |
bridge_ahead➔ rectangle | 70 | 70 | 1 | 0.54% |
pedestrian➔ rectangle | 58 | 88 | 1.52 | 3.37% |
animal➔ rectangle | 15 | 44 | 2.93 | 5.2% |
name_board➔ rectangle | 12 | 12 | 1 | 1.06% |
vehicle➔ rectangle | 8 | 8 | 1 | 1.29% |
Co-occurrence matrix #
Co-occurrence matrix is an extremely valuable tool that shows you the images for every pair of classes: how many images have objects of both classes at the same time. If you click any cell, you will see those images. We added the tooltip with an explanation for every cell for your convenience, just hover the mouse over a cell to preview the description.
Images #
Explore every single image in the dataset with respect to the number of annotations of each class it has. Click a row to preview selected image. Sort by any column to find anomalies and edge cases. Use horizontal scroll if the table has many columns for a large number of classes in the dataset.
Object distribution #
Interactive heatmap chart for every class with object distribution shows how many images are in the dataset with a certain number of objects of a specific class. Users can click cell and see the list of all corresponding images.
Class sizes #
The table below gives various size properties of objects for every class. Click a row to see the image with annotations of the selected class. Sort columns to find classes with the smallest or largest objects or understand the size differences between classes.
Class | Object count | Avg area | Max area | Min area | Min height | Min height | Max height | Max height | Avg height | Avg height | Min width | Min width | Max width | Max width |
|---|---|---|---|---|---|---|---|---|---|---|---|---|---|---|
pothole rectangle | 607 | 1.59% | 24.39% | 0.01% | 24px | 0.8% | 1399px | 46.63% | 250px | 8.31% | 58px | 1.45% | 2835px | 70.31% |
left_hand_curve rectangle | 111 | 0.2% | 0.87% | 0.02% | 51px | 1.69% | 280px | 9.26% | 133px | 4.35% | 53px | 1.31% | 377px | 9.35% |
right_hand_curve rectangle | 107 | 0.26% | 0.71% | 0.07% | 78px | 2.6% | 301px | 10.03% | 152px | 5.04% | 101px | 2.52% | 348px | 8.63% |
speed_breaker rectangle | 96 | 4.69% | 19.13% | 0.43% | 46px | 1.53% | 790px | 26.33% | 246px | 8.18% | 1038px | 25.95% | 3792px | 94.8% |
pedestrian rectangle | 88 | 2.22% | 13.27% | 0.2% | 189px | 6.25% | 1904px | 63.47% | 704px | 23.25% | 86px | 2.13% | 957px | 23.93% |
bridge_ahead rectangle | 70 | 0.54% | 14.95% | 0.1% | 104px | 3.47% | 512px | 17.07% | 240px | 7.87% | 78px | 1.95% | 3504px | 87.6% |
animal rectangle | 44 | 1.78% | 11.5% | 0.09% | 109px | 3.63% | 1175px | 39.17% | 455px | 15.11% | 98px | 2.43% | 1334px | 33.09% |
name_board rectangle | 12 | 1.06% | 3.21% | 0.39% | 173px | 5.77% | 598px | 19.78% | 286px | 9.47% | 273px | 6.83% | 654px | 16.22% |
vehicle rectangle | 8 | 1.28% | 2.58% | 0.31% | 222px | 7.34% | 648px | 21.43% | 395px | 13.07% | 169px | 4.19% | 630px | 15.62% |
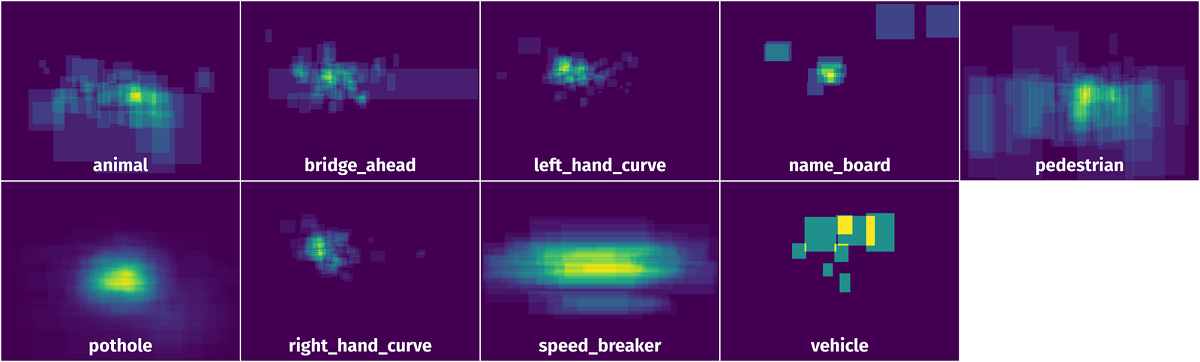
Spatial Heatmap #
The heatmaps below give the spatial distributions of all objects for every class. These visualizations provide insights into the most probable and rare object locations on the image. It helps analyze objects' placements in a dataset.
Objects #
Table contains all 1143 objects. Click a row to preview an image with annotations, and use search or pagination to navigate. Sort columns to find outliers in the dataset.
Object ID ㅤ | Class ㅤ | Image name click row to open | Image size height x width | Height ㅤ | Height ㅤ | Width ㅤ | Width ㅤ | Area ㅤ |
|---|---|---|---|---|---|---|---|---|
1➔ | pothole rectangle | IMG_3652.jpg | 3024 x 4032 | 333px | 11.01% | 1072px | 26.59% | 2.93% |
2➔ | pothole rectangle | IMG_20221106_112423.jpg | 3000 x 4000 | 187px | 6.23% | 436px | 10.9% | 0.68% |
3➔ | pothole rectangle | IMG_3678.jpg | 3024 x 4032 | 228px | 7.54% | 637px | 15.8% | 1.19% |
4➔ | bridge_ahead rectangle | IMG_3896.jpg | 3024 x 4032 | 307px | 10.15% | 192px | 4.76% | 0.48% |
5➔ | pothole rectangle | IMG_20221106_122526.jpg | 3000 x 4000 | 569px | 18.97% | 696px | 17.4% | 3.3% |
6➔ | right_hand_curve rectangle | road_sign_IMG_3596.jpg | 3024 x 4032 | 228px | 7.54% | 348px | 8.63% | 0.65% |
7➔ | pothole rectangle | IMG_20221106_113403.jpg | 3000 x 4000 | 123px | 4.1% | 338px | 8.45% | 0.35% |
8➔ | bridge_ahead rectangle | IMG_20221112_044545.jpg | 3000 x 4000 | 149px | 4.97% | 107px | 2.67% | 0.13% |
9➔ | right_hand_curve rectangle | IMG_20221112_045919.jpg | 3000 x 4000 | 96px | 3.2% | 141px | 3.52% | 0.11% |
10➔ | pothole rectangle | IMG_20221106_123505.jpg | 3000 x 4000 | 273px | 9.1% | 461px | 11.53% | 1.05% |
License #
License is unknown for the Dataset for Advance Driver Assistant Systems (ADAS) dataset.
Citation #
If you make use of the ADAS data, please cite the following reference:
@dataset{ADAS,
  author={Prabhu Somsai Talari and Pallavi Ramicetty},
  title={Dataset for Advance Driver Assistant Systems (ADAS)},
  year={2022},
  url={https://www.kaggle.com/datasets/prabhusomsaitalari/dataset-for-driver-assistant-ml-models}
}
If you are happy with Dataset Ninja and use provided visualizations and tools in your work, please cite us:
@misc{ visualization-tools-for-adas-dataset,
  title = { Visualization Tools for ADAS Dataset },
  type = { Computer Vision Tools },
  author = { Dataset Ninja },
  howpublished = { \url{ https://datasetninja.com/adas } },
  url = { https://datasetninja.com/adas },
  journal = { Dataset Ninja },
  publisher = { Dataset Ninja },
  year = { 2026 },
  month = { jul },
  note = { visited on 2026-07-20 },
}
Download #
Please visit dataset homepage to download the data.
Disclaimer #
Our gal from the legal dep told us we need to post this:
Dataset Ninja provides visualizations and statistics for some datasets that can be found online and can be downloaded by general audience. Dataset Ninja is not a dataset hosting platform and can only be used for informational purposes. The platform does not claim any rights for the original content, including images, videos, annotations and descriptions. Joint publishing is prohibited.
You take full responsibility when you use datasets presented at Dataset Ninja, as well as other information, including visualizations and statistics we provide. You are in charge of compliance with any dataset license and all other permissions. You are required to navigate datasets homepage and make sure that you can use it. In case of any questions, get in touch with us at hello@datasetninja.com.