

Introduction #
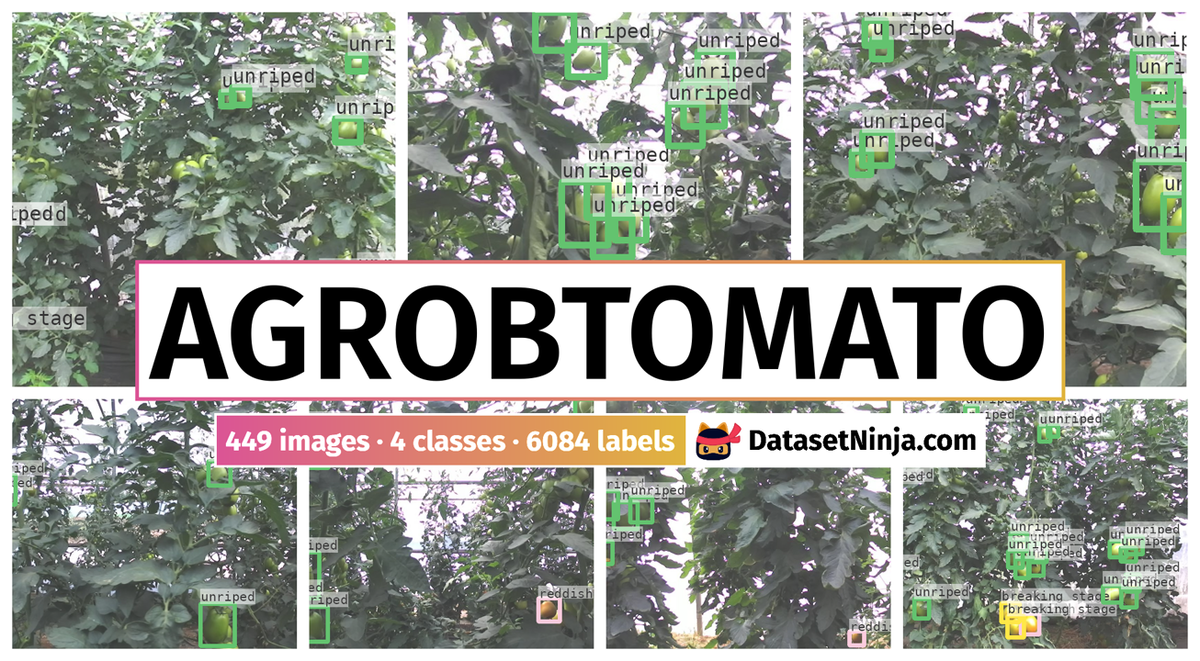
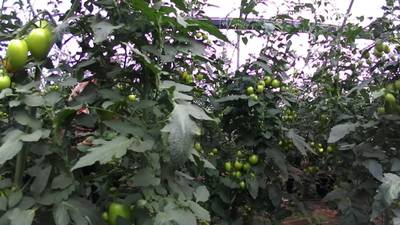
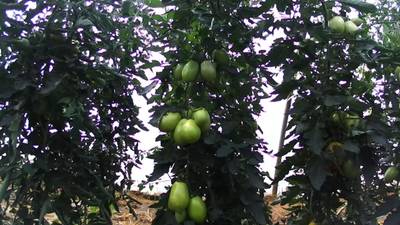
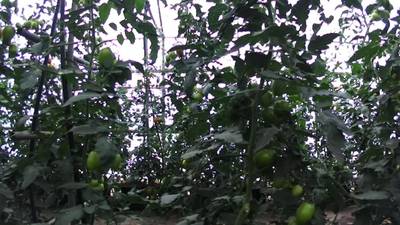
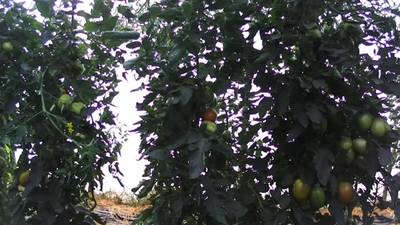
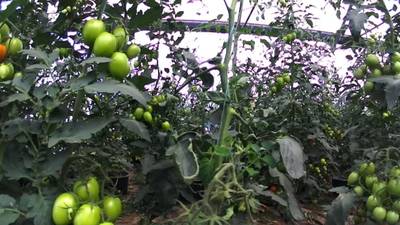
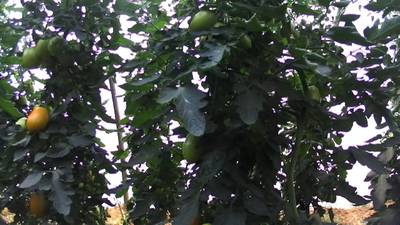
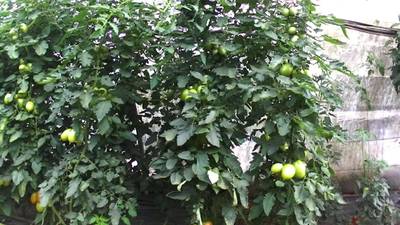
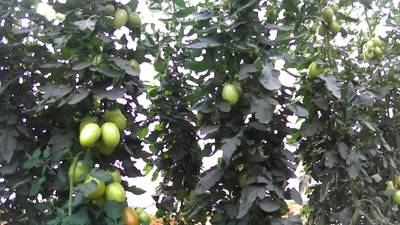
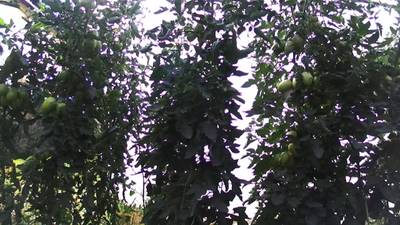
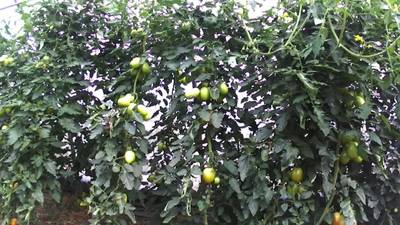
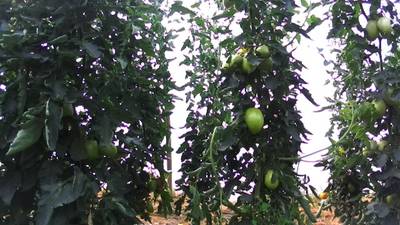
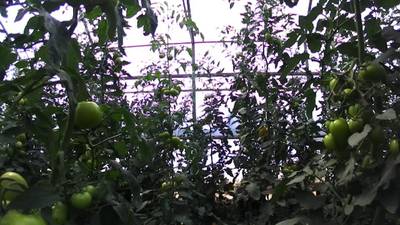
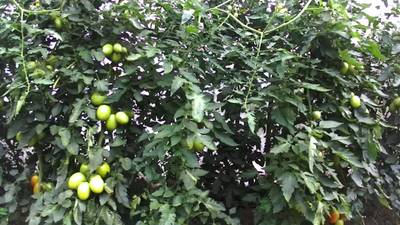
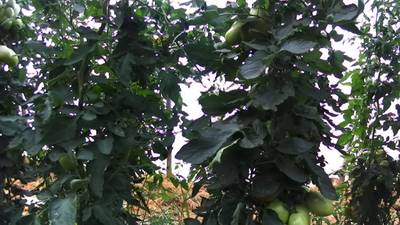
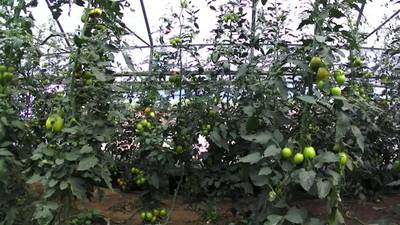
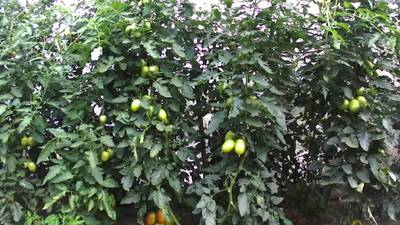
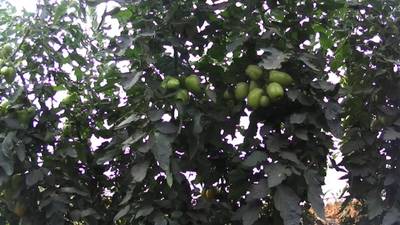
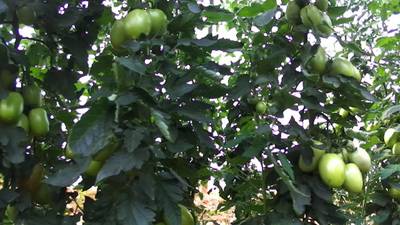
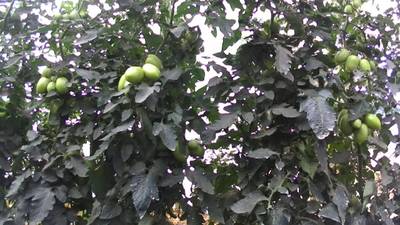
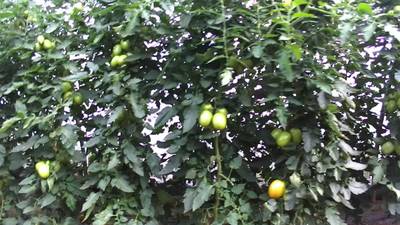
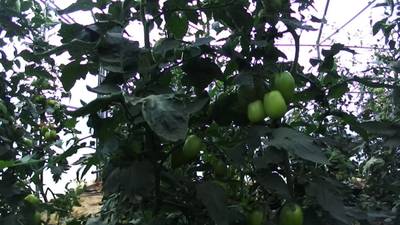
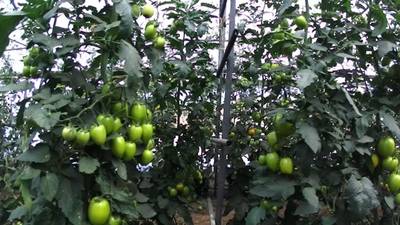
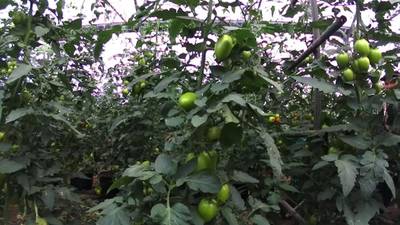
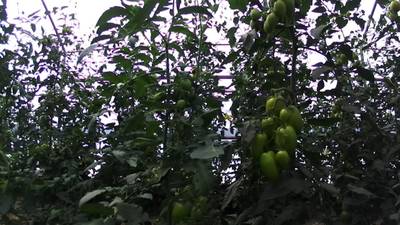
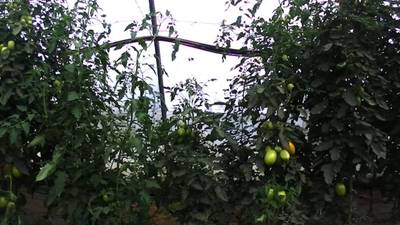
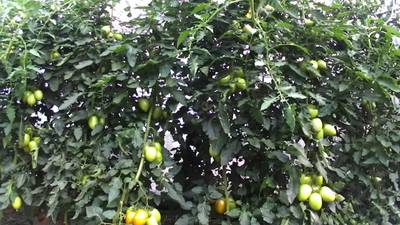
The AgRobTomato Dataset: Greenhouse Tomatoes With Different Ripeness Stages comprises images taken within a greenhouse located in Barroselas, Viana do Castelo, Portugal. The original video content taken by the mobile robot known as AgRob v16 (which was operated by a human operator) was subsequently transformed into individual images. To mitigate the correlation between these images, frames were sampled at 3-second intervals, preserving an overlapping ratio of roughly 60%. The images from the two collection days were consolidated, resulting in a dataset that encompasses a total of 449 images. Each of these images has a resolution of 1280×720 pixels.
This dataset is an outcome of the ROBOCARE project, which is focused on researching and developing intelligent precision robotic platforms tailored for use in protected crop environments. The project’s overarching objective is to reduce the workload associated with agricultural tasks while enhancing the ergonomics of these operations. This will lead to increased labor productivity and improved economic viability for crop cultivation. Notably, the project team is actively engaged in the development of a robot specialized in harvesting tomatoes within a greenhouse setting.
 Homepage
 Research Paper
Summary #
AgRobTomato Dataset: Greenhouse Tomatoes With Different Ripeness Stages is a dataset for an object detection task. It is used in the agricultural industry.
The dataset consists of 449 images with 6084 labeled objects belonging to 4 different classes including unriped, breaking stage, reddish, and other: riped.
Images in the AgRobTomato Dataset dataset have bounding box annotations. There are 14 (3% of the total) unlabeled images (i.e. without annotations). There are no pre-defined train/val/test splits in the dataset. The dataset was released in 2021 by the University of Porto, Portugal and Instituto de Engenharia de Sistemas e Computadores, Tecnologia e Ciência (INESC TEC), Portugal.
Explore #
AgRobTomato Dataset dataset has 449 images. Click on one of the examples below or open "Explore" tool anytime you need to view dataset images with annotations. This tool has extended visualization capabilities like zoom, translation, objects table, custom filters and more. Hover the mouse over the images to hide or show annotations.


Class balance #
There are 4 annotation classes in the dataset. Find the general statistics and balances for every class in the table below. Click any row to preview images that have labels of the selected class. Sort by column to find the most rare or prevalent classes.

Class ㅤ | Images ㅤ | Objects ㅤ | Count on image average | Area on image average |
|---|---|---|---|---|
unriped➔ rectangle | 435 | 5594 | 12.86 | 4.4% |
breaking stage➔ rectangle | 173 | 276 | 1.6 | 0.59% |
reddish➔ rectangle | 116 | 184 | 1.59 | 0.55% |
riped➔ rectangle | 27 | 30 | 1.11 | 0.35% |
Co-occurrence matrix #
Co-occurrence matrix is an extremely valuable tool that shows you the images for every pair of classes: how many images have objects of both classes at the same time. If you click any cell, you will see those images. We added the tooltip with an explanation for every cell for your convenience, just hover the mouse over a cell to preview the description.
Images #
Explore every single image in the dataset with respect to the number of annotations of each class it has. Click a row to preview selected image. Sort by any column to find anomalies and edge cases. Use horizontal scroll if the table has many columns for a large number of classes in the dataset.
Object distribution #
Interactive heatmap chart for every class with object distribution shows how many images are in the dataset with a certain number of objects of a specific class. Users can click cell and see the list of all corresponding images.
Class sizes #
The table below gives various size properties of objects for every class. Click a row to see the image with annotations of the selected class. Sort columns to find classes with the smallest or largest objects or understand the size differences between classes.
Class | Object count | Avg area | Max area | Min area | Min height | Min height | Max height | Max height | Avg height | Avg height | Min width | Min width | Max width | Max width |
|---|---|---|---|---|---|---|---|---|---|---|---|---|---|---|
unriped rectangle | 5594 | 0.39% | 3.08% | 0.03% | 16px | 2.22% | 189px | 26.25% | 60px | 8.4% | 12px | 0.94% | 163px | 12.73% |
breaking Unknown | 276 | 0.37% | 2.43% | 0.11% | 31px | 4.31% | 172px | 23.89% | 61px | 8.42% | 21px | 1.64% | 130px | 10.16% |
reddish rectangle | 184 | 0.35% | 1.56% | 0.1% | 30px | 4.17% | 139px | 19.31% | 59px | 8.14% | 29px | 2.27% | 123px | 9.61% |
riped rectangle | 30 | 0.31% | 1.18% | 0.11% | 32px | 4.44% | 120px | 16.67% | 55px | 7.64% | 31px | 2.42% | 91px | 7.11% |
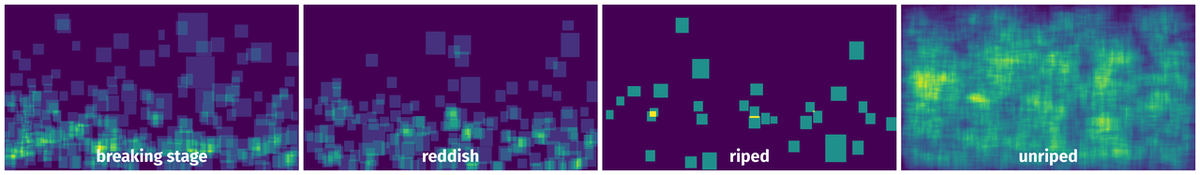
Spatial Heatmap #
The heatmaps below give the spatial distributions of all objects for every class. These visualizations provide insights into the most probable and rare object locations on the image. It helps analyze objects' placements in a dataset.
Objects #
Table contains all 6084 objects. Click a row to preview an image with annotations, and use search or pagination to navigate. Sort columns to find outliers in the dataset.
Object ID ㅤ | Class ㅤ | Image name click row to open | Image size height x width | Height ㅤ | Height ㅤ | Width ㅤ | Width ㅤ | Area ㅤ |
|---|---|---|---|---|---|---|---|---|
1➔ | unriped rectangle | tomate_barroselas_20200806_0011.jpg | 720 x 1280 | 41px | 5.69% | 47px | 3.67% | 0.21% |
2➔ | unriped rectangle | tomate_barroselas_20200806_0011.jpg | 720 x 1280 | 35px | 4.86% | 43px | 3.36% | 0.16% |
3➔ | unriped rectangle | tomate_barroselas_20200806_0011.jpg | 720 x 1280 | 42px | 5.83% | 34px | 2.66% | 0.15% |
4➔ | unriped rectangle | tomate_barroselas_20200806_0011.jpg | 720 x 1280 | 41px | 5.69% | 42px | 3.28% | 0.19% |
5➔ | unriped rectangle | tomate_barroselas_20200806_0011.jpg | 720 x 1280 | 53px | 7.36% | 47px | 3.67% | 0.27% |
6➔ | unriped rectangle | tomate_barroselas_20200806_0011.jpg | 720 x 1280 | 38px | 5.28% | 36px | 2.81% | 0.15% |
7➔ | unriped rectangle | tomate_barroselas_20200806_0011.jpg | 720 x 1280 | 47px | 6.53% | 43px | 3.36% | 0.22% |
8➔ | breaking Unknown | tomate_barroselas_20200806_0011.jpg | 720 x 1280 | 63px | 8.75% | 43px | 3.36% | 0.29% |
9➔ | riped rectangle | tomate_barroselas_20200806_0229.jpg | 720 x 1280 | 50px | 6.94% | 38px | 2.97% | 0.21% |
10➔ | unriped rectangle | tomate_barroselas_20200806_0229.jpg | 720 x 1280 | 75px | 10.42% | 62px | 4.84% | 0.5% |
License #
Citation #
If you make use of the AgRobTomato data, please cite the following reference:
@dataset{magalhaes_sandro_augusto_2021_5596799,
  author       = {Magalhães, Sandro Augusto and
                  Moreira, Germano and
                  dos Santos, Filipe Neves and
                  Cunha, Mário},
  title        = {{AgRobTomato Dataset: Greenhouse tomatoes with
                   different ripeness stages}},
  month        = oct,
  year         = 2021,
  publisher    = {Zenodo},
  doi          = {10.5281/zenodo.5596799},
  url          = {https://doi.org/10.5281/zenodo.5596799}
}
If you are happy with Dataset Ninja and use provided visualizations and tools in your work, please cite us:
@misc{ visualization-tools-for-ag-rob-tomato-dataset,
  title = { Visualization Tools for AgRobTomato Dataset Dataset },
  type = { Computer Vision Tools },
  author = { Dataset Ninja },
  howpublished = { \url{ https://datasetninja.com/ag-rob-tomato } },
  url = { https://datasetninja.com/ag-rob-tomato },
  journal = { Dataset Ninja },
  publisher = { Dataset Ninja },
  year = { 2026 },
  month = { jul },
  note = { visited on 2026-07-20 },
}
Download #
Dataset AgRobTomato Dataset can be downloaded in Supervisely format:
As an alternative, it can be downloaded with dataset-tools package:
pip install --upgrade dataset-tools
… using following python code:
import dataset_tools as dtools

dtools.download(dataset='AgRobTomato Dataset', dst_dir='~/dataset-ninja/')
Make sure not to overlook the python code example available on the Supervisely Developer Portal. It will give you a clear idea of how to effortlessly work with the downloaded dataset.
The data in original format can be downloaded here.
Disclaimer #
Our gal from the legal dep told us we need to post this:
Dataset Ninja provides visualizations and statistics for some datasets that can be found online and can be downloaded by general audience. Dataset Ninja is not a dataset hosting platform and can only be used for informational purposes. The platform does not claim any rights for the original content, including images, videos, annotations and descriptions. Joint publishing is prohibited.
You take full responsibility when you use datasets presented at Dataset Ninja, as well as other information, including visualizations and statistics we provide. You are in charge of compliance with any dataset license and all other permissions. You are required to navigate datasets homepage and make sure that you can use it. In case of any questions, get in touch with us at hello@datasetninja.com.