Introduction #
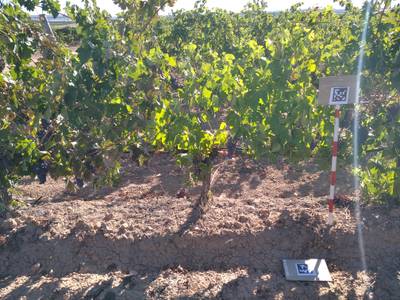
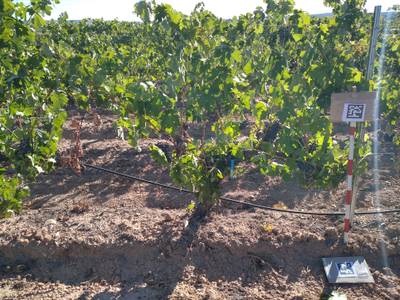
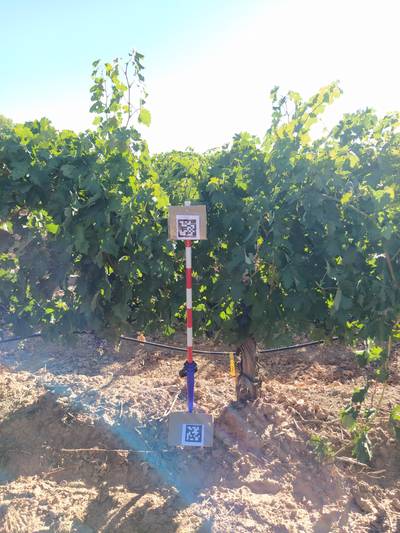
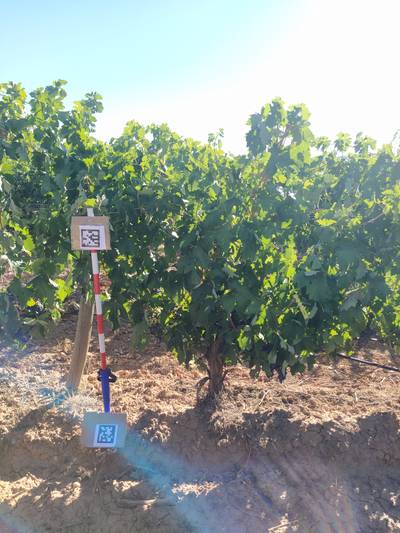
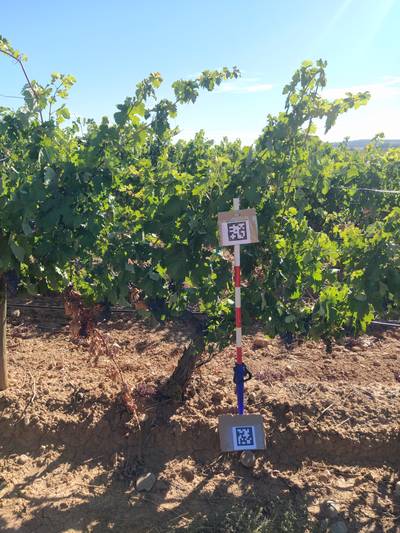
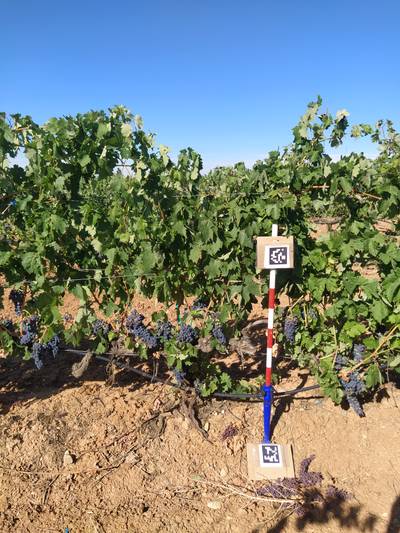
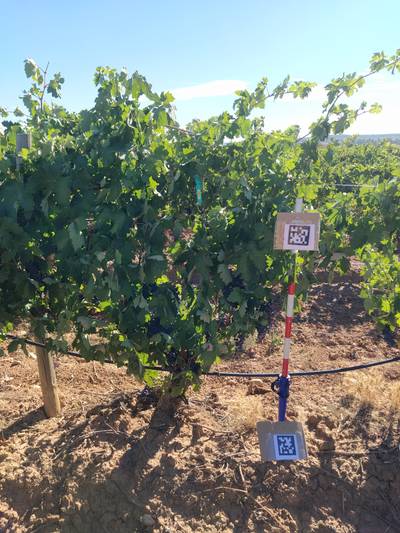
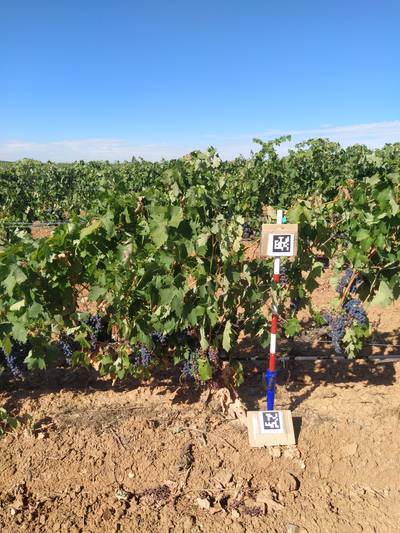
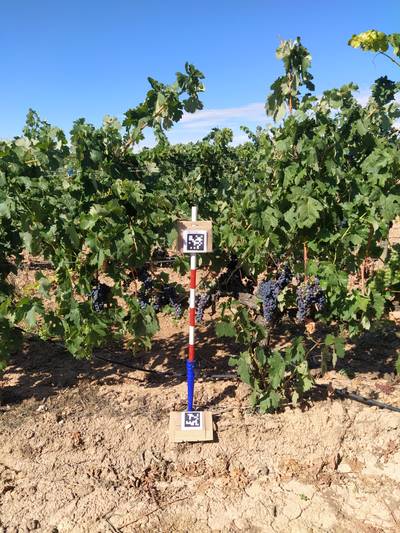
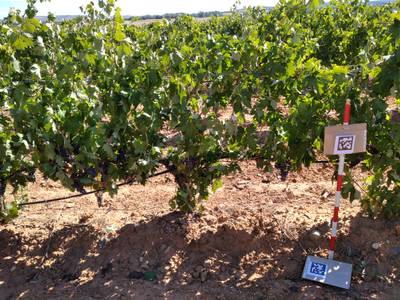
The AI4Agriculture Grape Dataset consists of 250 images captured within a vineyard located in Ribera de Duero, featuring grapevines of the Tempranillo variety. These images are annotated using bounding boxes. The primary objective of this dataset is to offer both images and corresponding annotations to facilitate the training and validation of object detection models. These models can find practical application in viticulture, enabling tasks such as yield estimation, fruit counting, and field robotics.
The image collection contains twelve distinct parcels, with each parcel further divided into six defined areas. Within each area, multiple rows of grapevines are present. To ensure variety and coverage, four picture samples are taken for each row of grapevines, with two samples from each side. Importantly, these samples are selected from non-contiguous grapevines, ensuring that the images do not overlap.
Data Acquisition
The authors have focused on applying AI-based techniques in agriculture, utilizing the platform developed within the project. The AI4Agriculture pilot, situated in the Ribera del Duero wine region in Spain, has three main objectives: estimating grape quantities in vineyards, evaluating the final product’s quality, and predicting yields. To achieve these objectives, diverse data sources, including drones, mobile cameras, and satellite imagery, are being collected. The system includes a component that processes mobile camera images to identify grapes and estimate their quantities using Deep Learning techniques. Due to the time-intensive nature of labeling, a multi-actor approach has been adopted to expedite the process, although this approach may introduce subjective bias due to the various perspectives involved.
To accommodate the multi-labeler approach, the authors conducted an introductory training session to gauge the average time required for labeling a single image and to address challenges inherent to image characteristics. Six labelers were tasked with annotating 45 images, identifying all grape clusters within each image. For each image, a .xml file was generated following the PascalVOC format, documenting all labeled items.
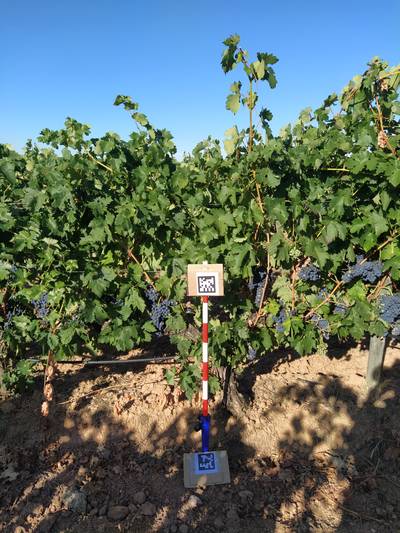
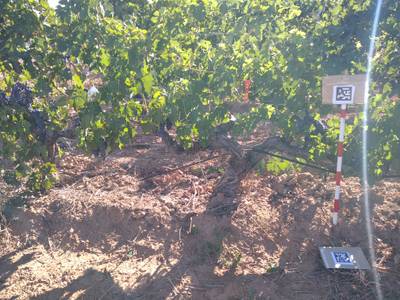
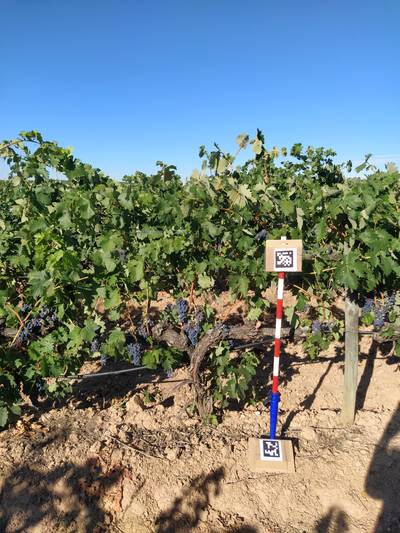
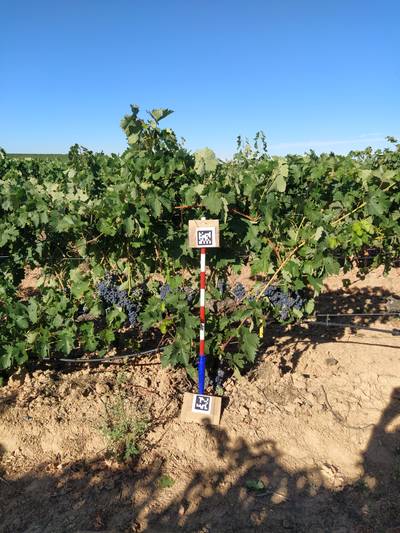
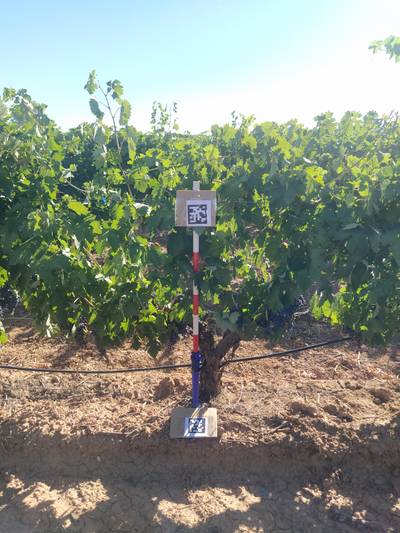
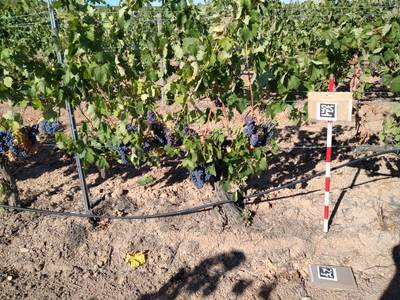
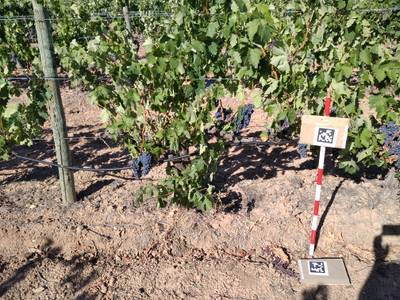
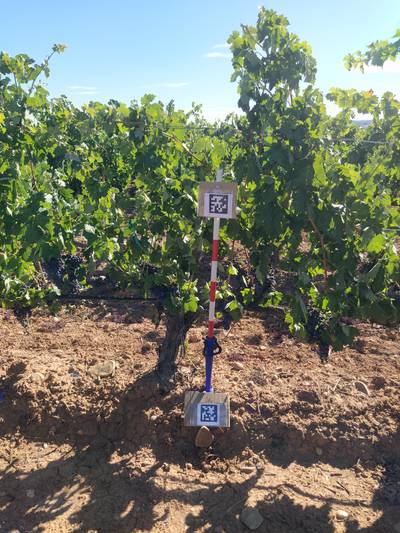
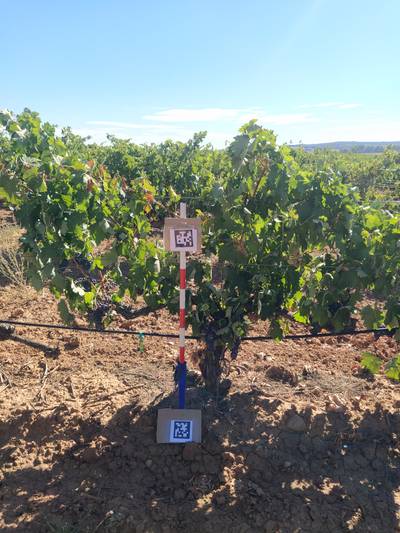
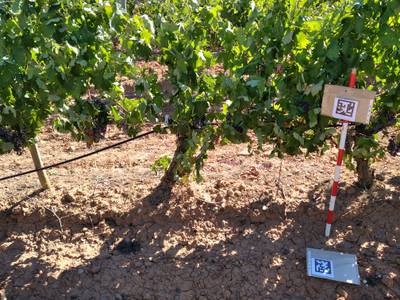
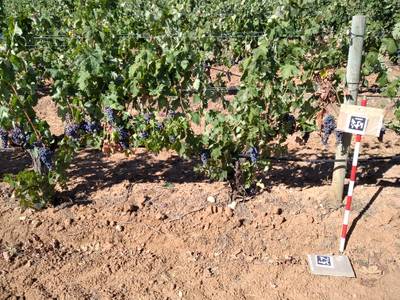
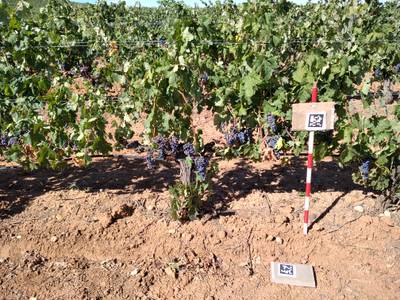
Initially, specific study areas were defined within two different vineyards, spanning multiple rows of grapevines. These areas were chosen considering the pixel dimensions captured by Sentinel satellites (typically 20x20 square meters per pixel) to enable future assessment of plant vigor using satellite images. A total of 403 plants were photographed using a mobile app: 363 from both sides and 40 from a single side. Each side’s capture involved three different pictures, taken from the left angle, right angle, and frontal perspective, resulting in a total of 2,298 images. The photos were taken using Xiaomi Redmi 8 (4032x3024 resolution), Xiaomi Mi A3 (3000x4000 resolution), and Xiaomi Redmi 9 (3264x2448 resolution) smartphones.
Image Labeling
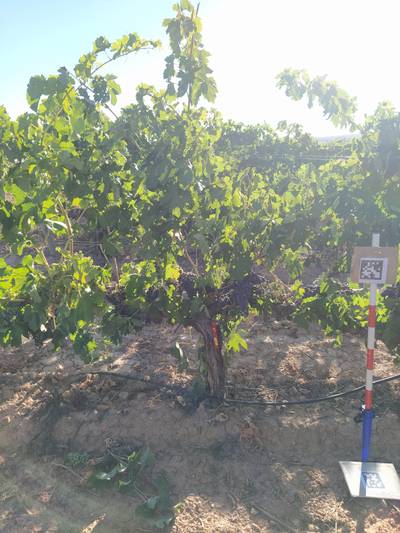
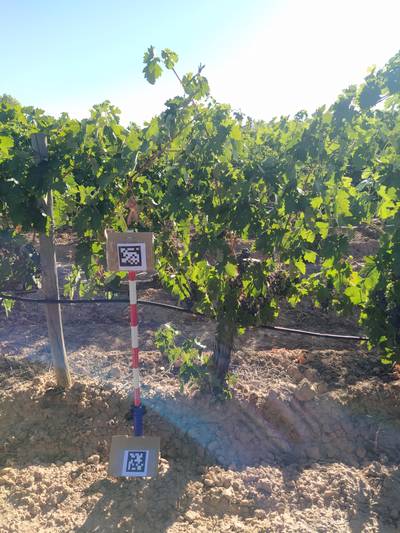
However, certain images presented challenges during the labeling process, including issues such as reflections caused by sunlight, clusters of grapes partially concealed by leaves, obstruction by other objects like irrigation pipes, similarity in color and direction to tree trunks, presence of dead grapes on the ground, and grapes from the plants located behind the analyzed plant. Considering the labeling times determined during the introductory training session, a subset of 459 images (from the original 2,298) was selected, specifically those captured from the frontal perspective while excluding images taken from the left and right angles. This selection aimed to eliminate redundant images of the same side of each plant and images with angles revealing the plants and grapes situated behind the plant under analysis. The subsequent labeling session was organized for eight labelers.
Summary #
AI4Agriculture Grape Dataset is a dataset for an object detection task. It is used in the agricultural industry.
The dataset consists of 250 images with 5076 labeled objects belonging to 1 single class (grapes).
Images in the AI4Agriculture Grape Dataset dataset have bounding box annotations. There are 5 (2% of the total) unlabeled images (i.e. without annotations). There is 1 split in the dataset: ai4agriculture_2020 (250 images). The dataset was released in 2021 by the Universitat Politècnica de Catalunya, Spain, ATOS, France, SmartRural, UK, German Aerospace Center, and National & Kapodistrian University of Athens.

Explore #
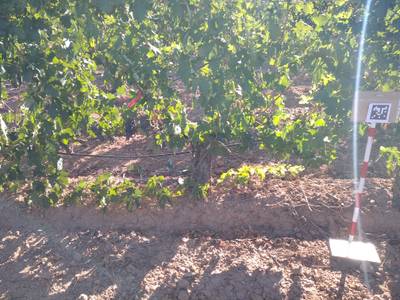
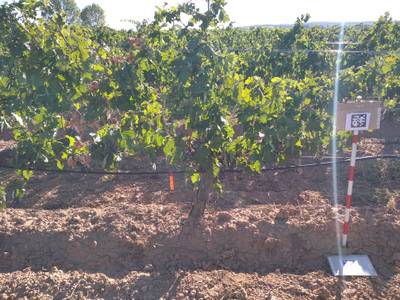
AI4Agriculture Grape Dataset dataset has 250 images. Click on one of the examples below or open "Explore" tool anytime you need to view dataset images with annotations. This tool has extended visualization capabilities like zoom, translation, objects table, custom filters and more. Hover the mouse over the images to hide or show annotations.






























Class balance #
There are 1 annotation classes in the dataset. Find the general statistics and balances for every class in the table below. Click any row to preview images that have labels of the selected class. Sort by column to find the most rare or prevalent classes.
Class ㅤ | Images ㅤ | Objects ㅤ | Count on image average | Area on image average |
|---|---|---|---|---|
grapes➔ rectangle | 245 | 5076 | 20.72 | 3.05% |
Images #
Explore every single image in the dataset with respect to the number of annotations of each class it has. Click a row to preview selected image. Sort by any column to find anomalies and edge cases. Use horizontal scroll if the table has many columns for a large number of classes in the dataset.
Object distribution #
Interactive heatmap chart for every class with object distribution shows how many images are in the dataset with a certain number of objects of a specific class. Users can click cell and see the list of all corresponding images.
Class sizes #
The table below gives various size properties of objects for every class. Click a row to see the image with annotations of the selected class. Sort columns to find classes with the smallest or largest objects or understand the size differences between classes.
Class | Object count | Avg area | Max area | Min area | Min height | Min height | Max height | Max height | Avg height | Avg height | Min width | Min width | Max width | Max width |
|---|---|---|---|---|---|---|---|---|---|---|---|---|---|---|
grapes rectangle | 5076 | 0.15% | 1.8% | 0% | 11px | 0.35% | 499px | 20.14% | 132px | 4.59% | 10px | 0.25% | 448px | 11.53% |
Spatial Heatmap #
The heatmaps below give the spatial distributions of all objects for every class. These visualizations provide insights into the most probable and rare object locations on the image. It helps analyze objects' placements in a dataset.

Objects #
Table contains all 5076 objects. Click a row to preview an image with annotations, and use search or pagination to navigate. Sort columns to find outliers in the dataset.
Object ID ㅤ | Class ㅤ | Image name click row to open | Image size height x width | Height ㅤ | Height ㅤ | Width ㅤ | Width ㅤ | Area ㅤ |
|---|---|---|---|---|---|---|---|---|
1➔ | grapes rectangle | 1601980429759.jpg | 3000 x 4000 | 331px | 11.03% | 258px | 6.45% | 0.71% |
2➔ | grapes rectangle | 1601980429759.jpg | 3000 x 4000 | 241px | 8.03% | 66px | 1.65% | 0.13% |
3➔ | grapes rectangle | 1601980429759.jpg | 3000 x 4000 | 49px | 1.63% | 49px | 1.23% | 0.02% |
4➔ | grapes rectangle | 1601980429759.jpg | 3000 x 4000 | 129px | 4.3% | 187px | 4.67% | 0.2% |
5➔ | grapes rectangle | 1601980429759.jpg | 3000 x 4000 | 68px | 2.27% | 62px | 1.55% | 0.04% |
6➔ | grapes rectangle | 1601980429759.jpg | 3000 x 4000 | 107px | 3.57% | 91px | 2.27% | 0.08% |
7➔ | grapes rectangle | 1601980429759.jpg | 3000 x 4000 | 140px | 4.67% | 57px | 1.43% | 0.07% |
8➔ | grapes rectangle | 1601980429759.jpg | 3000 x 4000 | 183px | 6.1% | 85px | 2.12% | 0.13% |
9➔ | grapes rectangle | 1601980429759.jpg | 3000 x 4000 | 64px | 2.13% | 128px | 3.2% | 0.07% |
10➔ | grapes rectangle | 1601980429759.jpg | 3000 x 4000 | 76px | 2.53% | 152px | 3.8% | 0.1% |
License #
AI4Agriculture Grape Dataset is under Apache 2.0 license.
Citation #
If you make use of the AI4Agriculture Grape Dataset data, please cite the following reference:
@dataset{josep_ramon_morros_2021_5660081,
  author       = {Josep Ramon Morros,
                  Tomas Pariente Lobo,
                  Sergio Salmeron-Majadas,
                  Javier Villazan,
                  Diego Merino,
                  Ana Antunes,
                  Mihai Datcu,
                  Chandrabali Karmakar,
                  Edmundo Guerra,
                  Despina-Athanasia Pantazi,
                  George Stamoulis
                  },
  title        = {AI4Agriculture Grape Dataset},
  month        = nov,
  year         = 2021,
  publisher    = {Zenodo},
  version      = {1.0.0},
  doi          = {10.5281/zenodo.5660081},
  url          = {https://doi.org/10.5281/zenodo.5660081}
}
If you are happy with Dataset Ninja and use provided visualizations and tools in your work, please cite us:
@misc{ visualization-tools-for-ai4agriculture-grape-dataset-dataset,
  title = { Visualization Tools for AI4Agriculture Grape Dataset Dataset },
  type = { Computer Vision Tools },
  author = { Dataset Ninja },
  howpublished = { \url{ https://datasetninja.com/ai4agriculture-grape-dataset } },
  url = { https://datasetninja.com/ai4agriculture-grape-dataset },
  journal = { Dataset Ninja },
  publisher = { Dataset Ninja },
  year = { 2026 },
  month = { feb },
  note = { visited on 2026-02-08 },
}
Download #
Dataset AI4Agriculture Grape Dataset can be downloaded in Supervisely format:
As an alternative, it can be downloaded with dataset-tools package:
pip install --upgrade dataset-tools
… using following python code:
import dataset_tools as dtools

dtools.download(dataset='AI4Agriculture Grape Dataset', dst_dir='~/dataset-ninja/')
Make sure not to overlook the python code example available on the Supervisely Developer Portal. It will give you a clear idea of how to effortlessly work with the downloaded dataset.
The data in original format can be downloaded here:
Disclaimer #
Our gal from the legal dep told us we need to post this:
Dataset Ninja provides visualizations and statistics for some datasets that can be found online and can be downloaded by general audience. Dataset Ninja is not a dataset hosting platform and can only be used for informational purposes. The platform does not claim any rights for the original content, including images, videos, annotations and descriptions. Joint publishing is prohibited.
You take full responsibility when you use datasets presented at Dataset Ninja, as well as other information, including visualizations and statistics we provide. You are in charge of compliance with any dataset license and all other permissions. You are required to navigate datasets homepage and make sure that you can use it. In case of any questions, get in touch with us at hello@datasetninja.com.


