
Introduction #
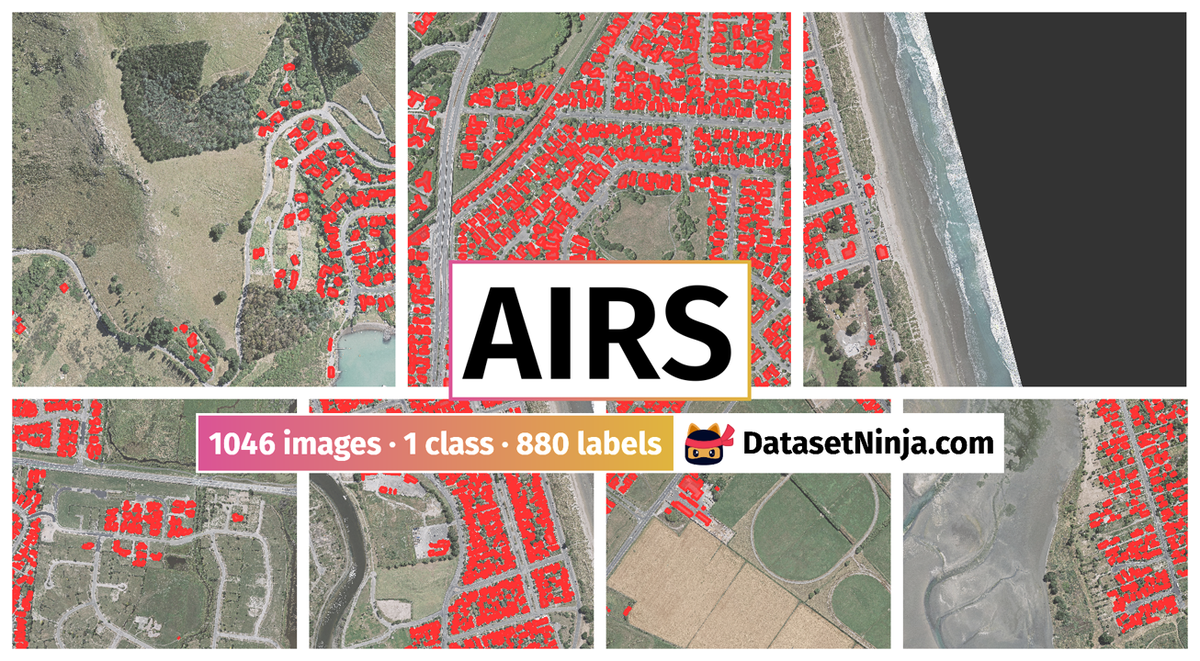
Authors present a new large-scale benchmark dataset termed AIRS: Aerial Imagery for Roof Segmentation. This dataset provides a wide coverage of aerial imagery with 7.5 cm resolution and contains over 220,000 buildings. The task posed for AIRS is defined as roof segmentation. All the aerial images within the AOI are first merged into a single mosaic and then tiled into smaller images for better handling. The tiled images feature a size of 10000 × 10000 pixels, with a 10% overlap between adjacent tiles. As a result, the whole region is tiled into 1047 images.
To facilitate research, authors split the dataset by randomly assigning the images to the following three subsets:
- train set. This set contains 857 images and the corresponding roof labels for training.
- val set. This set contains 94 images and the corresponding roof labels for validation.
- test set. This set contains 96 images for benchmark testing. Currently, for fair comparison, the corresponding roof labels are not disclosed. They will be used for evaluating the results submitted to the public challenge centered on the AIRS dataset.

Geographical distribution of images in a) train set, b) val set, and c) test set of AIRS dataset.

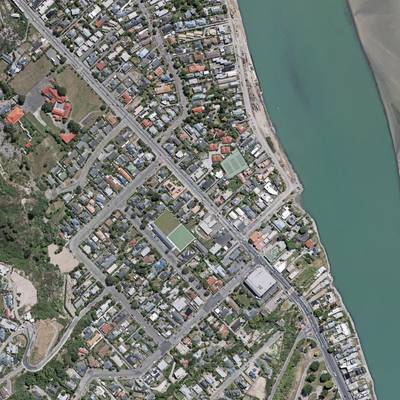
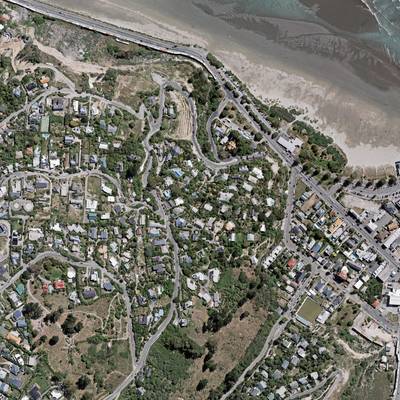
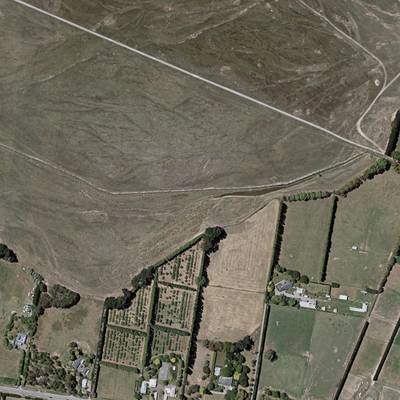
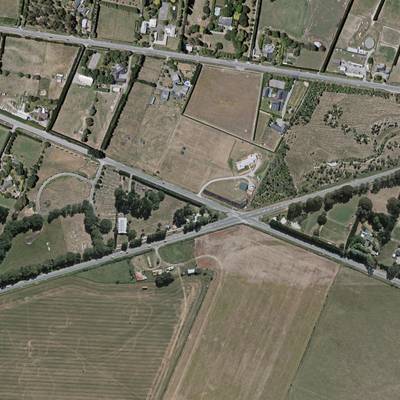
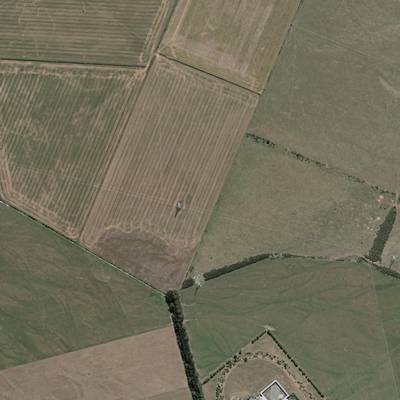
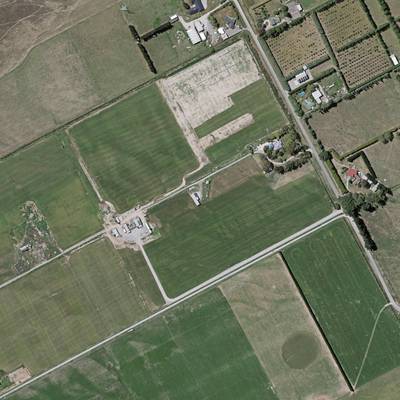
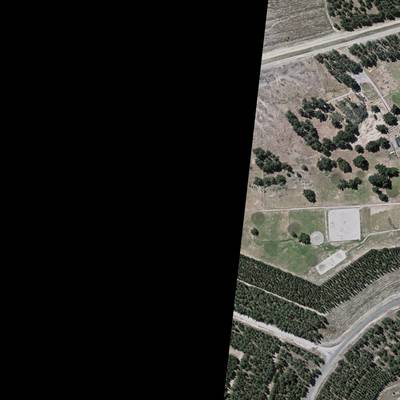
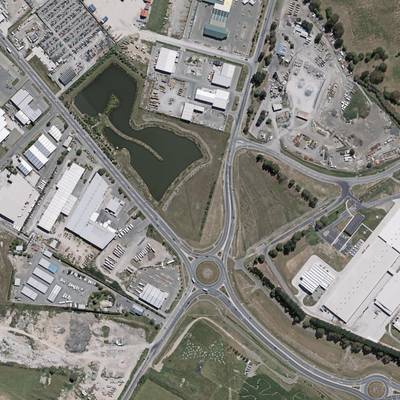
This figure displays the study area of the AIRS dataset. The area of interest (AOI) covers about 457 km², including almost the full area of Christchurch, the largest city in the South Island of New Zealand. The aerial imagery and the corresponding building map are open-source data provided by LINZ Data Service. The photographs were captured during the flying seasons of 2015 and 2016, and the open-source images were ortho-rectified DOMs with RGB channels and 7.5 cm resolution in the projection of the New Zealand Transverse Mercator. The building footprints, which are stored as 2D polygons in a shapefile, were produced in June 2016 by manual annotation.
 Homepage
 Research Paper
Summary #
AIRS: Aerial Imagery for Roof Segmentation is a dataset for a semantic segmentation task. It is used in the urban planning industry. Possible applications of the dataset could be in the environmental industry.
The dataset consists of 1046 images with 880 labeled objects belonging to 1 single class (roof).
Images in the AIRS dataset have pixel-level semantic segmentation annotations. There are 166 (16% of the total) unlabeled images (i.e. without annotations). There are 3 splits in the dataset: train (857 images), test (95 images), and val (94 images). The dataset was released in 2018 by the China University of Geosciences (Wuhan), University of Waterloo, University of Tokyo, and AtlasAI Inc.
Explore #
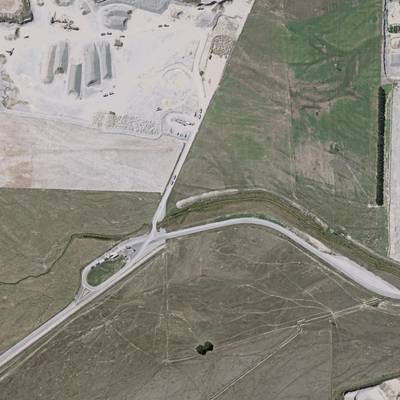
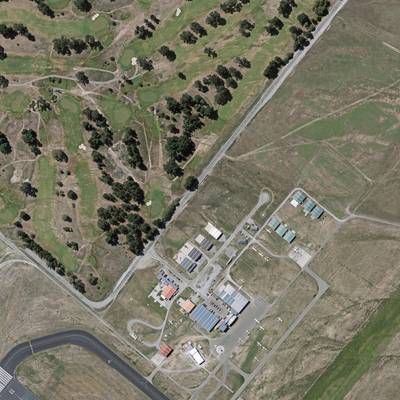
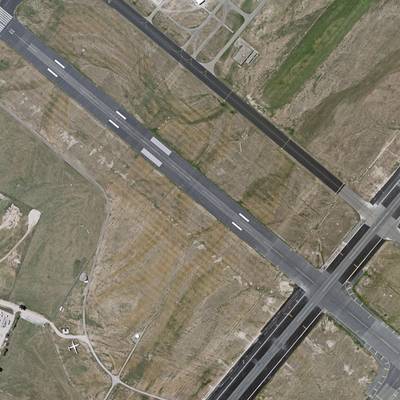
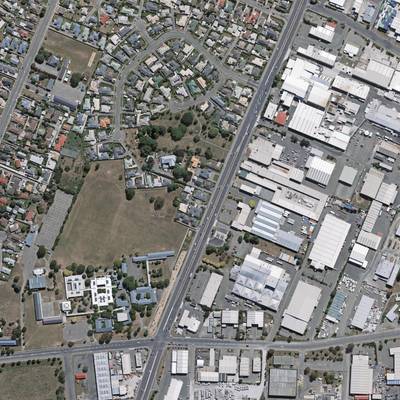
AIRS dataset has 1046 images. Click on one of the examples below or open "Explore" tool anytime you need to view dataset images with annotations. This tool has extended visualization capabilities like zoom, translation, objects table, custom filters and more. Hover the mouse over the images to hide or show annotations.


Class balance #
There are 1 annotation classes in the dataset. Find the general statistics and balances for every class in the table below. Click any row to preview images that have labels of the selected class. Sort by column to find the most rare or prevalent classes.

Class ㅤ | Images ㅤ | Objects ㅤ | Count on image average | Area on image average |
|---|---|---|---|---|
roof➔ mask | 880 | 880 | 1 | 9.02% |
Images #
Explore every single image in the dataset with respect to the number of annotations of each class it has. Click a row to preview selected image. Sort by any column to find anomalies and edge cases. Use horizontal scroll if the table has many columns for a large number of classes in the dataset.
Object distribution #
Interactive heatmap chart for every class with object distribution shows how many images are in the dataset with a certain number of objects of a specific class. Users can click cell and see the list of all corresponding images.
Class sizes #
The table below gives various size properties of objects for every class. Click a row to see the image with annotations of the selected class. Sort columns to find classes with the smallest or largest objects or understand the size differences between classes.
Class | Object count | Avg area | Max area | Min area | Min height | Min height | Max height | Max height | Avg height | Avg height | Min width | Min width | Max width | Max width |
|---|---|---|---|---|---|---|---|---|---|---|---|---|---|---|
roof mask | 880 | 9.02% | 35.66% | 0% | 14px | 0.14% | 10000px | 100% | 8037px | 80.56% | 37px | 0.37% | 10000px | 100% |
Spatial Heatmap #
The heatmaps below give the spatial distributions of all objects for every class. These visualizations provide insights into the most probable and rare object locations on the image. It helps analyze objects' placements in a dataset.
Objects #
Table contains all 880 objects. Click a row to preview an image with annotations, and use search or pagination to navigate. Sort columns to find outliers in the dataset.
Object ID ㅤ | Class ㅤ | Image name click row to open | Image size height x width | Height ㅤ | Height ㅤ | Width ㅤ | Width ㅤ | Area ㅤ |
|---|---|---|---|---|---|---|---|---|
1➔ | roof mask | christchurch_487.tif.tiff | 10000 x 10000 | 10000px | 100% | 10000px | 100% | 22.68% |
2➔ | roof mask | christchurch_528.tif.tiff | 10000 x 10000 | 3556px | 35.56% | 3553px | 35.53% | 0.22% |
3➔ | roof mask | christchurch_636.tif.tiff | 10000 x 10000 | 9099px | 90.99% | 8062px | 80.62% | 1.09% |
4➔ | roof mask | christchurch_688.tif.tiff | 10000 x 10000 | 10000px | 100% | 10000px | 100% | 15.52% |
5➔ | roof mask | christchurch_15.tif.tiff | 10000 x 10000 | 2264px | 22.64% | 1302px | 13.02% | 0.05% |
6➔ | roof mask | christchurch_403.tif.tiff | 10000 x 10000 | 7970px | 79.7% | 9903px | 99.03% | 2.88% |
7➔ | roof mask | christchurch_227.tif.tiff | 10000 x 10000 | 6222px | 62.22% | 4172px | 41.72% | 1.66% |
8➔ | roof mask | christchurch_848.tif.tiff | 10000 x 10000 | 9251px | 92.51% | 5172px | 51.72% | 0.32% |
9➔ | roof mask | christchurch_110.tif.tiff | 10000 x 10000 | 7016px | 70.16% | 9989px | 99.89% | 1.81% |
10➔ | roof mask | christchurch_492.tif.tiff | 10000 x 10000 | 10000px | 100% | 10000px | 100% | 16.64% |
License #
License is unknown for the AIRS: Aerial Imagery for Roof Segmentation dataset.
Citation #
If you make use of the AIRS data, please cite the following reference:
@article{CHEN201942,
  title = {TEMPORARY REMOVAL: Aerial imagery for roof segmentation: A large-scale dataset towards automatic mapping of buildings},
  journal = {ISPRS Journal of Photogrammetry and Remote Sensing},
  volume = {147},
  pages = {42-55},
  year = {2019},
  issn = {0924-2716},
  doi = {https://doi.org/10.1016/j.isprsjprs.2018.11.011},
  url = {https://www.sciencedirect.com/science/article/pii/S0924271618303083},
  author = {Qi Chen and Lei Wang and Yifan Wu and Guangming Wu and Zhiling Guo and Steven L. Waslander}
}
If you are happy with Dataset Ninja and use provided visualizations and tools in your work, please cite us:
@misc{ visualization-tools-for-airs-dataset,
  title = { Visualization Tools for AIRS Dataset },
  type = { Computer Vision Tools },
  author = { Dataset Ninja },
  howpublished = { \url{ https://datasetninja.com/airs } },
  url = { https://datasetninja.com/airs },
  journal = { Dataset Ninja },
  publisher = { Dataset Ninja },
  year = { 2026 },
  month = { jul },
  note = { visited on 2026-07-16 },
}
Download #
Please visit dataset homepage to download the data.
Disclaimer #
Our gal from the legal dep told us we need to post this:
Dataset Ninja provides visualizations and statistics for some datasets that can be found online and can be downloaded by general audience. Dataset Ninja is not a dataset hosting platform and can only be used for informational purposes. The platform does not claim any rights for the original content, including images, videos, annotations and descriptions. Joint publishing is prohibited.
You take full responsibility when you use datasets presented at Dataset Ninja, as well as other information, including visualizations and statistics we provide. You are in charge of compliance with any dataset license and all other permissions. You are required to navigate datasets homepage and make sure that you can use it. In case of any questions, get in touch with us at hello@datasetninja.com.