

Introduction #
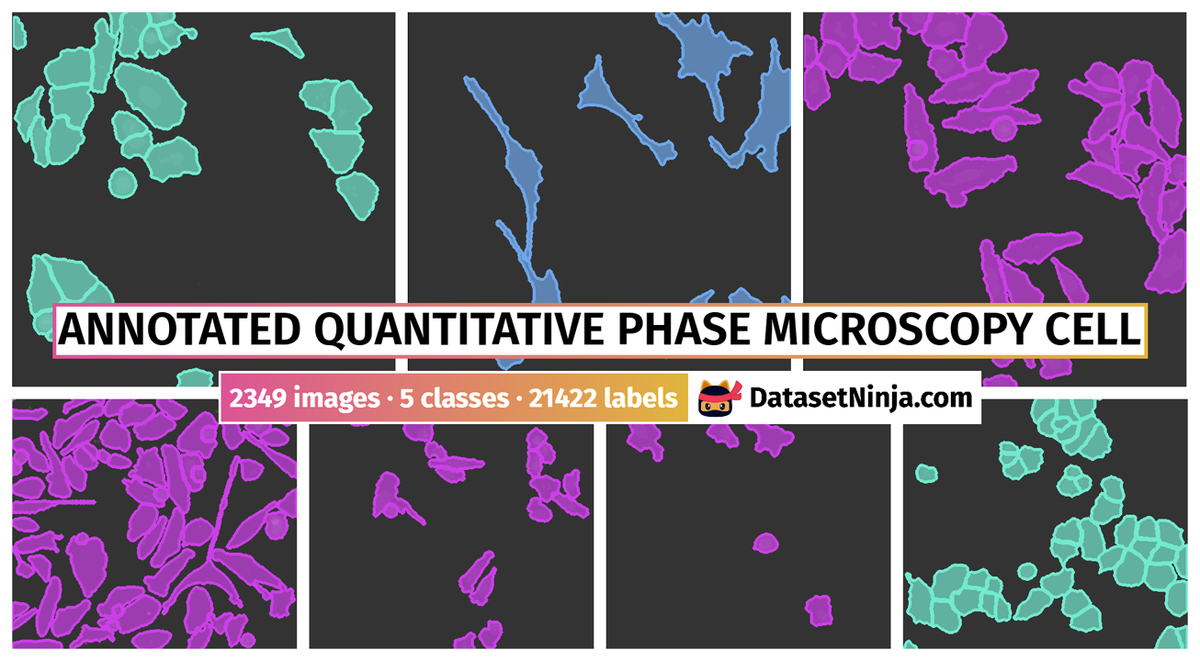
The Annotated Quantitative Phase Microscopy Cell Dataset of Various Adherent Cell Lines for Segmentation Purposes comprising manually labelled images suitable for the task of robust adherent cell segmentation for quantitative phase microscopy images. Alongside this labeled dataset, they provided unlabelled data for self-supervised pretraining, contributing to the broader research community. In the authors’ paper, a novel U-Net-based method was designed and optimized. They meticulously crafted and assessed four specific post-processing pipelines. To enhance the method’s applicability to diverse cell types, the authors employed non-deep learning transfer with adjustable parameters in the post-processing phase.
Quantitative phase imaging (QPI) stands as a potent tool for label-free live cell microscopy, offering images with exceptional properties for automated image processing. The authors noted that various QPI techniques have evolved over time, enabling the time-lapse observation of subtle changes in quantitative phase dynamics within cells. These dynamic changes in cell properties, as measured by QPI, have been shown to be indicative of specific cell behaviors and find applications in diverse areas such as cell motility assessment, analysis of cell content homogeneity, and evaluation of cell mass distribution. Notably, these phase-related changes can be observed without the need for cell fixation, labeling, or harvesting, preserving the inherent characteristics of the cells under study.
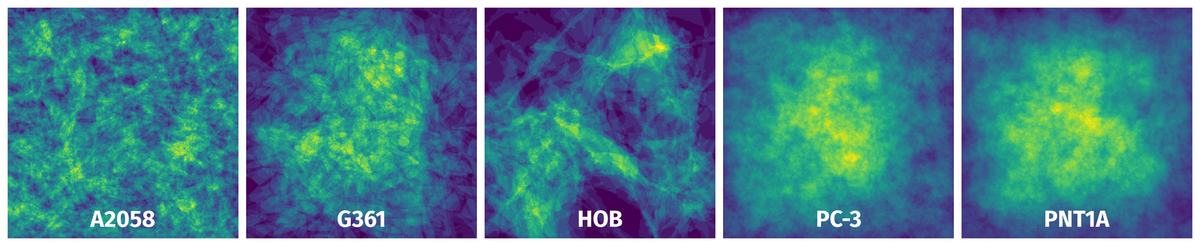
The authors utilized a diverse set of adherent cell lines for their research, encompassing various origins, tumorigenic potential, and morphologies, including PC-3, PNT1A, 22Rv1, DU145, LNCaP, A2058, A2780, Fadu, G361, and HOB. These cell lines were cultured in specific media and conditions tailored to their requirements, and the authors maintained them under controlled environmental conditions for microscopy acquisition. The QPI data was acquired using a coherence-controlled holographic microscope, with images taken at different time intervals to capture cells at varying stages of morphological changes. Please note, that cells 22Rv1, A2058, A2780, DU145, Fadu, G361, HOB and LNCaP are in the unlabelled part of the dataset
PC-3, PNT1A, 22Rv1, DU145, LNCaP, A2780, and G361 cell lines were cultured in RPMI-1640 medium, A2058, FaDu, and HOB cell lines were cultured in DMEM-F12 medium, all supplemented with antibiotics (penicillin 100 U/ml and streptomycin 0.1 mg/ml), and with 10% fetal bovine serum (FBS). Prior to microscopy acquisition, the cells were maintained at 37°C in a humidified (60%) incubator with 5% CO² (Sanyo, Japan). For acquisition purposes, the cells were cultivated in the Flow chamber µ-Slide I Luer Family (Ibidi, Martinsried, Germany). To maintain standard cultivation conditions during time-lapse experiments, cells were placed in the gas chamber H201 - for Mad City Labs Z100/Z500 piezo Z-stage (Okolab, Ottaviano NA, Italy). For the acquisition of QPI, a coherence-controlled holographic microscope (Telight, Q-Phase) was used. Objective Nikon Plan 10×/0.3 was used for hologram acquisition with a CCD camera (XIMEA MR4021MC). Holographic data were numerically reconstructed with the Fourier transform method. QPI datasets used in this paper were acquired during various experimental setups and treatments. In most cases, experiments were conducted with the time-lapse acquisition. The final dataset contains images acquired at least three hours apart.
 Homepage
 Research Paper
 GitHub
Summary #
Annotated Quantitative Phase Microscopy Cell Dataset of Various Adherent Cell Lines for Segmentation Purposes is a dataset for instance segmentation, semantic segmentation, object detection, and self supervised learning tasks. It is used in the biomedical research.
The dataset consists of 2349 images with 21422 labeled objects belonging to 5 different classes including PC-3, PNT1A, HOB, and other: A2058 and G361.
Images in the Annotated Quantitative Phase Microscopy Cell dataset have pixel-level instance segmentation annotations. Due to the nature of the instance segmentation task, it can be automatically transformed into a semantic segmentation (only one mask for every class) or object detection (bounding boxes for every object) tasks. There are 1819 (77% of the total) unlabeled images (i.e. without annotations). There are 2 splits in the dataset: unlabelled (1819 images) and labelled (530 images). The dataset was released in 2021 by the Brno University of Technology, Czech Republic and Masaryk University, Czech Republic.
Explore #
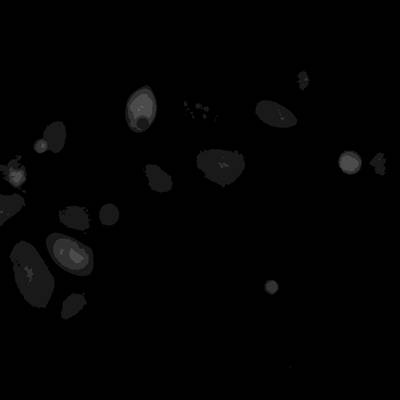
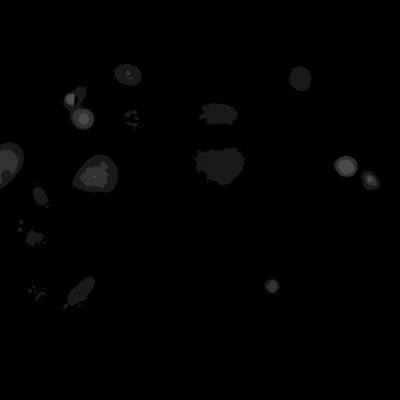
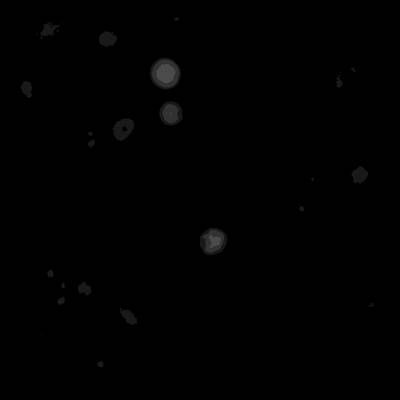
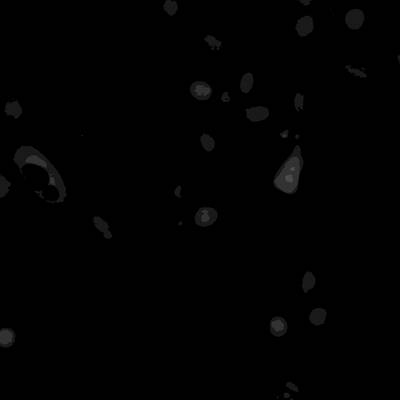
Annotated Quantitative Phase Microscopy Cell dataset has 2349 images. Click on one of the examples below or open "Explore" tool anytime you need to view dataset images with annotations. This tool has extended visualization capabilities like zoom, translation, objects table, custom filters and more. Hover the mouse over the images to hide or show annotations.


Class balance #
There are 5 annotation classes in the dataset. Find the general statistics and balances for every class in the table below. Click any row to preview images that have labels of the selected class. Sort by column to find the most rare or prevalent classes.

Class ㅤ | Images ㅤ | Objects ㅤ | Count on image average | Area on image average |
|---|---|---|---|---|
PC-3➔ mask | 244 | 7906 | 32.4 | 26.09% |
PNT1A➔ mask | 205 | 9281 | 45.27 | 29.91% |
HOB➔ mask | 31 | 226 | 7.29 | 15.53% |
G361➔ mask | 25 | 1400 | 56 | 29.63% |
A2058➔ mask | 25 | 2609 | 104.36 | 38.67% |
Co-occurrence matrix #
Co-occurrence matrix is an extremely valuable tool that shows you the images for every pair of classes: how many images have objects of both classes at the same time. If you click any cell, you will see those images. We added the tooltip with an explanation for every cell for your convenience, just hover the mouse over a cell to preview the description.
Images #
Explore every single image in the dataset with respect to the number of annotations of each class it has. Click a row to preview selected image. Sort by any column to find anomalies and edge cases. Use horizontal scroll if the table has many columns for a large number of classes in the dataset.
Class sizes #
The table below gives various size properties of objects for every class. Click a row to see the image with annotations of the selected class. Sort columns to find classes with the smallest or largest objects or understand the size differences between classes.
Class | Object count | Avg area | Max area | Min area | Min height | Min height | Max height | Max height | Avg height | Avg height | Min width | Min width | Max width | Max width |
|---|---|---|---|---|---|---|---|---|---|---|---|---|---|---|
PNT1A mask | 9281 | 0.66% | 99.2% | 0.03% | 8px | 1.33% | 600px | 100% | 61px | 10.14% | 8px | 1.33% | 600px | 100% |
PC-3 mask | 7906 | 0.81% | 9.39% | 0.03% | 7px | 1.17% | 401px | 66.83% | 70px | 11.68% | 7px | 1.17% | 461px | 76.83% |
A2058 mask | 2609 | 0.37% | 2.4% | 0.03% | 7px | 1.17% | 217px | 36.17% | 56px | 9.32% | 9px | 1.5% | 244px | 40.67% |
G361 mask | 1400 | 0.53% | 5% | 0.03% | 7px | 1.17% | 266px | 44.33% | 64px | 10.61% | 8px | 1.33% | 250px | 41.67% |
HOB mask | 226 | 2.13% | 7.68% | 0.03% | 11px | 1.83% | 523px | 87.17% | 148px | 24.66% | 14px | 2.33% | 450px | 75% |
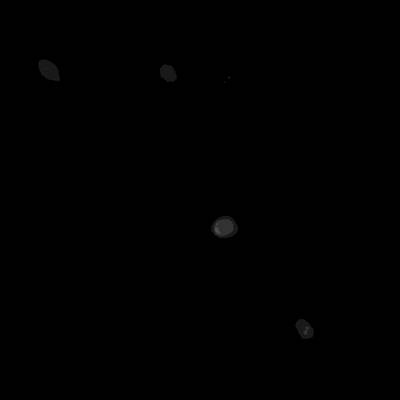
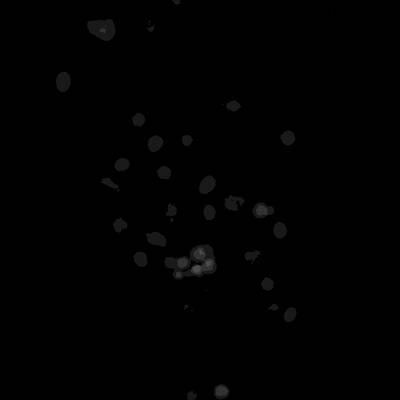
Spatial Heatmap #
The heatmaps below give the spatial distributions of all objects for every class. These visualizations provide insights into the most probable and rare object locations on the image. It helps analyze objects' placements in a dataset.
Objects #
Table contains all 21422 objects. Click a row to preview an image with annotations, and use search or pagination to navigate. Sort columns to find outliers in the dataset.
Object ID ㅤ | Class ㅤ | Image name click row to open | Image size height x width | Height ㅤ | Height ㅤ | Width ㅤ | Width ㅤ | Area ㅤ |
|---|---|---|---|---|---|---|---|---|
1➔ | PC-3 mask | 00235_PC3_img.tif.tiff | 600 x 600 | 57px | 9.5% | 15px | 2.5% | 0.18% |
2➔ | PC-3 mask | 00235_PC3_img.tif.tiff | 600 x 600 | 93px | 15.5% | 44px | 7.33% | 0.51% |
3➔ | PC-3 mask | 00235_PC3_img.tif.tiff | 600 x 600 | 87px | 14.5% | 31px | 5.17% | 0.36% |
4➔ | PC-3 mask | 00235_PC3_img.tif.tiff | 600 x 600 | 39px | 6.5% | 41px | 6.83% | 0.31% |
5➔ | PC-3 mask | 00235_PC3_img.tif.tiff | 600 x 600 | 45px | 7.5% | 47px | 7.83% | 0.41% |
6➔ | PC-3 mask | 00235_PC3_img.tif.tiff | 600 x 600 | 35px | 5.83% | 102px | 17% | 0.62% |
7➔ | PC-3 mask | 00235_PC3_img.tif.tiff | 600 x 600 | 33px | 5.5% | 48px | 8% | 0.22% |
8➔ | PC-3 mask | 00235_PC3_img.tif.tiff | 600 x 600 | 109px | 18.17% | 93px | 15.5% | 0.88% |
9➔ | PC-3 mask | 00235_PC3_img.tif.tiff | 600 x 600 | 50px | 8.33% | 81px | 13.5% | 0.59% |
10➔ | PC-3 mask | 00235_PC3_img.tif.tiff | 600 x 600 | 138px | 23% | 73px | 12.17% | 1.79% |
License #
Citation #
If you make use of the Annotated Quantitative Phase Microscopy Cell data, please cite the following reference:
@dataset{vicar_tomas_2021_5153251,
  author       = {Vicar, Tomas and
                  Chmelik, Jiri and
                  Jakubicek, Roman and
                  Chmelikova, Larisa and
                  Gumulec, Jaromir and
                  Balvan, Jan and
                  Provaznik, Ivo and
                  Kolar, Radim},
  title        = {{Annotated quantitative phase microscopy cell
                   dataset of various adherent cell lines for
                   segmentation purposes}},
  month        = may,
  year         = 2021,
  note         = {{This work is supported by the Czech Science
                   Foundation, project no. 18-24089S.}},
  publisher    = {Zenodo},
  doi          = {10.5281/zenodo.5153251},
  url          = {https://doi.org/10.5281/zenodo.5153251}
}
If you are happy with Dataset Ninja and use provided visualizations and tools in your work, please cite us:
@misc{ visualization-tools-for-annotated-quantitative-phase-microscopy-cell-dataset-dataset,
  title = { Visualization Tools for Annotated Quantitative Phase Microscopy Cell Dataset },
  type = { Computer Vision Tools },
  author = { Dataset Ninja },
  howpublished = { \url{ https://datasetninja.com/annotated-quantitative-phase-microscopy-cell-dataset } },
  url = { https://datasetninja.com/annotated-quantitative-phase-microscopy-cell-dataset },
  journal = { Dataset Ninja },
  publisher = { Dataset Ninja },
  year = { 2026 },
  month = { jul },
  note = { visited on 2026-07-20 },
}
Download #
Dataset Annotated Quantitative Phase Microscopy Cell can be downloaded in Supervisely format:
As an alternative, it can be downloaded with dataset-tools package:
pip install --upgrade dataset-tools
… using following python code:
import dataset_tools as dtools

dtools.download(dataset='Annotated Quantitative Phase Microscopy Cell', dst_dir='~/dataset-ninja/')
Make sure not to overlook the python code example available on the Supervisely Developer Portal. It will give you a clear idea of how to effortlessly work with the downloaded dataset.
The data in original format can be downloaded here:
Disclaimer #
Our gal from the legal dep told us we need to post this:
Dataset Ninja provides visualizations and statistics for some datasets that can be found online and can be downloaded by general audience. Dataset Ninja is not a dataset hosting platform and can only be used for informational purposes. The platform does not claim any rights for the original content, including images, videos, annotations and descriptions. Joint publishing is prohibited.
You take full responsibility when you use datasets presented at Dataset Ninja, as well as other information, including visualizations and statistics we provide. You are in charge of compliance with any dataset license and all other permissions. You are required to navigate datasets homepage and make sure that you can use it. In case of any questions, get in touch with us at hello@datasetninja.com.