

Introduction #
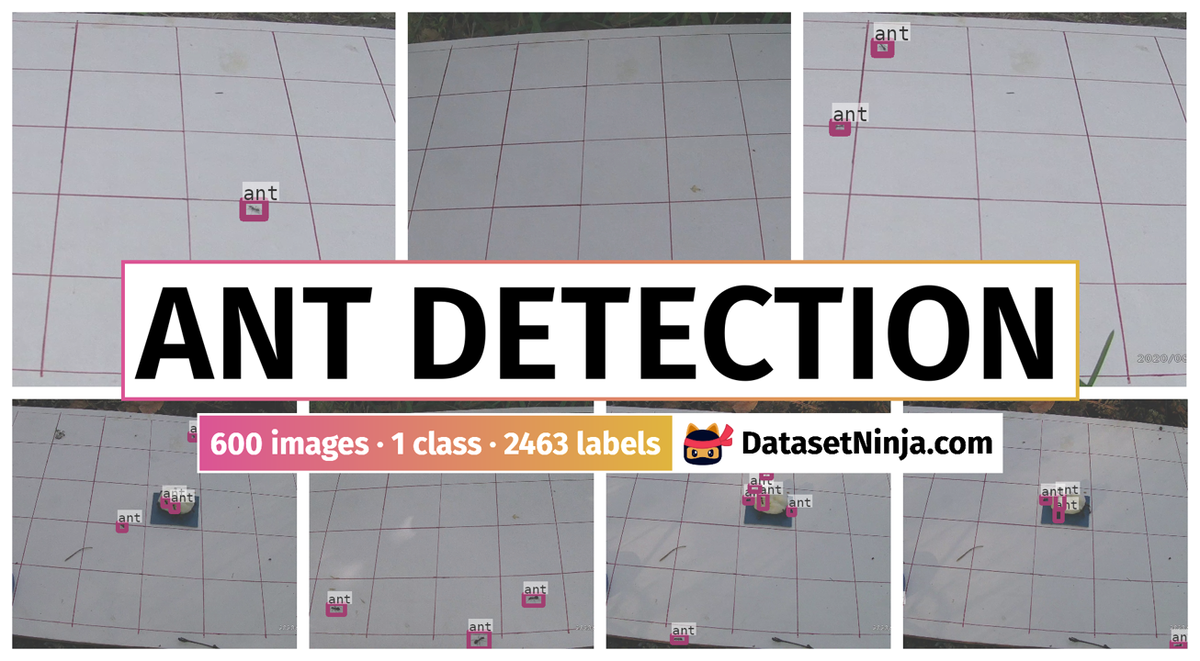
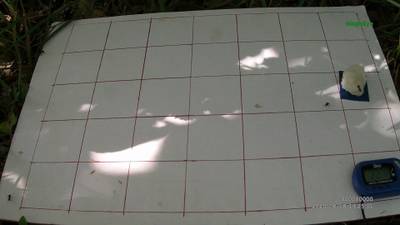
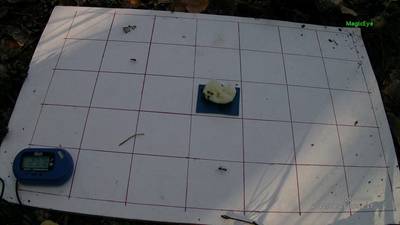
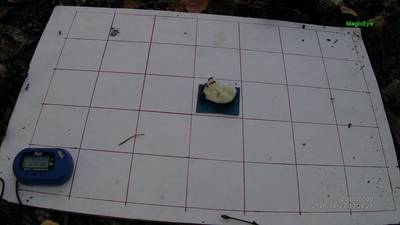
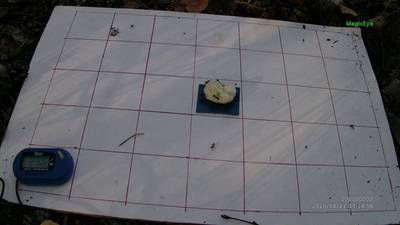
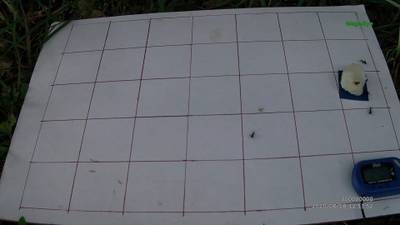
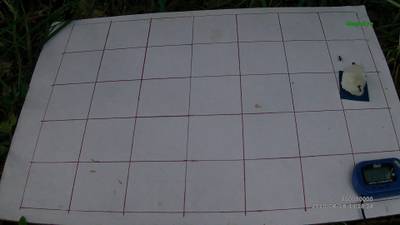
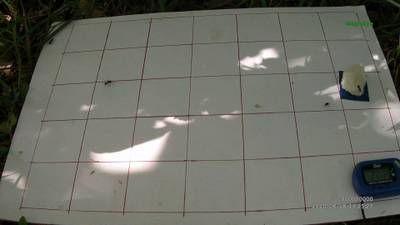
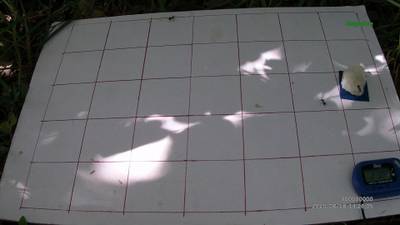
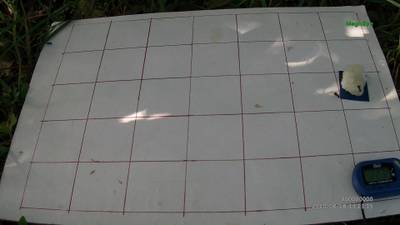
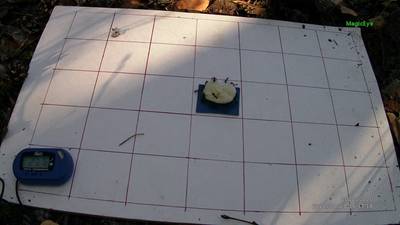
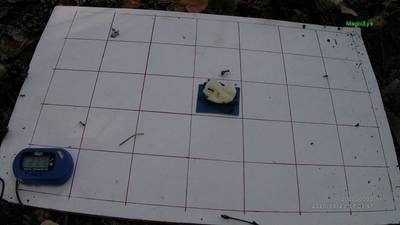
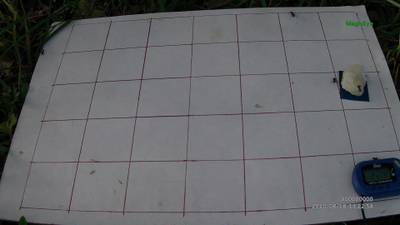
The Ant Detection dataset consists of images of ants moving on a marked out polygon in the open air and annotations to them. Image size 1920x1080. Annotations are text files that store the coordinates of bounding boxes encompassing all fully visible ants within the image. The dataset is divided into test and training sets containing 120 and 480 images, respectively.
Motivation
Presently, there’s a notable momentum in robotics towards advancing the development of biosimilar systems. Leveraging the ant family as a model object proves to be both intriguing and instructive for this endeavor. Biologists engaged in ant research often find themselves needing to elucidate their behavior. Observation stands as the most accessible method for achieving this goal. While analyzing data from video recordings presents distinct advantages over real-time observation—such as increased accuracy and informativeness—it also demands considerable time investment. To streamline this process, a proposed solution involves the creation of an ant detector utilizing video recordings. Subsequent data processing from the detector offers a partial automation of the research workflow.
Dataset description
The dataset consists of three-channel images. The marking of objects was carried out through the Label Studio utility and gives the output in .json format, one file for all images. The object description is a bounding box, which is described by two points: the top left point and the bottom right point. Key points: point marking the center of the head - H. point marking the center of the abdomen - A.
 Homepage
 Kaggle
Summary #
Ant Detection is a dataset for an object detection task. Possible applications of the dataset could be in the robotics industry and biological research.
The dataset consists of 600 images with 2463 labeled objects belonging to 1 single class (ant).
Images in the Ant Detection dataset have bounding box annotations. All images are labeled (i.e. with annotations). There are 2 splits in the dataset: train (480 images) and test (120 images). The dataset was released in 2023.
Explore #
Ant Detection dataset has 600 images. Click on one of the examples below or open "Explore" tool anytime you need to view dataset images with annotations. This tool has extended visualization capabilities like zoom, translation, objects table, custom filters and more. Hover the mouse over the images to hide or show annotations.


Class balance #
There are 1 annotation classes in the dataset. Find the general statistics and balances for every class in the table below. Click any row to preview images that have labels of the selected class. Sort by column to find the most rare or prevalent classes.

Class ㅤ | Images ㅤ | Objects ㅤ | Count on image average | Area on image average |
|---|---|---|---|---|
ant➔ rectangle | 600 | 2463 | 4.11 | 0.32% |
Images #
Explore every single image in the dataset with respect to the number of annotations of each class it has. Click a row to preview selected image. Sort by any column to find anomalies and edge cases. Use horizontal scroll if the table has many columns for a large number of classes in the dataset.
Object distribution #
Interactive heatmap chart for every class with object distribution shows how many images are in the dataset with a certain number of objects of a specific class. Users can click cell and see the list of all corresponding images.
Class sizes #
The table below gives various size properties of objects for every class. Click a row to see the image with annotations of the selected class. Sort columns to find classes with the smallest or largest objects or understand the size differences between classes.
Class | Object count | Avg area | Max area | Min area | Min height | Min height | Max height | Max height | Avg height | Avg height | Min width | Min width | Max width | Max width |
|---|---|---|---|---|---|---|---|---|---|---|---|---|---|---|
ant rectangle | 2463 | 0.08% | 0.37% | 0.01% | 13px | 1.2% | 100px | 9.26% | 38px | 3.48% | 14px | 0.73% | 102px | 5.31% |
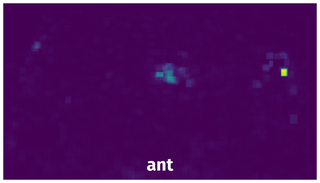
Spatial Heatmap #
The heatmaps below give the spatial distributions of all objects for every class. These visualizations provide insights into the most probable and rare object locations on the image. It helps analyze objects' placements in a dataset.
Objects #
Table contains all 2463 objects. Click a row to preview an image with annotations, and use search or pagination to navigate. Sort columns to find outliers in the dataset.
Object ID ㅤ | Class ㅤ | Image name click row to open | Image size height x width | Height ㅤ | Height ㅤ | Width ㅤ | Width ㅤ | Area ㅤ |
|---|---|---|---|---|---|---|---|---|
1➔ | ant rectangle | image82.png | 1080 x 1920 | 44px | 4.07% | 27px | 1.41% | 0.06% |
2➔ | ant rectangle | image82.png | 1080 x 1920 | 22px | 2.04% | 35px | 1.82% | 0.04% |
3➔ | ant rectangle | image82.png | 1080 x 1920 | 46px | 4.26% | 49px | 2.55% | 0.11% |
4➔ | ant rectangle | image156.png | 1080 x 1920 | 31px | 2.87% | 37px | 1.93% | 0.06% |
5➔ | ant rectangle | image156.png | 1080 x 1920 | 23px | 2.13% | 23px | 1.2% | 0.03% |
6➔ | ant rectangle | image156.png | 1080 x 1920 | 19px | 1.76% | 38px | 1.98% | 0.03% |
7➔ | ant rectangle | image156.png | 1080 x 1920 | 21px | 1.94% | 36px | 1.88% | 0.04% |
8➔ | ant rectangle | image477.png.jpeg | 1080 x 1920 | 45px | 4.17% | 45px | 2.34% | 0.1% |
9➔ | ant rectangle | image477.png.jpeg | 1080 x 1920 | 41px | 3.8% | 42px | 2.19% | 0.08% |
10➔ | ant rectangle | image477.png.jpeg | 1080 x 1920 | 56px | 5.19% | 43px | 2.24% | 0.12% |
License #
Citation #
If you make use of the Ants data, please cite the following reference:
@dataset{Ants,
  author={Eliza Moscovskaya},
  title={Ants},
  year={2023},
  url={https://www.kaggle.com/datasets/elizamoscovskaya/ant-2-keypoints-dataset}
}
If you are happy with Dataset Ninja and use provided visualizations and tools in your work, please cite us:
@misc{ visualization-tools-for-ant-dataset,
  title = { Visualization Tools for Ant Detection Dataset },
  type = { Computer Vision Tools },
  author = { Dataset Ninja },
  howpublished = { \url{ https://datasetninja.com/ant-2 } },
  url = { https://datasetninja.com/ant-2 },
  journal = { Dataset Ninja },
  publisher = { Dataset Ninja },
  year = { 2026 },
  month = { aug },
  note = { visited on 2026-08-02 },
}
Download #
Dataset Ant Detection can be downloaded in Supervisely format:
As an alternative, it can be downloaded with dataset-tools package:
pip install --upgrade dataset-tools
… using following python code:
import dataset_tools as dtools

dtools.download(dataset='Ant Detection', dst_dir='~/dataset-ninja/')
Make sure not to overlook the python code example available on the Supervisely Developer Portal. It will give you a clear idea of how to effortlessly work with the downloaded dataset.
The data in original format can be downloaded here.
Disclaimer #
Our gal from the legal dep told us we need to post this:
Dataset Ninja provides visualizations and statistics for some datasets that can be found online and can be downloaded by general audience. Dataset Ninja is not a dataset hosting platform and can only be used for informational purposes. The platform does not claim any rights for the original content, including images, videos, annotations and descriptions. Joint publishing is prohibited.
You take full responsibility when you use datasets presented at Dataset Ninja, as well as other information, including visualizations and statistics we provide. You are in charge of compliance with any dataset license and all other permissions. You are required to navigate datasets homepage and make sure that you can use it. In case of any questions, get in touch with us at hello@datasetninja.com.