
Introduction #
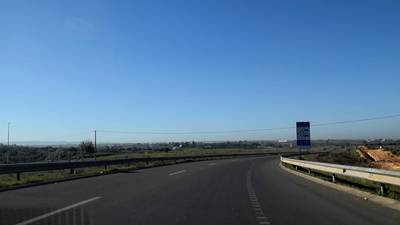
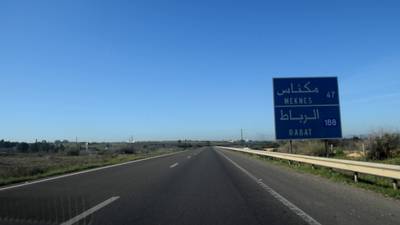
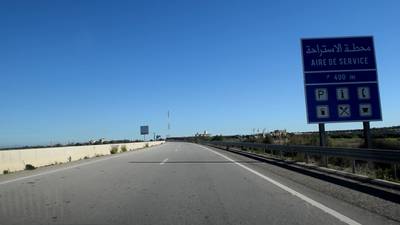
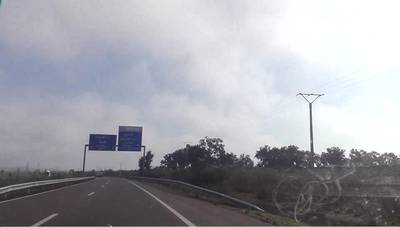
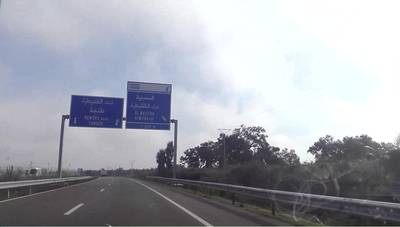
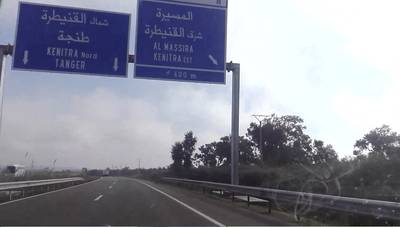
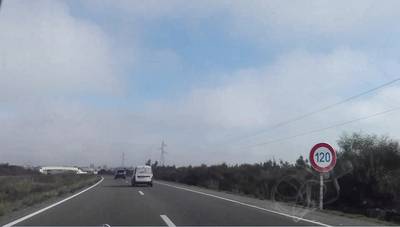
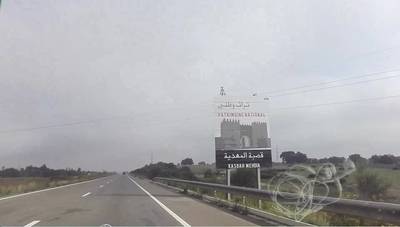
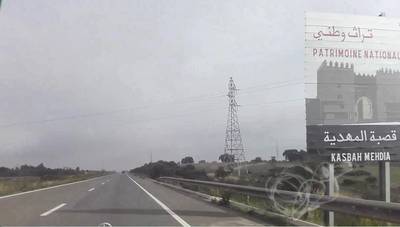
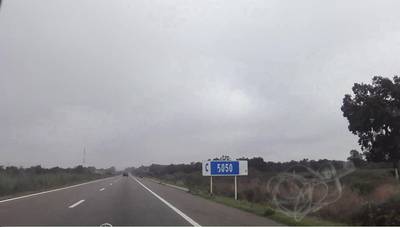
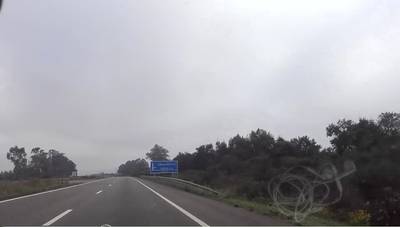
The creators of the ASAYAR: A Dataset for Arabic-Latin Text Detection gathered 1765 images along Moroccan highways, encompassing two complete journeys totaling around 2000 km. These trips consist of the first route from Oujda to Rabat and the second from Tangier to Casablanca. The images were captured using a Nikon D3300 camera with 24 megapixels and a Samsung Galaxy S7 smartphone camera with 13 megapixels. They encompass a variety of Moroccan highway signs, including those with Arabic/French text, regulatory indications, and warning traffic signs. The data annotation process took into account environmental factors.
The labelers of ASAYAR invested over 2000 hours of work, spanning nine months, to manually annotate the dataset. The annotated detection dataset is organized into one of three type groups: ASAYAR_SIGN for traffic sign objects, ASAYAR_TXT for text-based panels with word and line level annotations, and ASAYAR_SYM for panels featuring annotated directional symbols.
The authors employed the stratified sampling method to divide the sub-datasets into training (80%) and testing (20%) sets, ensuring balanced classes in each. For ASAYAR_SIGN, the training set comprises 1416 images, with 349 in the testing set. ASAYAR_TXT includes 1100 training samples and 275 testing samples, incorporating both word-level and line-level datasets. Lastly, ASAYAR_SYM has 444 images for training and 114 for testing.
 Homepage
 Research Paper
Summary #
ASAYAR: A Dataset for Arabic-Latin Text Detection is a dataset for an object detection task. It is used in the automotive industry, and in the optical character recognition (OCR) domain.
The dataset consists of 3698 images with 14382 labeled objects belonging to 13 different classes including guide sign, arabic box, latin box, and other: number, regulatory sign, down right arrow, down arrow, mixed arrow, warning sign, right arrow, up arrow, down left arrow, and mixed box.
Images in the ASAYAR dataset have bounding box annotations. There is 1 unlabeled image (i.e. without annotations). There are 2 splits in the dataset: train (2960 images) and test (738 images). Addirionally, every image contains information about its type: sign, text, or sym. The dataset was released in 2021 by the Sidi Mohamed Ben Abdellah University, Morocco and Mohammed VI Polytechnic University, Morocco.
Here are the visualized examples for the classes:
Explore #
ASAYAR dataset has 3698 images. Click on one of the examples below or open "Explore" tool anytime you need to view dataset images with annotations. This tool has extended visualization capabilities like zoom, translation, objects table, custom filters and more. Hover the mouse over the images to hide or show annotations.


Class balance #
There are 13 annotation classes in the dataset. Find the general statistics and balances for every class in the table below. Click any row to preview images that have labels of the selected class. Sort by column to find the most rare or prevalent classes.

Class ㅤ | Images ㅤ | Objects ㅤ | Count on image average | Area on image average |
|---|---|---|---|---|
guide sign➔ rectangle | 1557 | 1899 | 1.22 | 3.51% |
arabic box➔ rectangle | 1142 | 4467 | 3.91 | 0.84% |
latin box➔ rectangle | 1096 | 4810 | 4.39 | 0.51% |
number➔ rectangle | 1061 | 1630 | 1.54 | 0.12% |
regulatory sign➔ rectangle | 409 | 475 | 1.16 | 0.63% |
down right arrow➔ rectangle | 340 | 390 | 1.15 | 0.13% |
down arrow➔ rectangle | 158 | 353 | 2.23 | 0.13% |
mixed arrow➔ rectangle | 127 | 127 | 1 | 0.64% |
warning sign➔ rectangle | 77 | 82 | 1.06 | 0.42% |
right arrow➔ rectangle | 61 | 61 | 1 | 0.41% |
Co-occurrence matrix #
Co-occurrence matrix is an extremely valuable tool that shows you the images for every pair of classes: how many images have objects of both classes at the same time. If you click any cell, you will see those images. We added the tooltip with an explanation for every cell for your convenience, just hover the mouse over a cell to preview the description.
Images #
Explore every single image in the dataset with respect to the number of annotations of each class it has. Click a row to preview selected image. Sort by any column to find anomalies and edge cases. Use horizontal scroll if the table has many columns for a large number of classes in the dataset.
Object distribution #
Interactive heatmap chart for every class with object distribution shows how many images are in the dataset with a certain number of objects of a specific class. Users can click cell and see the list of all corresponding images.
Class sizes #
The table below gives various size properties of objects for every class. Click a row to see the image with annotations of the selected class. Sort columns to find classes with the smallest or largest objects or understand the size differences between classes.
Class | Object count | Avg area | Max area | Min area | Min height | Min height | Max height | Max height | Avg height | Avg height | Min width | Min width | Max width | Max width |
|---|---|---|---|---|---|---|---|---|---|---|---|---|---|---|
latin box rectangle | 4810 | 0.12% | 2.54% | 0% | 3px | 0.28% | 109px | 10% | 28px | 2.54% | 2px | 0.1% | 487px | 25.36% |
arabic box rectangle | 4467 | 0.22% | 2.56% | 0% | 2px | 0.19% | 150px | 13.76% | 41px | 3.79% | 3px | 0.16% | 438px | 22.81% |
guide sign rectangle | 1899 | 2.88% | 22.7% | 0.01% | 11px | 1.01% | 777px | 71.28% | 192px | 17.7% | 15px | 0.78% | 807px | 42.03% |
number rectangle | 1630 | 0.08% | 0.65% | 0.01% | 9px | 0.83% | 101px | 9.35% | 30px | 2.76% | 9px | 0.47% | 148px | 7.71% |
regulatory sign rectangle | 475 | 0.54% | 4.27% | 0.01% | 11px | 1.01% | 316px | 29.26% | 90px | 8.35% | 11px | 0.57% | 364px | 18.96% |
down right arrow rectangle | 390 | 0.12% | 8.03% | 0.01% | 10px | 0.93% | 391px | 35.87% | 42px | 3.88% | 11px | 0.57% | 430px | 22.4% |
down arrow rectangle | 353 | 0.06% | 0.42% | 0.01% | 23px | 2.11% | 100px | 9.17% | 50px | 4.61% | 8px | 0.42% | 96px | 5% |
mixed arrow rectangle | 127 | 0.64% | 2.9% | 0.05% | 18px | 1.67% | 502px | 46.06% | 185px | 17.02% | 22px | 1.15% | 187px | 9.74% |
warning sign rectangle | 82 | 0.4% | 6.48% | 0.01% | 12px | 1.11% | 349px | 32.31% | 67px | 6.18% | 14px | 0.73% | 385px | 20.05% |
up arrow rectangle | 77 | 0.09% | 0.92% | 0.01% | 16px | 1.48% | 501px | 45.96% | 69px | 6.37% | 9px | 0.47% | 56px | 2.92% |
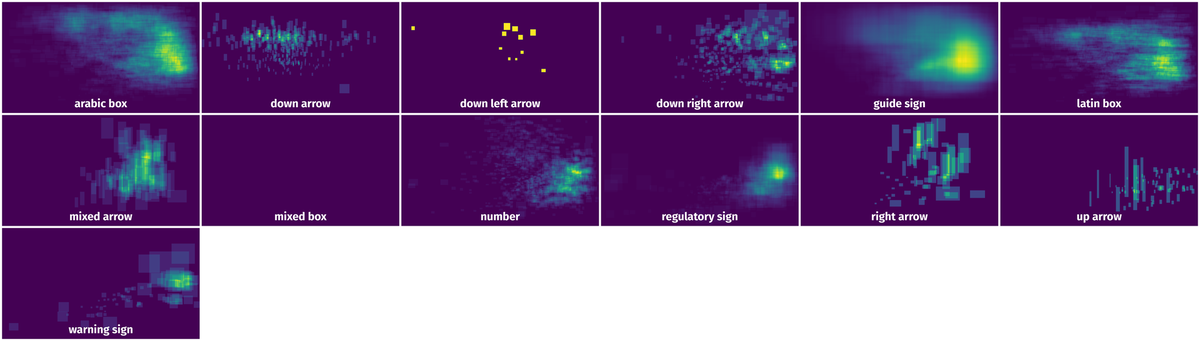
Spatial Heatmap #
The heatmaps below give the spatial distributions of all objects for every class. These visualizations provide insights into the most probable and rare object locations on the image. It helps analyze objects' placements in a dataset.
Objects #
Table contains all 14382 objects. Click a row to preview an image with annotations, and use search or pagination to navigate. Sort columns to find outliers in the dataset.
Object ID ㅤ | Class ㅤ | Image name click row to open | Image size height x width | Height ㅤ | Height ㅤ | Width ㅤ | Width ㅤ | Area ㅤ |
|---|---|---|---|---|---|---|---|---|
1➔ | arabic box rectangle | txt_image_1149.png | 1090 x 1920 | 43px | 3.94% | 71px | 3.7% | 0.15% |
2➔ | arabic box rectangle | txt_image_1149.png | 1090 x 1920 | 40px | 3.67% | 132px | 6.88% | 0.25% |
3➔ | arabic box rectangle | txt_image_1149.png | 1090 x 1920 | 44px | 4.04% | 114px | 5.94% | 0.24% |
4➔ | arabic box rectangle | txt_image_1149.png | 1090 x 1920 | 44px | 4.04% | 109px | 5.68% | 0.23% |
5➔ | latin box rectangle | txt_image_1149.png | 1090 x 1920 | 30px | 2.75% | 49px | 2.55% | 0.07% |
6➔ | latin box rectangle | txt_image_1149.png | 1090 x 1920 | 34px | 3.12% | 136px | 7.08% | 0.22% |
7➔ | latin box rectangle | txt_image_1149.png | 1090 x 1920 | 31px | 2.84% | 30px | 1.56% | 0.04% |
8➔ | latin box rectangle | txt_image_1149.png | 1090 x 1920 | 29px | 2.66% | 105px | 5.47% | 0.15% |
9➔ | latin box rectangle | txt_image_1149.png | 1090 x 1920 | 31px | 2.84% | 30px | 1.56% | 0.04% |
10➔ | latin box rectangle | txt_image_1149.png | 1090 x 1920 | 32px | 2.94% | 149px | 7.76% | 0.23% |
License #
This dataset is made freely available to academic and non-academic entities for non-commercial purposes such as academic research, teaching or scientific publications. Permission is granted to use the data given that you agree:
- That the dataset comes “AS IS”, without express or implied warranty. Although every effort has been made to ensure accuracy, we (vcar) do not accept any responsibility for errors or omissions
- That you include a reference to the ASAYAR Dataset in any work that makes use of the dataset. For research papers, cite our preferred publication as listed on our website; for other media cite our preferred publication as listed on our website or link to the ASAYAR website.
- That you do not distribute this dataset or modified versions. It is permissible to distribute derivative works in as far as they are abstract representations of this dataset (such as models trained on it or additional annotations that do not directly include any of our data) and do not allow to recover the dataset or something similar in character.
- That you may not use the dataset or any derivative work for commercial purposes as, for example, licensing or selling the data, or using the data with a purpose to procure a commercial gain.
- That all rights not expressly granted to you are reserved by us.
Citation #
If you make use of the ASAYAR data, please cite the following reference:
@ARTICLE{9233923,
  author={M. {Akallouch} and K. S. {Boujemaa} and A. {Bouhoute} and K. {Fardousse} and I. {Berrada}},
  journal={IEEE Transactions on Intelligent Transportation Systems},
  title={ASAYAR: A Dataset for Arabic-Latin Scene Text Localization in Highway Traffic Panels},
  year={2020},
  pages={1-11},
  doi={10.1109/TITS.2020.3029451}
}
If you are happy with Dataset Ninja and use provided visualizations and tools in your work, please cite us:
@misc{ visualization-tools-for-asayar-dataset,
  title = { Visualization Tools for ASAYAR Dataset },
  type = { Computer Vision Tools },
  author = { Dataset Ninja },
  howpublished = { \url{ https://datasetninja.com/asayar } },
  url = { https://datasetninja.com/asayar },
  journal = { Dataset Ninja },
  publisher = { Dataset Ninja },
  year = { 2026 },
  month = { jul },
  note = { visited on 2026-07-25 },
}
Download #
Please visit dataset homepage to download the data.
Disclaimer #
Our gal from the legal dep told us we need to post this:
Dataset Ninja provides visualizations and statistics for some datasets that can be found online and can be downloaded by general audience. Dataset Ninja is not a dataset hosting platform and can only be used for informational purposes. The platform does not claim any rights for the original content, including images, videos, annotations and descriptions. Joint publishing is prohibited.
You take full responsibility when you use datasets presented at Dataset Ninja, as well as other information, including visualizations and statistics we provide. You are in charge of compliance with any dataset license and all other permissions. You are required to navigate datasets homepage and make sure that you can use it. In case of any questions, get in touch with us at hello@datasetninja.com.