

Introduction #
The authors of the Automatic Monitoring of Pigs dataset recognized the significance of animals expressing their internal and external stimuli through behaviour changes, particularly in assessing their health and welfare. They designed an algorithm based on deep learning for detecting and tracking pig posture and locomotion activities. This algorithm aimed to measure behaviour changes in an experimental pig barn under different greenhouse gas (GHG) levels.
The study involved elevating GHG levels in the barn by closing ventilators for specific durations throughout the day and night. Simultaneously, the corresponding pig posture and locomotion activities were observed before, during, and after each treatment. The results indicated that as GHG concentration increased, pig activity levels decreased, resulting in longer durations of lateral-lying posture. Moreover, activities like standing, sternal-lying, and walking decreased as GHG levels rose. This suggested that monitoring and tracking pig physical behaviours through a simple RGB camera and deep learning models could effectively assess individual pig health and welfare.
| Pig Posture and Label | Identification Convention | Instances |
|---|---|---|
| standing pig (standing_pig) | Only feet or feet and snout in contact with the floor | 10,124 |
| sternal lying pig (sl_pig) | Belly and folded limbs in contact with the floor | 9364 |
| lateral lying pig (ll_pig) | Side trunk and extended limbs in contact with the ground | 10,745 |
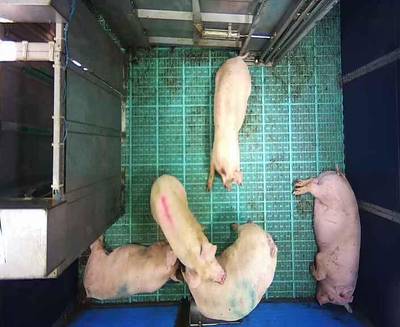
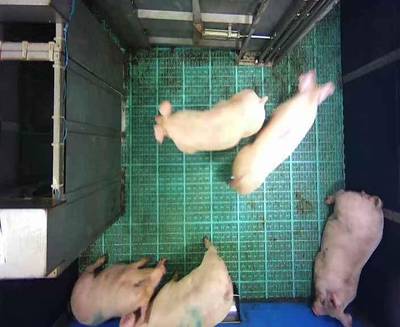
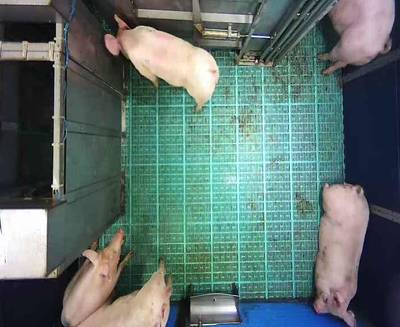
The experimental setup took place in a controlled pig barn, with specific conditions (see details in the paper) applied to raise GHG concentrations. The study involved five Yorkshire breed pigs, and their conditions were well-documented, including feeding schedules and markings for visual identification.
The GHG concentrations were measured using gas chromatography, with carbon dioxide (CO2) being the dominant GHG. The concentrations were analyzed before, after, and one hour after treatment. The authors provided data and graphs illustrating the GHG concentrations of CO2_ppm and CO_NO_CH4_N2O_ppm over time.
Average greenhouse gas (GHG) concentrations before, during, and after an hour of treatment. The x-axis represents the time (hh:mm) of day, whereas the left y-axis represents the average CO2 concentration, and the right y-axis represents the average CO, NO, CH4, and N2O.
The study also included group-wise pig posture and walking behaviour score, which were assessed by counting the number of pigs exhibiting specific behaviours in each frame before treatment, during treatment, and after treatment. These scores revealed that pig behaviour was affected by GHG levels, with increased lateral lying and reduced standing and walking activities during elevated GHG conditions.
Group-wise average posture and walking frame scores of pigs: (a) standing score, (b) walking score, © sternal-lying score, and (d) lateral-lying score. The scores show the average number of pigs in a frame with a particular posture. The bars represent the average activity scores obtained in three days at an hour before, during, and after the treatment period in the morning, day, and nighttime.
Additionally, the authors presented locomotion patterns and distances travelled by walking pigs during the experiments. These observations provided insights into how GHG levels influenced pig activities throughout the day.
Total distance travelled by the pigs in the group and the day 1-morning time locomotion activities: (a) the total distance travelled by all pigs during the study period, (b) locomotion of the group pigs before treatment in the morning of day 1, © during the treatment, and (d) after the treatment.
In summary, the authors conducted a comprehensive study to assess the impact of elevated GHG levels on pig behaviour using computer vision and deep learning techniques. Their findings underscored the potential of this approach for non-invasive monitoring of pig health and welfare under varying environmental conditions.
 Homepage
Summary #
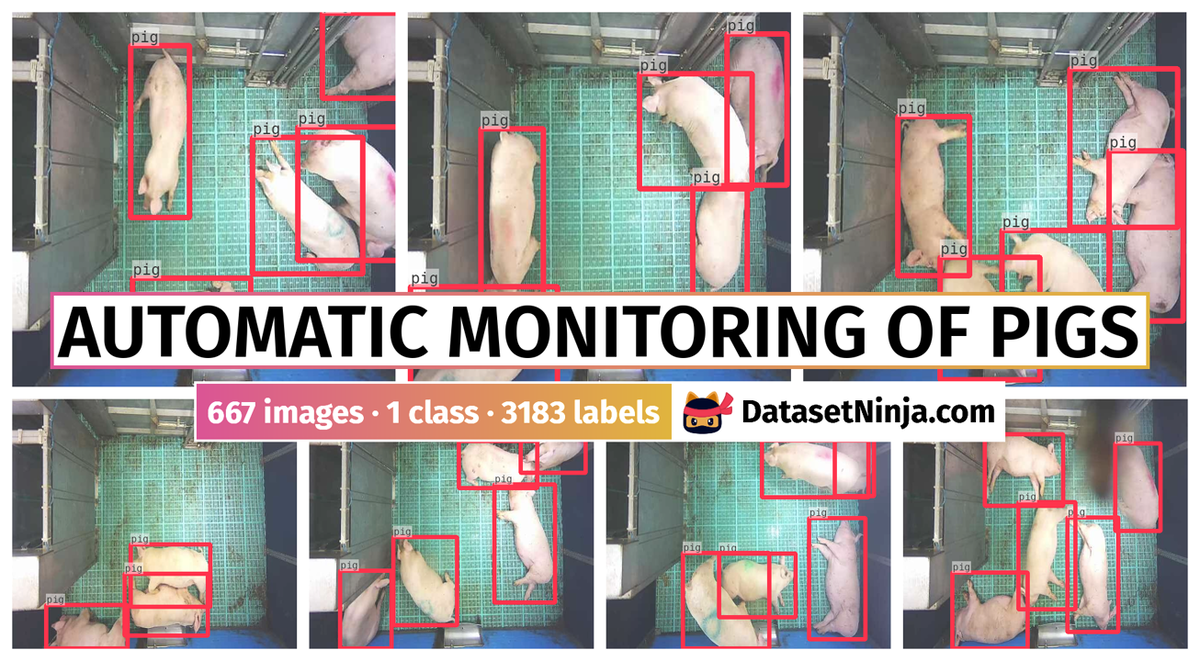
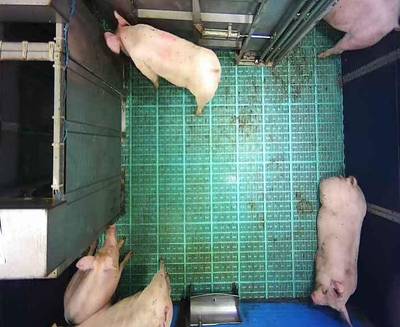
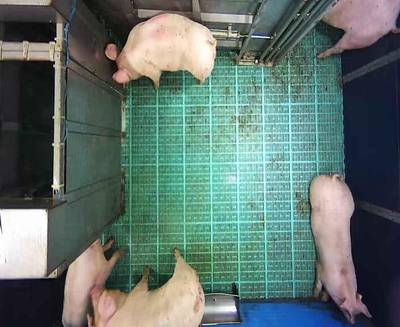
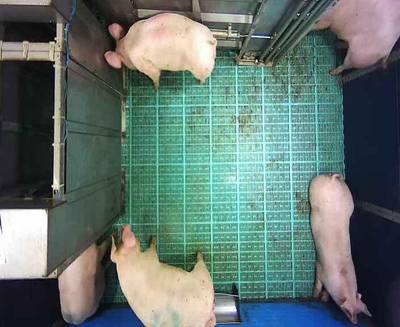
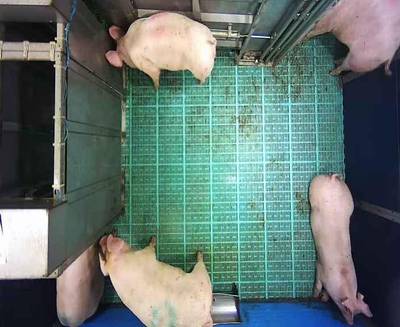
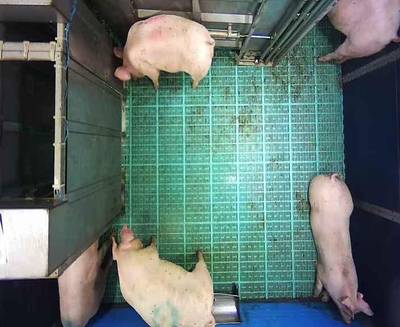
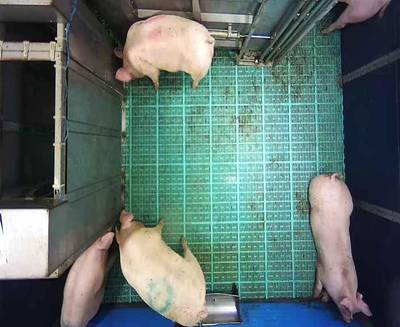
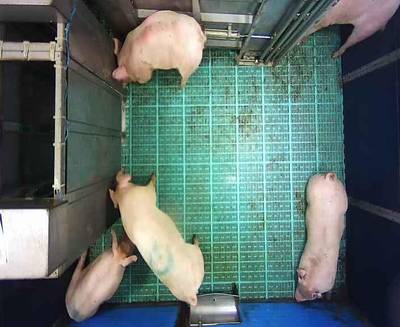
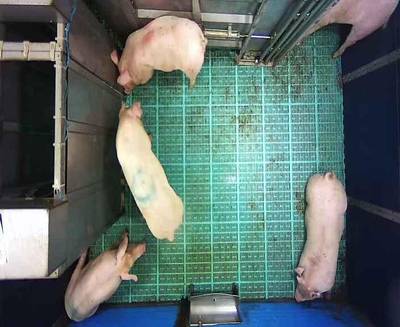
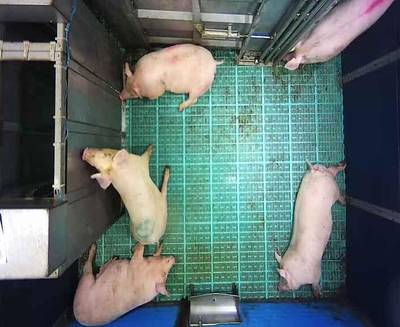
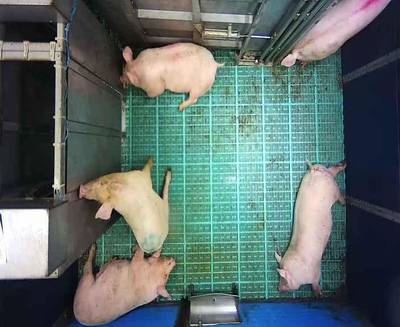
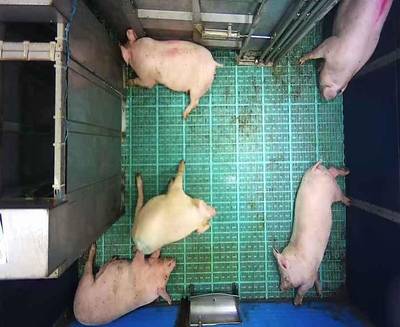
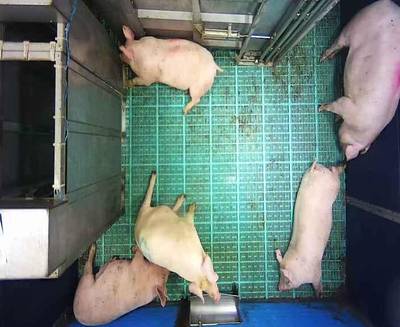
Automatic Monitoring of Pigs` Physico-Temporal Activities at Different Greenhouse Gas Concentrations is a dataset for an object detection task. It is used in the livestock industry.
The dataset consists of 667 images with 3183 labeled objects belonging to 1 single class (pig).
Images in the Automatic Monitoring of Pigs dataset have bounding box annotations. All images are labeled (i.e. with annotations). There are no pre-defined train/val/test splits in the dataset. Every image has information about CO2_ppm and CO_NO_CH4_N2O_ppm gas concentrations, while every object has information about it’s posture: standing pig, sternal lying pig, lateral lying pig; and it’s treatment score and state: before treatment, during treatment, after treatment. To explore postures and treatments of every pig, run dataset in supervisely. The dataset was released in 2021 by the Gyeongsang National University, Korea and Ministry of Communication and Information Technology, Nepal.
Explore #
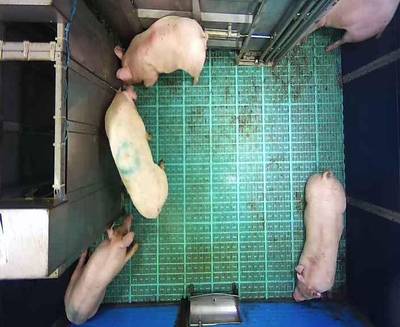
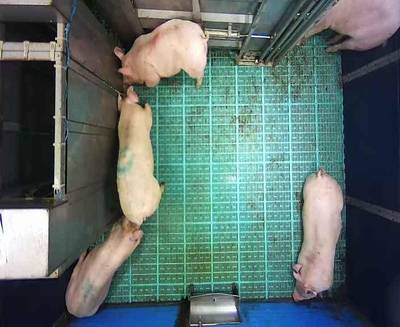
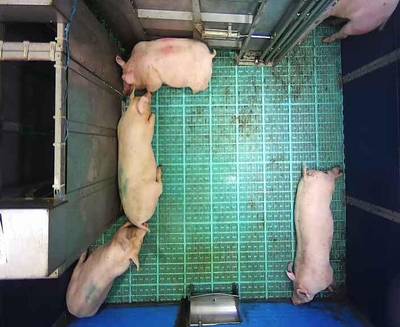
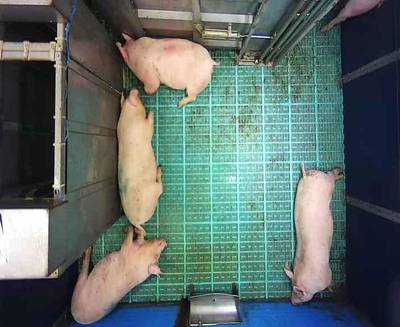
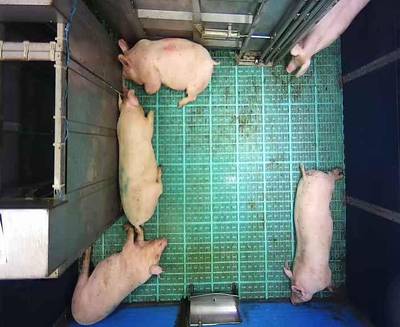
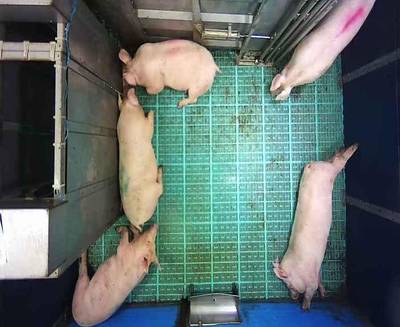
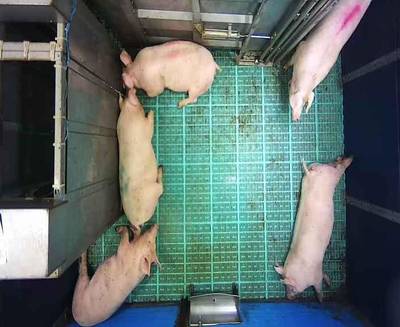
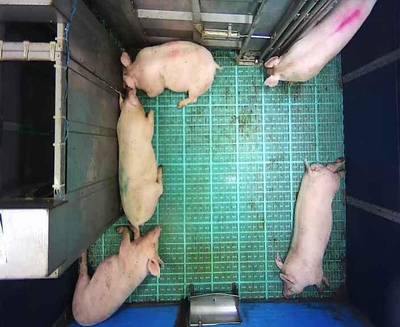
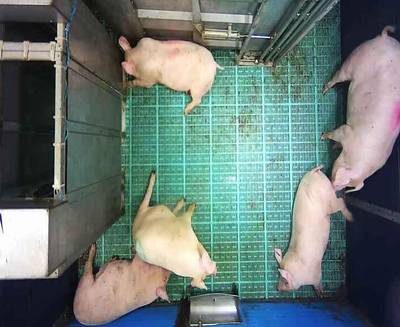
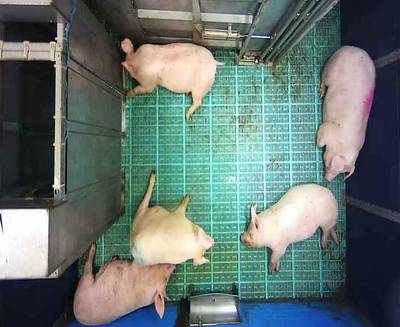
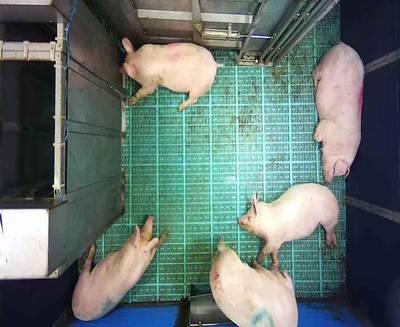
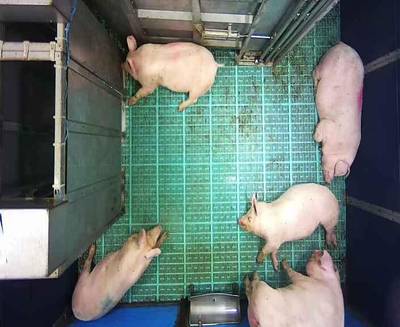
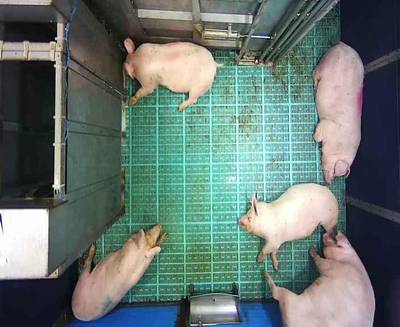
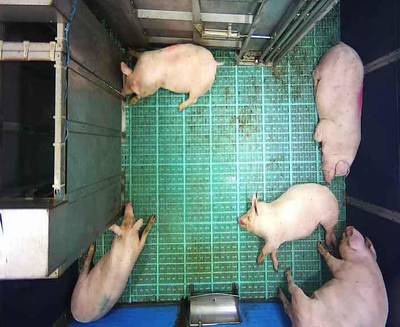
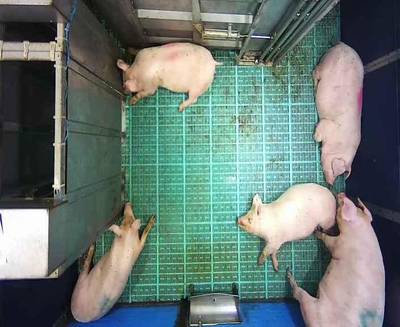
Automatic Monitoring of Pigs dataset has 667 images. Click on one of the examples below or open "Explore" tool anytime you need to view dataset images with annotations. This tool has extended visualization capabilities like zoom, translation, objects table, custom filters and more. Hover the mouse over the images to hide or show annotations.


Class balance #
There are 1 annotation classes in the dataset. Find the general statistics and balances for every class in the table below. Click any row to preview images that have labels of the selected class. Sort by column to find the most rare or prevalent classes.

Class ㅤ | Images ㅤ | Objects ㅤ | Count on image average | Area on image average |
|---|---|---|---|---|
pig➔ rectangle | 667 | 3183 | 4.77 | 30.31% |
Images #
Explore every single image in the dataset with respect to the number of annotations of each class it has. Click a row to preview selected image. Sort by any column to find anomalies and edge cases. Use horizontal scroll if the table has many columns for a large number of classes in the dataset.
Object distribution #
Interactive heatmap chart for every class with object distribution shows how many images are in the dataset with a certain number of objects of a specific class. Users can click cell and see the list of all corresponding images.
Class sizes #
The table below gives various size properties of objects for every class. Click a row to see the image with annotations of the selected class. Sort columns to find classes with the smallest or largest objects or understand the size differences between classes.
Class | Object count | Avg area | Max area | Min area | Min height | Min height | Max height | Max height | Avg height | Avg height | Min width | Min width | Max width | Max width |
|---|---|---|---|---|---|---|---|---|---|---|---|---|---|---|
pig rectangle | 3183 | 7.04% | 15.86% | 2.1% | 77px | 13.37% | 339px | 58.85% | 200px | 34.65% | 57px | 8.1% | 268px | 38.07% |
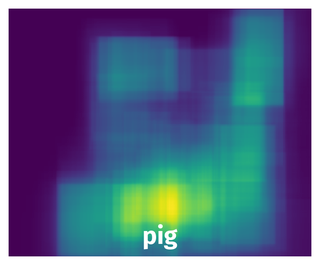
Spatial Heatmap #
The heatmaps below give the spatial distributions of all objects for every class. These visualizations provide insights into the most probable and rare object locations on the image. It helps analyze objects' placements in a dataset.
Objects #
Table contains all 3183 objects. Click a row to preview an image with annotations, and use search or pagination to navigate. Sort columns to find outliers in the dataset.
Object ID ㅤ | Class ㅤ | Image name click row to open | Image size height x width | Height ㅤ | Height ㅤ | Width ㅤ | Width ㅤ | Area ㅤ |
|---|---|---|---|---|---|---|---|---|
1➔ | pig rectangle | 0702 18-16-21.jpg | 576 x 704 | 173px | 30.03% | 193px | 27.41% | 8.23% |
2➔ | pig rectangle | 0702 18-16-21.jpg | 576 x 704 | 104px | 18.06% | 137px | 19.46% | 3.51% |
3➔ | pig rectangle | 0702 18-16-21.jpg | 576 x 704 | 171px | 29.69% | 208px | 29.55% | 8.77% |
4➔ | pig rectangle | 0702 18-16-21.jpg | 576 x 704 | 258px | 44.79% | 120px | 17.05% | 7.63% |
5➔ | pig rectangle | 0702 08-00-39.jpg | 576 x 704 | 264px | 45.83% | 75px | 10.65% | 4.88% |
6➔ | pig rectangle | 0702 08-00-39.jpg | 576 x 704 | 102px | 17.71% | 221px | 31.39% | 5.56% |
7➔ | pig rectangle | 0702 08-00-39.jpg | 576 x 704 | 235px | 40.8% | 162px | 23.01% | 9.39% |
8➔ | pig rectangle | 0702 08-00-39.jpg | 576 x 704 | 245px | 42.53% | 94px | 13.35% | 5.68% |
9➔ | pig rectangle | 0702 08-00-39.jpg | 576 x 704 | 135px | 23.44% | 174px | 24.72% | 5.79% |
10➔ | pig rectangle | 0714 10-25-30.jpg | 576 x 704 | 256px | 44.44% | 98px | 13.92% | 6.19% |
License #
Citation #
If you make use of the Automatic Monitoring of Pigs data, please cite the following reference:
@Article{ani11113089,
  AUTHOR = {Bhujel, Anil and Arulmozhi, Elanchezhian and Moon, Byeong-Eun and Kim, Hyeon-Tae},
  TITLE = {Deep-Learning-Based Automatic Monitoring of Pigs’ Physico-Temporal Activities at Different Greenhouse Gas Concentrations},
  JOURNAL = {Animals},
  VOLUME = {11},
  YEAR = {2021},
  NUMBER = {11},
  ARTICLE-NUMBER = {3089},
  URL = {https://www.mdpi.com/2076-2615/11/11/3089},
  PubMedID = {34827821},
  ISSN = {2076-2615},
  ABSTRACT = {Pig behavior is an integral part of health and welfare management, as pigs usually reflect their inner emotions through behavior change. The livestock environment plays a key role in pigs’ health and wellbeing. A poor farm environment increases the toxic GHGs, which might deteriorate pigs’ health and welfare. In this study a computer-vision-based automatic monitoring and tracking model was proposed to detect pigs’ short-term physical activities in the compromised environment. The ventilators of the livestock barn were closed for an hour, three times in a day (07:00–08:00, 13:00–14:00, and 20:00–21:00) to create a compromised environment, which increases the GHGs level significantly. The corresponding pig activities were observed before, during, and after an hour of the treatment. Two widely used object detection models (YOLOv4 and Faster R-CNN) were trained and compared their performances in terms of pig localization and posture detection. The YOLOv4, which outperformed the Faster R-CNN model, was coupled with a Deep-SORT tracking algorithm to detect and track the pig activities. The results revealed that the pigs became more inactive with the increase in GHG concentration, reducing their standing and walking activities. Moreover, the pigs shortened their sternal-lying posture, increasing the lateral lying posture duration at higher GHG concentration. The high detection accuracy (mAP: 98.67%) and tracking accuracy (MOTA: 93.86% and MOTP: 82.41%) signify the models’ efficacy in the monitoring and tracking of pigs’ physical activities non-invasively.},
  DOI = {10.3390/ani11113089}
}
If you are happy with Dataset Ninja and use provided visualizations and tools in your work, please cite us:
@misc{ visualization-tools-for-automatic-monitoring-pigs-dataset,
  title = { Visualization Tools for Automatic Monitoring of Pigs Dataset },
  type = { Computer Vision Tools },
  author = { Dataset Ninja },
  howpublished = { \url{ https://datasetninja.com/automatic-monitoring-pigs } },
  url = { https://datasetninja.com/automatic-monitoring-pigs },
  journal = { Dataset Ninja },
  publisher = { Dataset Ninja },
  year = { 2026 },
  month = { jul },
  note = { visited on 2026-07-30 },
}
Download #
Dataset Automatic Monitoring of Pigs can be downloaded in Supervisely format:
As an alternative, it can be downloaded with dataset-tools package:
pip install --upgrade dataset-tools
… using following python code:
import dataset_tools as dtools

dtools.download(dataset='Automatic Monitoring of Pigs', dst_dir='~/dataset-ninja/')
Make sure not to overlook the python code example available on the Supervisely Developer Portal. It will give you a clear idea of how to effortlessly work with the downloaded dataset.
The data in original format can be downloaded here.
Disclaimer #
Our gal from the legal dep told us we need to post this:
Dataset Ninja provides visualizations and statistics for some datasets that can be found online and can be downloaded by general audience. Dataset Ninja is not a dataset hosting platform and can only be used for informational purposes. The platform does not claim any rights for the original content, including images, videos, annotations and descriptions. Joint publishing is prohibited.
You take full responsibility when you use datasets presented at Dataset Ninja, as well as other information, including visualizations and statistics we provide. You are in charge of compliance with any dataset license and all other permissions. You are required to navigate datasets homepage and make sure that you can use it. In case of any questions, get in touch with us at hello@datasetninja.com.