

Introduction #
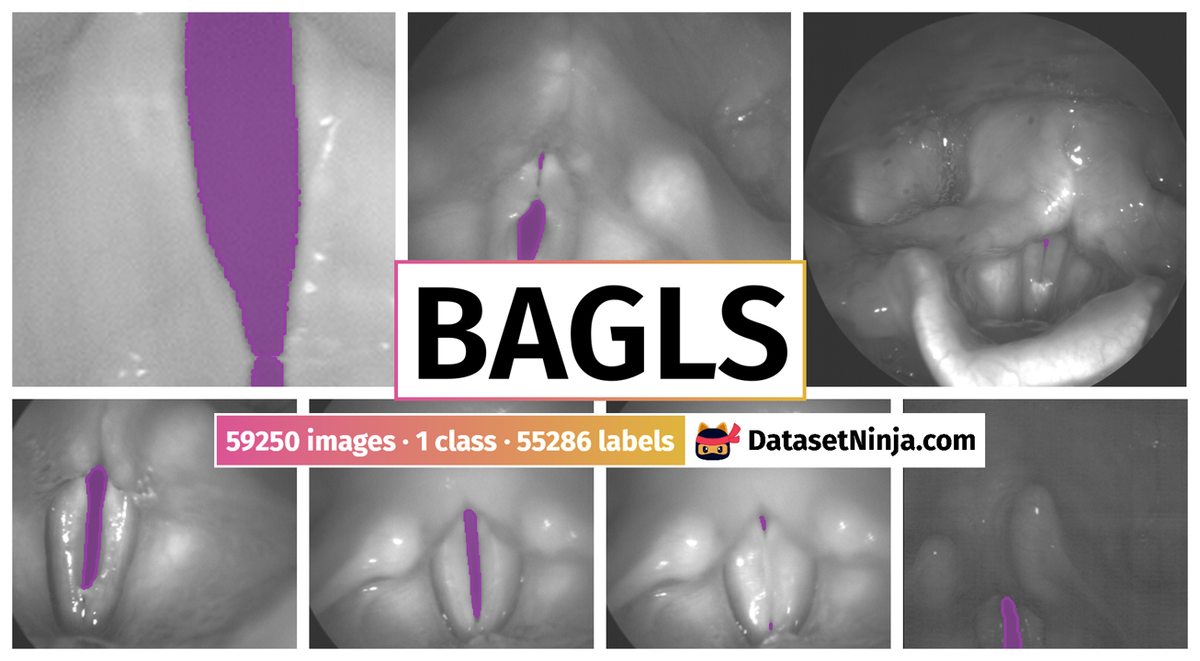
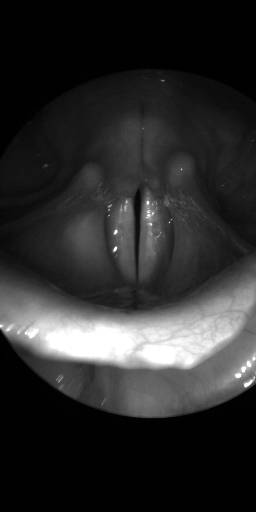
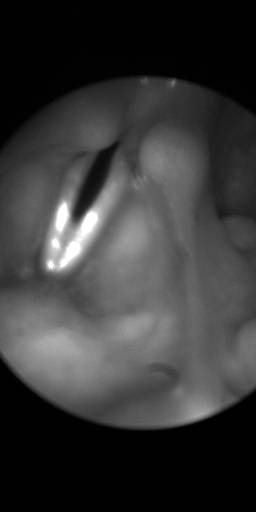
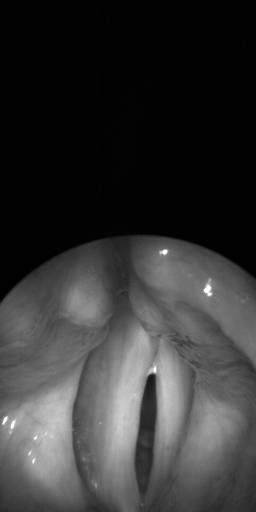
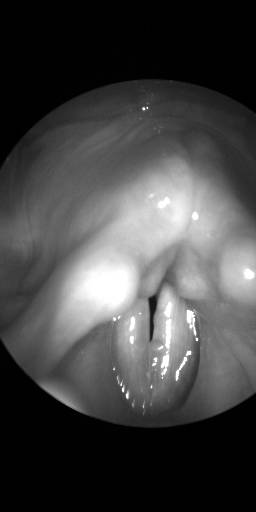
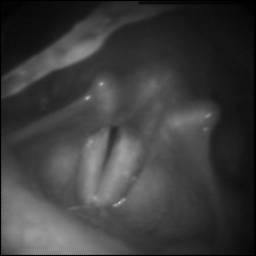
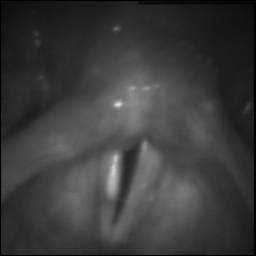
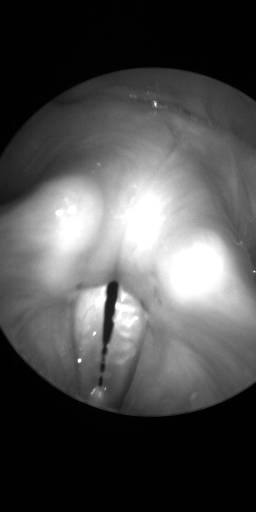
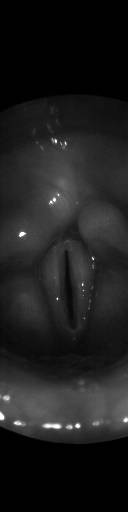
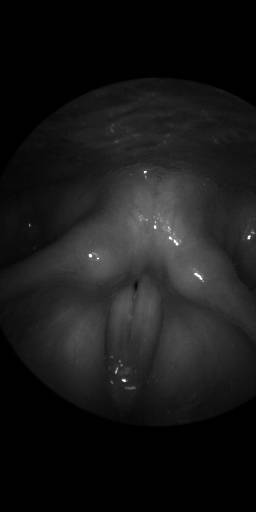
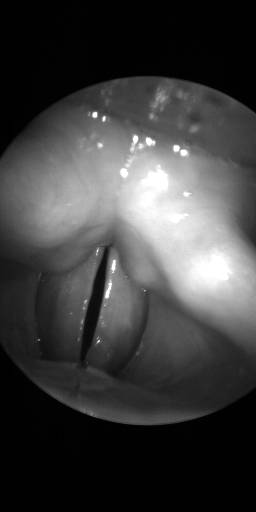
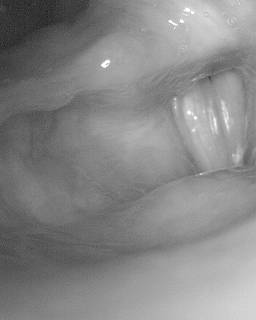
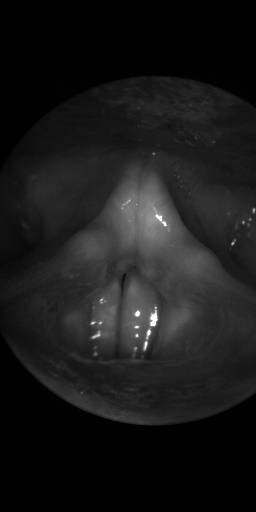
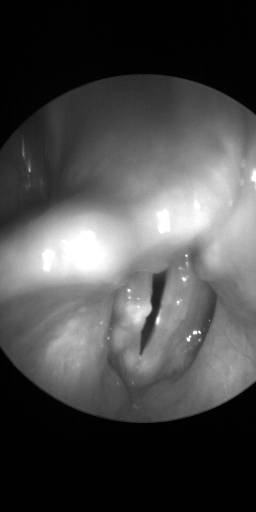
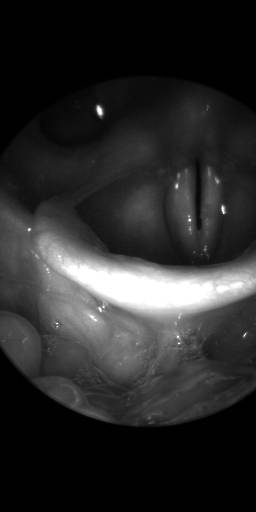
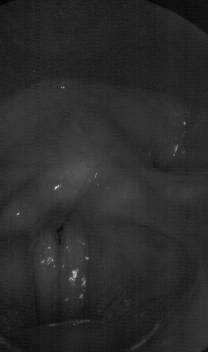
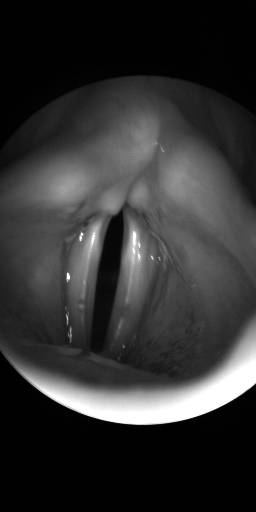
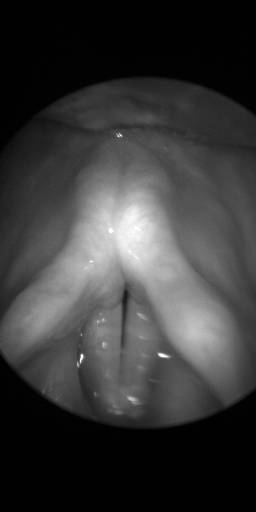
This is an Images part of a BAGLS: Benchmark for Automatic Glottis Segmentation dataset - the first large-scale, publicly available dataset of endoscopic high-speed video with frame-wise segmentation annotations. It has been collected in a collaboration of seven institutions and features a total of 59,250 frames. The BAGLS dataset aims to provide a baseline as robust as possible. Therefore, it was created in such a way that it contains diverse samples from a variety of data sources.
Motivation
Laryngeal videoendoscopy stands as a pivotal component in both clinical evaluations of voice disorders and voice research endeavors. While high-speed videoendoscopy enables comprehensive visualization of vocal fold oscillations, the subsequent processing of these recordings often demands meticulous segmentation of the glottal area by skilled professionals. Despite the introduction of automated techniques and the suitability of the task for deep learning approaches, the absence of publicly available datasets and benchmarks poses a significant challenge. Such resources are crucial for method comparison and facilitating the training of deep learning models capable of generalization.
Dataset acquisition
In a collaborative effort among researchers from seven institutions spanning the EU and USA, the creation of BAGLS a substantial, multi-hospital dataset has come to fruition. This dataset comprises 59,250 high-speed videoendoscopy frames meticulously annotated with segmentation masks. These frames stem from 640 recordings featuring both healthy individuals and those with disorders, captured using varied technical setups by diverse clinicians.
The primary objective of the BAGLS dataset is to facilitate an impartial evaluation of glottis segmentation methodologies, offering interested researchers the opportunity to train models and compare approaches. Emphasizing robustness, the dataset is meticulously curated to encompass diverse samples from a multitude of data sources, meticulously detailed in this section.
Furthermore, segmentation masks for the data were meticulously crafted by a panel of experts employing specially designed software tools. To establish a baseline and validate the benchmark data, the authors conducted training on a state-of-the-art deep learning segmentation network using the BAGLS dataset.
Workflow for creating the BAGLS dataset. Subjects with varying age, gender and health status were examined at different hospitals with differing equipment (camera, light source, endoscope type). The recorded image data is diverse in terms of resolutions and quality. Next, the glottis was segmented using manual or semi-automatic techniques and the segmentation was crosschecked. The segmented videos were split into a training and a test set. The test set features equal amounts of frames from each hospital. The authors validated BAGLS by training a deep neural network and found that it provides segmentations closely matching the manual expert segmentations.
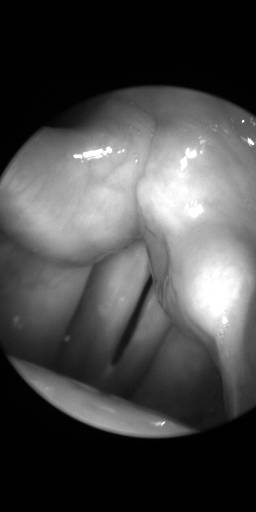
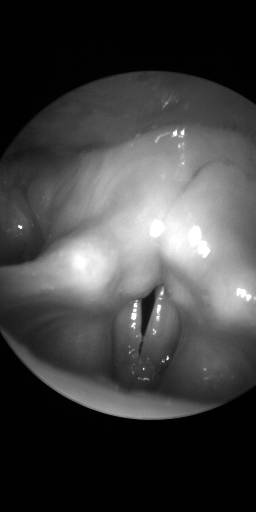
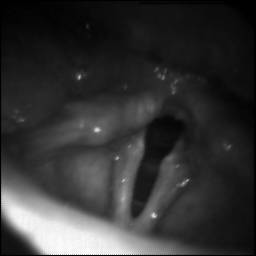
Several imaging techniques have been developed to capture the high-frequency, small-scale oscillations of the vocal folds, with laryngeal endoscopy emerging as a primary diagnostic tool for voice disorders. Among these techniques, videostroboscopy, videokymography, and high-speed videoendoscopy (HSV) are the most prevalent. Clinicians typically review videos obtained through these techniques to aid in diagnosis or to advance research efforts aimed at understanding the phonatory process.
Glottal area segmentation has long been established as a method to quantify vocal fold oscillation and extract additional insights from HSV recordings. Numerous studies have demonstrated significant correlations between various disorders and parameters computed from segmentation data, such as cepstral peak prominence. Common signals derived from glottal segmentation include the glottal area waveform (GAW), vocal fold trajectories, and phonovibrogram. Parameters derived from these signals offer a potential for increased objectivity compared to the subjective metrics still prevalent in clinical practice.
Despite the clear benefits of glottis segmentation, it remains a labor-intensive and time-consuming task that necessitates skilled expertise. And, although the binary segmentation into the classes background and glottal area might seem rather simple, in practice, there are several factors impeding completion of the task:
- Videos often feature a reduced image quality due to the technical requirements of HSV, such as a lower resolution and brief exposure time due to the high sampling rate.
- Videos are often ill-lit, affected by patient movement and artifacts such as reflections caused by mucus and thus require additional image processing.
- Parts of the glottis are often concealed due to the spatial limitations and parts of the anatomy such as the arytenoid cartilages covering others.
- Video quality and features vary noticeably depending on recording setup and subject.
Trained experts anecdotally require about 15 minutes to segment a 1,000 frames long HSV recording using specifcally developed sofware. Therefore, several previous works have explored the possibility of performing an automated segmentation of the glottal area. The BAGLS benchmark dataset will be essential in testing segmentation alhgorithms practical applicability as it:
- Provides the data necessary to train state-of-the-art deep learning methods for the task.
- Allows an objective quantification of the quality of automatic segmentation methods.
- Provides the data diversity necessary to achieve robustness in the clinical routine, where algorithms that are trained on data from one source usually do not perform well on data from another source.
Videoendoscopy is a widely employed imaging modality, and, thus, the differing recording hardware, sofware and varying clinicians introduce great variability to the data. To ensure that an automatic segmentation method actually performs well on the whole range of data, it is essential to also test it on a diverse dataset. This is one of the core motivations of this work and the provided data show a great diversity in the following respects:
- The HSV recordings were collected at seven different institutions from the USA and Europe.
- The data were collected using a variety of cameras, light sources, image resolutions, sampling rates and endoscope types.
- The data contain samples with both healthy and disordered phonation, presenting with both functional and organic dysphonia.
- The dataset is comprised of recordings from all age groups except young children and contains large amounts of samples from male and female subjects.
- The data contain pre-dominantly grayscale, but also color images (RGB).
Data diversity
In the realm of deep learning, essential for cutting-edge segmentation algorithms, the diversity of data holds paramount importance. Trained networks often reflect underlying biases present in the data, posing significant challenges. However, in the context of glottis segmentation, this issue is somewhat mitigated since these methods aren’t intended to yield diagnostic outcomes. Furthermore, any segmentation errors are relatively easy to identify.
Nevertheless, to ensure optimal performance across a wide spectrum of data and to address underrepresented scenarios, it’s imperative to include diverse cases in the dataset. Accordingly, the dataset is meticulously curated to encompass various image acquisition modalities, deliberately avoiding standardization of the acquisition procedure, which naturally differs across hospitals and countries.
To achieve this diversity, the authors collaborated internationally, with each group contributing data that aligns with the diverse clinical and research settings encountered in their respective regions.
| Institution | # in training | # in test |
|---|---|---|
| Boston University | 10 | 10 |
| Louisiana State University | 15 | 10 |
| New York University | 14 | 10 |
| Sint-Augustinus Hospital, Wilrijk | 30 | 10 |
| University of California, Los Angeles | 20 | 10 |
| University Hospital Erlangen | 458 | 10 |
| University Hospital of Munich (LMU) | 23 | 10 |
| Total Number of Videos | 570 | 70 |
| Total Number of Frames | 55750 | 3500 |
Composition of the dataset in relation to origin; the training data featured 50 or 100 frames per video depending on video length and test data 50 frames per video.
As the availability of data differs between groups, it was not possible to balance the training data such that each group is represented equally. The test data, however, is split equally among groups ensuring that a method has to perform well on data from all or most of the institutions to achieve good scores on the benchmark. The authors provide individual frames of the videos that are discontinuous and randomly selected to enhance data diversity as consecutive frames typically show little variation. For each video in the test dataset, 50 frames were randomly selected leading to a total of 3500 frames from 70 videos. For the training data, either 50 or 100 frames (some videos were too short for more than 50 discontinuous frames) were randomly selected and a total of 55750 frames was selected from 570 HSV recordings. The authors provide a detailed breakdown of the provided data in terms of age range, sexes (man, woman) and disorder status to emphasize the data diversity and give a detailed overview of the data. The frames and videos contained in the BAGLS dataset are provided with corresponding metadata.
Age distribution of subjects in the BAGLS dataset.
| Disorder | # of videos | Disorder | # of videos |
|---|---|---|---|
| Healthy | 380 | Contact granuloma | 5 |
| Muscle tension dysphonia | 139 | Paresis | 4 |
| Muscle thyroarythaenoideus atrophy | 25 | Laryngitis | 4 |
| Vocal insufficiency | 18 | Papilloma | 1 |
| Edema | 14 | Leucoplacia | 1 |
| Insufficient glottis closure | 14 | Carcinoma | 1 |
| Nodules | 13 | Other | 8 |
| Polyp | 9 | Unknown status | 50 |
| Cyst | 6 |
Overview of voice disorders represented in the BAGLS dataset, multiple disorders per video are possible.
Overall, the dataset features great variability and diverse representation in terms of age range, sex(man, woman), and disorder status. Furthermore, as it comprises data from seven institutions, a multitude of clinicians were involved in the acquisition of the recordings, which further broadened the diversity of the dataset.
Technical equipment
The dataset exhibits diversity not only in terms of the clinicians and subjects involved but also in the equipment and recording setups utilized across the represented institutions. This diversity extends to a wide range of cameras, light sources, endoscopes, and imaging settings, including sampling rates and image resolutions. Sampling rates vary from 1000Hz to 10000Hz, offering a broad spectrum of temporal resolutions. Likewise, the dataset encompasses a range of image resolutions, with sizes ranging from 256×120 pixels as the smallest to 512×512 pixels as the largest. It’s important to note that the aspect ratios of the images also exhibit variation, further contributing to the dataset’s diversity.
| Sampling rate [Hz] | # of videos | Resolution | # of videos |
|---|---|---|---|
| 1000 | 21 | 256×120 | 15 |
| 2000 | 17 | 256×256 | 88 |
| 3000 | 30 | 288×128 | 7 |
| 4000 | 542 | 320×256 | 33 |
| 5000 | 1 | 352×208 | 30 |
| 6000 | 2 | 352×256 | 11 |
| 8000 | 26 | 512×96 | 1 |
| 10000 | 1 | 512×128 | 22 |
| 512×256 | 431 | ||
| 512×512 | 2 |
Overview of the sampling rates and resolutions of the recorded HSV data in the dataset.
Five different cameras were used for the HSV recordings with three different light sources. The dataset contains recordings acquired with rigid oral endoscopes at an angle of 70° and 90° as well as flexible nasal endoscopes with two diferent diameters. Overall, 618 videos contained grayscale data and 22 featured RGB data.
| Camera | # of videos |
|---|---|
| KayPentax HSV 9700 (Photron) | 16 |
| KayPentax HSV 9710 (Photron) | 495 |
| HERS 5562 Endocam Wolf | 79 |
| Phantom v210 | 30 |
| FASTCAM Mini AX100 540K-C-16GB | 20 |
Overview of cameras used to record the HSV.
| Endoscope type | # of videos | Light source | # of videos |
|---|---|---|---|
| Oral 70° | 543 | Kay Pentax Model 7152B | 491 |
| Oral 90° | 46 | Xenon Light | |
| Nasal 2.4mm | 9 | Wolf 300W Xenon | 79 |
| Nasal 3.5mm | 12 | CUDA Surgical E300 Xenon | 40 |
| N/A | 30 | N/A | 30 |
Overview of the utilized light sources and endoscopes to record the HSV data.
Expert annotations
Three experts in glottis segmentation created the segmentations for the dataset. Previous studies have shown that inter- and intra-rater variability in voice research can be a concern. The BAGLS dataset aims to compensate for this by using segmentations that were crosschecked by multiple experts. The authors further validated these segmentations. Two different software tools were used to ensure a high quality of the segmentation mask, especially in the test data. The detailed segmentation procedure was as follows:
- Videos were inspected to judge which software tool, either the Glottis Analysis Tools (GAT) software or the Pixel-Precise Annotator (PiPrA) software, was appropriate for the segmentation (both are described in the following).
- Each video was segmented by one expert using the selected software.
- After an additional inspection of the video, the segmentation was either refined using the PiPrA software or kept as is.
- After segmentation of all videos, videos were randomly split into test and training sets so that each group contributed ten videos to the test data and the rest to the training data.
- As scores rely on the test data segmentations, they were checked once by another expert and, when necessary, adjustments were made using the PiPrA software.
 Homepage
 Research Paper
 KaggleZenodoGitHub
Summary #
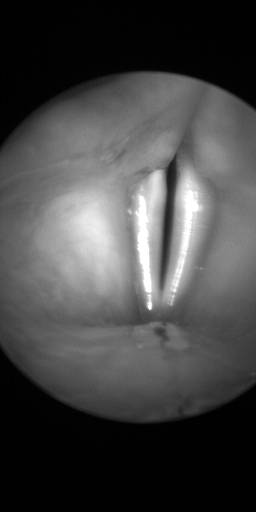
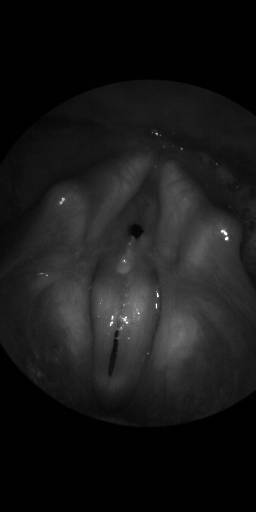
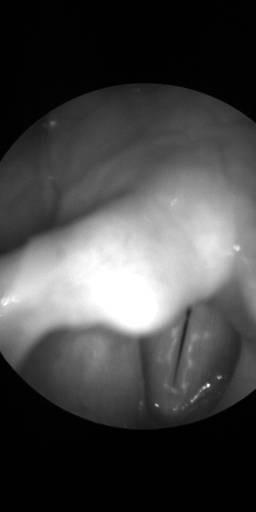
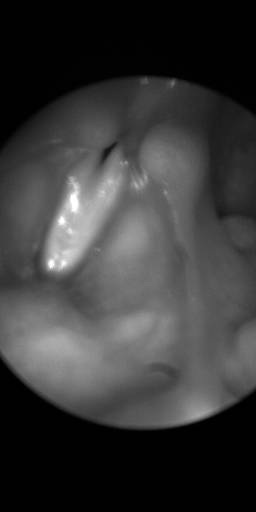
BAGLS: Benchmark for Automatic Glottis Segmentation (Images) is a dataset for semantic segmentation and object detection tasks. It is used in the medical industry.
The dataset consists of 59250 images with 55286 labeled objects belonging to 1 single class (glottis).
Images in the BAGLS: Images dataset have pixel-level semantic segmentation annotations. There are 3964 (7% of the total) unlabeled images (i.e. without annotations). There are 2 splits in the dataset: train (55750 images) and test (3500 images). Alternatively, the dataset could be split into 2 sexes: woman (40600 images) and man (16050 images). Additionally, every image contains information about patients age range, glottis state status. Moreover, every image is tagged with video id. The dataset was released in 2020 by the the GER-US-BEL joint research group.
Explore #
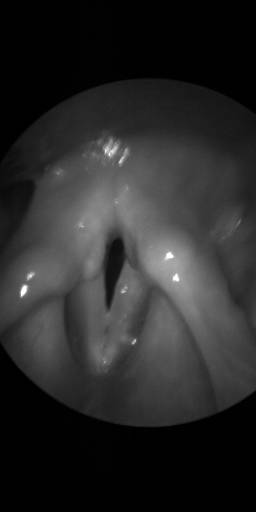
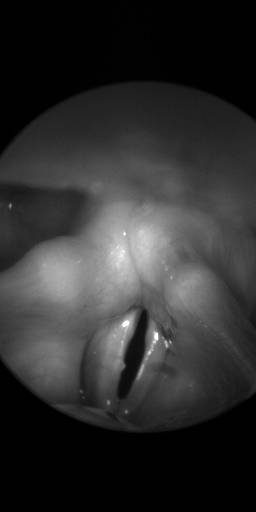
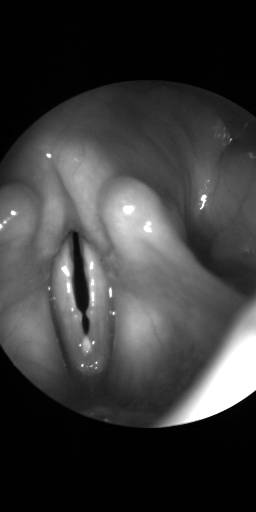
BAGLS: Images dataset has 59250 images. Click on one of the examples below or open "Explore" tool anytime you need to view dataset images with annotations. This tool has extended visualization capabilities like zoom, translation, objects table, custom filters and more. Hover the mouse over the images to hide or show annotations.


Class balance #
There are 1 annotation classes in the dataset. Find the general statistics and balances for every class in the table below. Click any row to preview images that have labels of the selected class. Sort by column to find the most rare or prevalent classes.

Class ㅤ | Images ㅤ | Objects ㅤ | Count on image average | Area on image average |
|---|---|---|---|---|
glottis➔ mask | 55286 | 55286 | 1 | 0.69% |
Images #
Explore every single image in the dataset with respect to the number of annotations of each class it has. Click a row to preview selected image. Sort by any column to find anomalies and edge cases. Use horizontal scroll if the table has many columns for a large number of classes in the dataset.
Object distribution #
Interactive heatmap chart for every class with object distribution shows how many images are in the dataset with a certain number of objects of a specific class. Users can click cell and see the list of all corresponding images.
Class sizes #
The table below gives various size properties of objects for every class. Click a row to see the image with annotations of the selected class. Sort columns to find classes with the smallest or largest objects or understand the size differences between classes.
Class | Object count | Avg area | Max area | Min area | Min height | Min height | Max height | Max height | Avg height | Avg height | Min width | Min width | Max width | Max width |
|---|---|---|---|---|---|---|---|---|---|---|---|---|---|---|
glottis mask | 55286 | 0.69% | 67.63% | 0% | 1px | 0.2% | 260px | 86.72% | 79px | 18.46% | 1px | 0.2% | 173px | 100% |
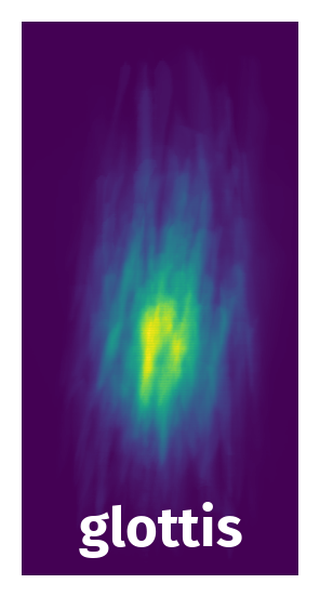
Spatial Heatmap #
The heatmaps below give the spatial distributions of all objects for every class. These visualizations provide insights into the most probable and rare object locations on the image. It helps analyze objects' placements in a dataset.
Objects #
Table contains all 55286 objects. Click a row to preview an image with annotations, and use search or pagination to navigate. Sort columns to find outliers in the dataset.
Object ID ㅤ | Class ㅤ | Image name click row to open | Image size height x width | Height ㅤ | Height ㅤ | Width ㅤ | Width ㅤ | Area ㅤ |
|---|---|---|---|---|---|---|---|---|
1➔ | glottis mask | 7279.png | 512 x 256 | 58px | 11.33% | 7px | 2.73% | 0.17% |
2➔ | glottis mask | 1961.png | 512 x 256 | 20px | 3.91% | 4px | 1.56% | 0.03% |
3➔ | glottis mask | 53567.png | 512 x 256 | 43px | 8.4% | 10px | 3.91% | 0.17% |
4➔ | glottis mask | 38139.png | 512 x 256 | 82px | 16.02% | 25px | 9.77% | 0.39% |
5➔ | glottis mask | 48142.png | 512 x 256 | 39px | 7.62% | 19px | 7.42% | 0.24% |
6➔ | glottis mask | 4452.png | 256 x 256 | 71px | 27.73% | 14px | 5.47% | 0.58% |
7➔ | glottis mask | 15564.png | 512 x 256 | 127px | 24.8% | 28px | 10.94% | 0.37% |
8➔ | glottis mask | 14176.png | 512 x 256 | 92px | 17.97% | 36px | 14.06% | 0.99% |
9➔ | glottis mask | 14767.png | 512 x 256 | 100px | 19.53% | 11px | 4.3% | 0.42% |
10➔ | glottis mask | 3997.png | 512 x 256 | 97px | 18.95% | 23px | 8.98% | 0.44% |
License #
BAGLS: Automatic Glottis Segmentation is under CC BY-NC-SA 4.0 license.
Citation #
If you make use of the Bagls data, please cite the following reference:
@dataset{gomez_2020_3762320,
  author       = {Gómez, Pablo and
                  Kist, Andreas M and
                  Schlegel, Patrick and
                  Berry, David A and
                  Chhetri, Dinesh K and
                  Dürr, Stephan and
                  Echternach, Matthias and
                  Johnson, Aaron M and
                  Kunduk, Melda and
                  Maryin, Youri and
                  Schützenberger, Anne and
                  Verguts, Monique and
                  Döllinger, Michael},
  title        = {{Benchmark for Automatic Glottis Segmentation
                   (BAGLS)}},
  month        = apr,
  year         = 2020,
  publisher    = {Zenodo},
  version      = {1.1a},
  doi          = {10.5281/zenodo.3762320},
  url          = {https://doi.org/10.5281/zenodo.3762320}
}
If you are happy with Dataset Ninja and use provided visualizations and tools in your work, please cite us:
@misc{ visualization-tools-for-bagls-dataset,
  title = { Visualization Tools for BAGLS: Images Dataset },
  type = { Computer Vision Tools },
  author = { Dataset Ninja },
  howpublished = { \url{ https://datasetninja.com/bagls } },
  url = { https://datasetninja.com/bagls },
  journal = { Dataset Ninja },
  publisher = { Dataset Ninja },
  year = { 2026 },
  month = { jul },
  note = { visited on 2026-07-20 },
}
Download #
Dataset BAGLS: Images can be downloaded in Supervisely format:
As an alternative, it can be downloaded with dataset-tools package:
pip install --upgrade dataset-tools
… using following python code:
import dataset_tools as dtools

dtools.download(dataset='BAGLS: Images', dst_dir='~/dataset-ninja/')
Make sure not to overlook the python code example available on the Supervisely Developer Portal. It will give you a clear idea of how to effortlessly work with the downloaded dataset.
The data in original format can be downloaded here.
Disclaimer #
Our gal from the legal dep told us we need to post this:
Dataset Ninja provides visualizations and statistics for some datasets that can be found online and can be downloaded by general audience. Dataset Ninja is not a dataset hosting platform and can only be used for informational purposes. The platform does not claim any rights for the original content, including images, videos, annotations and descriptions. Joint publishing is prohibited.
You take full responsibility when you use datasets presented at Dataset Ninja, as well as other information, including visualizations and statistics we provide. You are in charge of compliance with any dataset license and all other permissions. You are required to navigate datasets homepage and make sure that you can use it. In case of any questions, get in touch with us at hello@datasetninja.com.