Introduction #
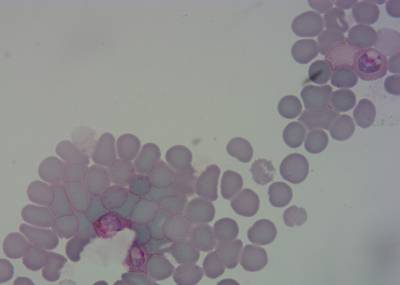
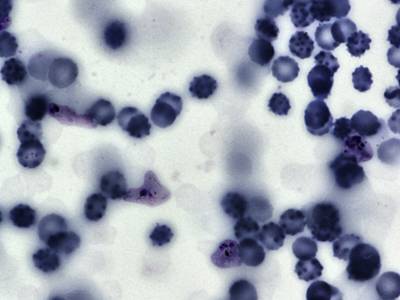
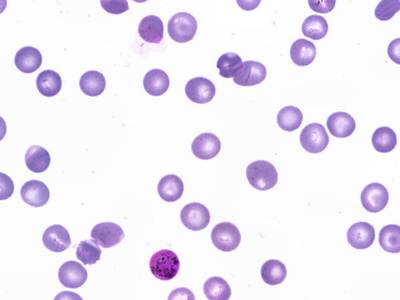
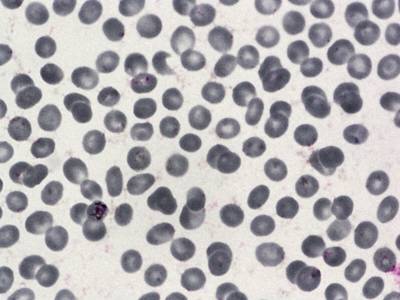
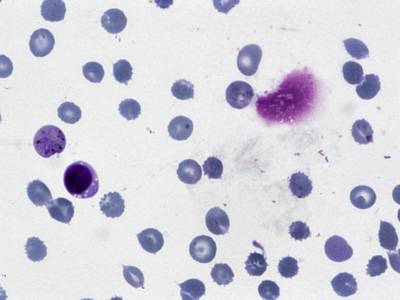
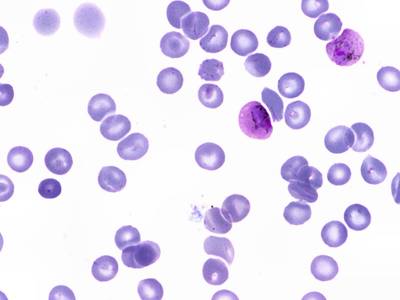
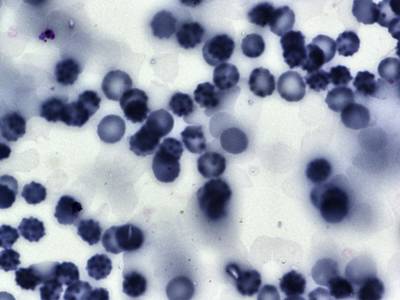
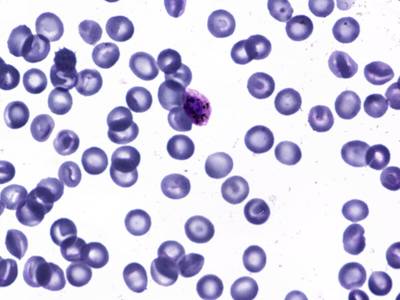
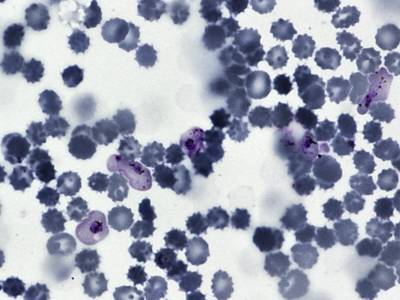
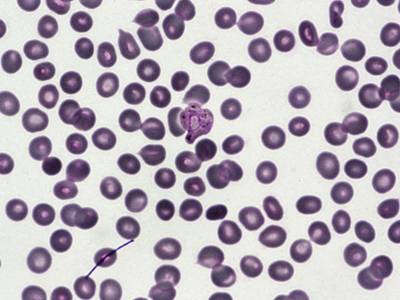
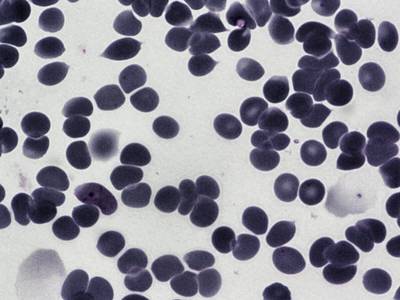
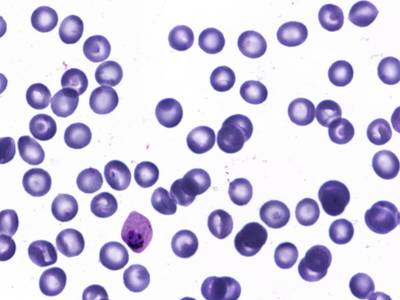
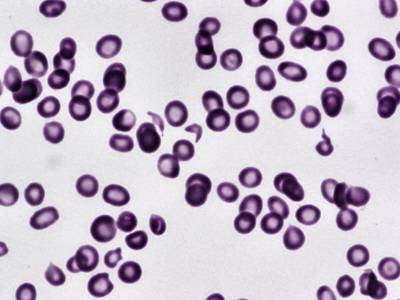
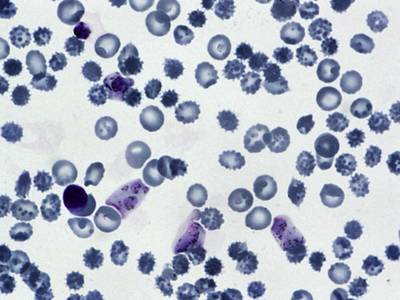
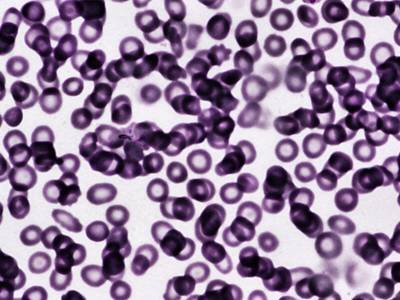
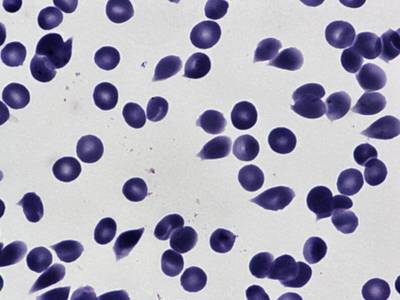
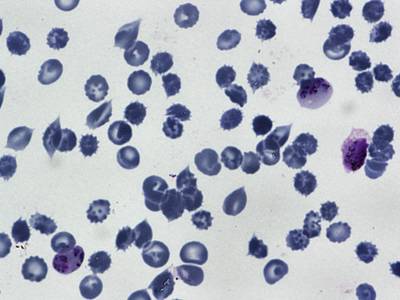
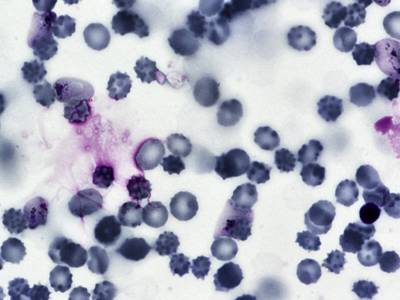
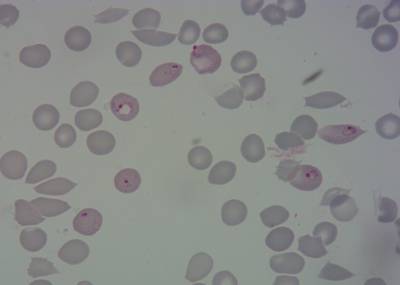
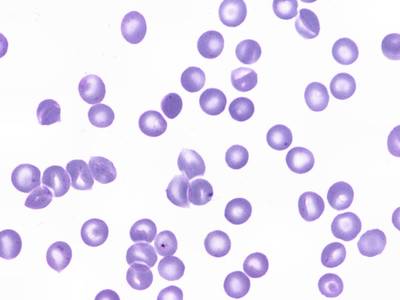
Authors present a large and diverse cell segmentation dataset BBBC041Seg: Automatic Segmentation Of Blood Cells From Microscopic Slides, which consists both of uninfected cells (i.e., red blood cells/RBCs, leukocytes) and infected cells (i.e., gametocytes, rings, trophozoites, and schizonts). With the recent developments in deep learning, automatic cell segmentation from images of microscopic examination slides seems to be a solved problem as recent methods have achieved comparable results on existing benchmark datasets. However, most of the existing cell segmentation benchmark datasets either contain a single cell type, or a few instances of the cells, are not publicly available. Therefore, it is unclear whether the performance improvements can generalize to more diverse datasets.
Additionally, all cell types do not have equal instances, which encourages researchers to develop algorithms for learning from imbalanced classes in a few-shot learning paradigm. Furthermore, the authors conduct a comparative study using both classical rule-based and recent deep learning state-of-the-art (SOTA) methods for automatic cell segmentation and provide them as strong baselines. Authors believe the introduction of BBBC041Seg will promote future research towards clinically applicable cell segmentation methods from microscopic examinations, which can be later used for downstream tasks such as detecting hematological diseases (i.e., malaria).
BBC041Seg consists of ground truth masks of different cell types from more than 1300 microscopic exam slides. Authors provide annotated masks as ground truths for images taken from the BBBC041v1 dataset (Ljosa et al., 2012), which is a publicly available object detection dataset. Furthermore, the authors also conduct a benchmark study using the BBC041Seg dataset leveraging both non-learning rules-based methods and recent deep learning-based state-of-the-art (SOTA) methods for automatic cell segmentation. The contribution of this paper can be summarized as follows.
-
Authors prepare and introduce BBBC041Seg, a cell segmentation dataset consisting of 1300+ images from BBBC041v1, and their cell segmentation masks as ground truth labels, which is significantly larger and more diverse than existing benchmark datasets.
-
Authors perform a series of controlled experiments by implementing both classical rule-based and deep learning state-of-the-art approaches and provide a comparative analysis using the proposed dataset.
-
Authors make the dataset publicly available to provide a platform for researchers to focus more on generalized cell segmentation methods that are more clinically acceptable. A dataset is available at GitHub.
A total of 1328 images are available. Out of that, Jeet B Lahiri separated the train and test sets with 1169 images and 159 images respectively.
Summary #
BBBC041Seg: Automatic Segmentation Of Blood Cells From Microscopic Slides is a dataset for instance segmentation, semantic segmentation, and object detection tasks. Possible applications of the dataset could be in the medical industry and biomedical research.
The dataset consists of 1328 images with 93539 labeled objects belonging to 1 single class (blood_cell).
Images in the BBBC041Seg dataset have pixel-level instance segmentation annotations. Due to the nature of the instance segmentation task, it can be automatically transformed into a semantic segmentation (only one mask for every class) or object detection (bounding boxes for every object) tasks. All images are labeled (i.e. with annotations). There are 2 splits in the dataset: train (1169 images) and test (159 images). The dataset was released in 2021 by the North South University, Concordia University, and Bangladesh University of Engineering and Technology.

Explore #
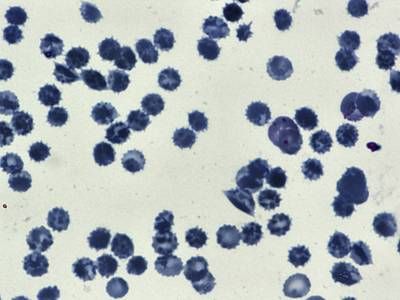
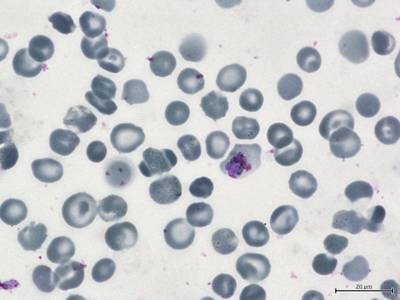
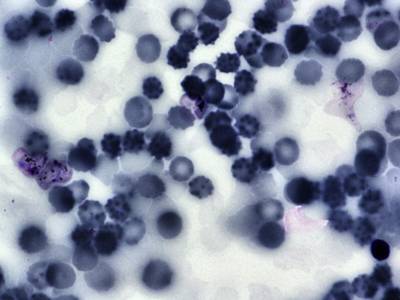
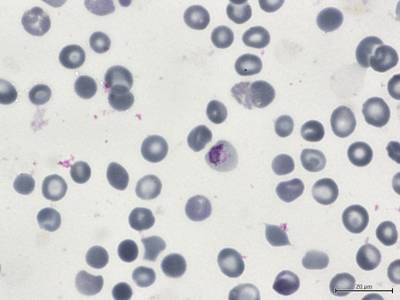
BBBC041Seg dataset has 1328 images. Click on one of the examples below or open "Explore" tool anytime you need to view dataset images with annotations. This tool has extended visualization capabilities like zoom, translation, objects table, custom filters and more. Hover the mouse over the images to hide or show annotations.


























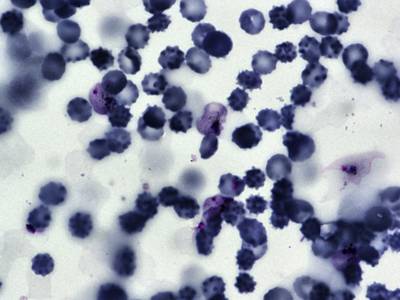

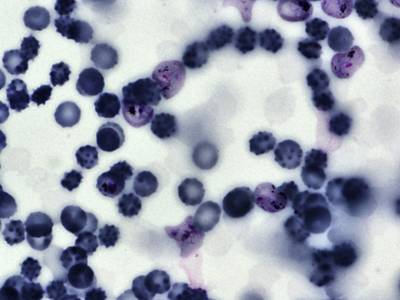


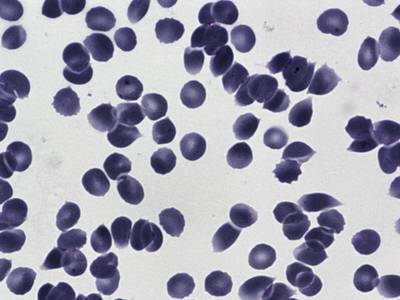

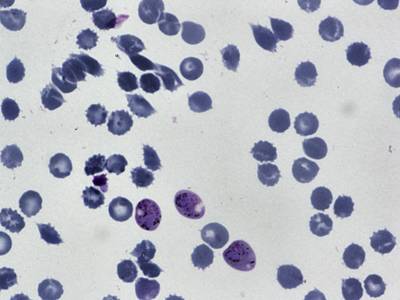
Class balance #
There are 1 annotation classes in the dataset. Find the general statistics and balances for every class in the table below. Click any row to preview images that have labels of the selected class. Sort by column to find the most rare or prevalent classes.
Class ㅤ | Images ㅤ | Objects ㅤ | Count on image average | Area on image average |
|---|---|---|---|---|
blood_cell➔ mask | 1328 | 93539 | 70.44 | 29.4% |
Images #
Explore every single image in the dataset with respect to the number of annotations of each class it has. Click a row to preview selected image. Sort by any column to find anomalies and edge cases. Use horizontal scroll if the table has many columns for a large number of classes in the dataset.
Class sizes #
The table below gives various size properties of objects for every class. Click a row to see the image with annotations of the selected class. Sort columns to find classes with the smallest or largest objects or understand the size differences between classes.
Class | Object count | Avg area | Max area | Min area | Min height | Min height | Max height | Max height | Avg height | Avg height | Min width | Min width | Max width | Max width |
|---|---|---|---|---|---|---|---|---|---|---|---|---|---|---|
blood_cell mask | 93539 | 0.42% | 4.67% | 0% | 17px | 1.3% | 631px | 52.58% | 105px | 8.65% | 3px | 0.19% | 474px | 29.62% |
Spatial Heatmap #
The heatmaps below give the spatial distributions of all objects for every class. These visualizations provide insights into the most probable and rare object locations on the image. It helps analyze objects' placements in a dataset.

Objects #
Table contains all 93539 objects. Click a row to preview an image with annotations, and use search or pagination to navigate. Sort columns to find outliers in the dataset.
Object ID ㅤ | Class ㅤ | Image name click row to open | Image size height x width | Height ㅤ | Height ㅤ | Width ㅤ | Width ㅤ | Area ㅤ |
|---|---|---|---|---|---|---|---|---|
1➔ | blood_cell mask | f6ab936d-924b-4038-aa47-71b07c26b4e2.png | 1200 x 1600 | 53px | 4.42% | 112px | 7% | 0.23% |
2➔ | blood_cell mask | f6ab936d-924b-4038-aa47-71b07c26b4e2.png | 1200 x 1600 | 69px | 5.75% | 116px | 7.25% | 0.35% |
3➔ | blood_cell mask | f6ab936d-924b-4038-aa47-71b07c26b4e2.png | 1200 x 1600 | 137px | 11.42% | 127px | 7.94% | 0.66% |
4➔ | blood_cell mask | f6ab936d-924b-4038-aa47-71b07c26b4e2.png | 1200 x 1600 | 75px | 6.25% | 103px | 6.44% | 0.33% |
5➔ | blood_cell mask | f6ab936d-924b-4038-aa47-71b07c26b4e2.png | 1200 x 1600 | 129px | 10.75% | 110px | 6.88% | 0.55% |
6➔ | blood_cell mask | f6ab936d-924b-4038-aa47-71b07c26b4e2.png | 1200 x 1600 | 102px | 8.5% | 122px | 7.62% | 0.36% |
7➔ | blood_cell mask | f6ab936d-924b-4038-aa47-71b07c26b4e2.png | 1200 x 1600 | 119px | 9.92% | 107px | 6.69% | 0.41% |
8➔ | blood_cell mask | f6ab936d-924b-4038-aa47-71b07c26b4e2.png | 1200 x 1600 | 70px | 5.83% | 107px | 6.69% | 0.28% |
9➔ | blood_cell mask | f6ab936d-924b-4038-aa47-71b07c26b4e2.png | 1200 x 1600 | 109px | 9.08% | 106px | 6.62% | 0.44% |
10➔ | blood_cell mask | f6ab936d-924b-4038-aa47-71b07c26b4e2.png | 1200 x 1600 | 93px | 7.75% | 114px | 7.12% | 0.44% |
License #
Citation #
If you make use of the BBBC041Seg data, please cite the following reference:
@article{DEPTO2021101653,
  title = {Automatic segmentation of blood cells from microscopic slides: A comparative analysis},
  journal = {Tissue and Cell},
  volume = {73},
  pages = {101653},
  year = {2021},
  issn = {0040-8166},
  doi = {https://doi.org/10.1016/j.tice.2021.101653},
  url = {https://www.sciencedirect.com/science/article/pii/S0040816621001695},
  author = {Deponker Sarker Depto and Shazidur Rahman and Md. Mekayel Hosen and Mst Shapna Akter and Tamanna Rahman Reme and Aimon Rahman and Hasib Zunair and M. Sohel Rahman and M.R.C. Mahdy}
}
If you are happy with Dataset Ninja and use provided visualizations and tools in your work, please cite us:
@misc{ visualization-tools-for-blood-cell-segmentation-dataset,
  title = { Visualization Tools for BBBC041Seg Dataset },
  type = { Computer Vision Tools },
  author = { Dataset Ninja },
  howpublished = { \url{ https://datasetninja.com/blood-cell-segmentation } },
  url = { https://datasetninja.com/blood-cell-segmentation },
  journal = { Dataset Ninja },
  publisher = { Dataset Ninja },
  year = { 2026 },
  month = { feb },
  note = { visited on 2026-02-20 },
}
Download #
Dataset BBBC041Seg can be downloaded in Supervisely format:
As an alternative, it can be downloaded with dataset-tools package:
pip install --upgrade dataset-tools
… using following python code:
import dataset_tools as dtools

dtools.download(dataset='BBBC041Seg', dst_dir='~/dataset-ninja/')
Make sure not to overlook the python code example available on the Supervisely Developer Portal. It will give you a clear idea of how to effortlessly work with the downloaded dataset.
The data in original format can be downloaded here.
Disclaimer #
Our gal from the legal dep told us we need to post this:
Dataset Ninja provides visualizations and statistics for some datasets that can be found online and can be downloaded by general audience. Dataset Ninja is not a dataset hosting platform and can only be used for informational purposes. The platform does not claim any rights for the original content, including images, videos, annotations and descriptions. Joint publishing is prohibited.
You take full responsibility when you use datasets presented at Dataset Ninja, as well as other information, including visualizations and statistics we provide. You are in charge of compliance with any dataset license and all other permissions. You are required to navigate datasets homepage and make sure that you can use it. In case of any questions, get in touch with us at hello@datasetninja.com.


