

Introduction #
The authors of the BTAD: beanTech Anomaly Detection dataset introduce a novel transformer-based image anomaly detection and localization network VT-ADL. The BTAD dataset comprises real-world industrial anomaly data and consists of RGB images depicting three distinct industrial products. product_1 features images with dimensions of 1600×1600 pixels, product_2 with 600×600 pixels, and product_3 with 800 × 600 pixels. Training data for Products 1, 2, and 3 comprises 400, 1000, and 399 images, respectively. During training, all images are initially scaled to a size of 512 pixels. For each anomalous image, a pixel-wise ground truth mask is meticulously provided.
In the realm of computer vision, anomalies refer to any image or image segment that exhibits significant deviations from predefined normal characteristics. Anomaly detection involves identifying these novel samples, either through supervised or unsupervised methods. There is a considerable demand for intelligent anomaly detection systems, given their wide-ranging applications, spanning from video surveillance and defect segmentation to quality control, medical imaging, and financial transaction monitoring. Notably, anomaly detection holds particular significance in the industrial sector, where it can facilitate the automated identification of defective products.
 Homepage
 Research Paper
 Kaggle
Summary #
BTAD: beanTech Anomaly Detection Dataset is a dataset for instance segmentation, semantic segmentation, object detection, and semi supervised learning tasks. It is used in the manufacturing industry, and in the anomaly detection research.
The dataset consists of 2540 images with 691 labeled objects belonging to 3 different classes including product_2, product_1, and product_3.
Images in the BTAD dataset have pixel-level instance segmentation annotations. Due to the nature of the instance segmentation task, it can be automatically transformed into a semantic segmentation (only one mask for every class) or object detection (bounding boxes for every object) tasks. There are 2261 (89% of the total) unlabeled images (i.e. without annotations). There are 2 splits in the dataset: train (1799 images) and test (741 images). Alternatively, the dataset could be split into 2 image sets: ok (2250 images) and ko (290 images). The dataset was released in 2021 by the beanTech, Italy and University of Udine, Italy.
Explore #
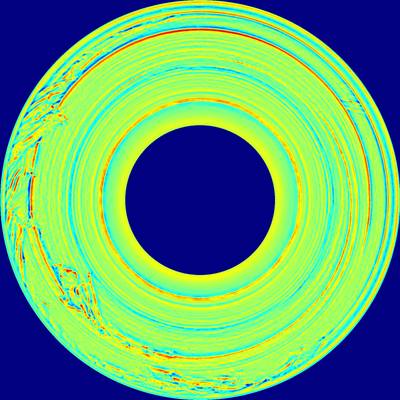
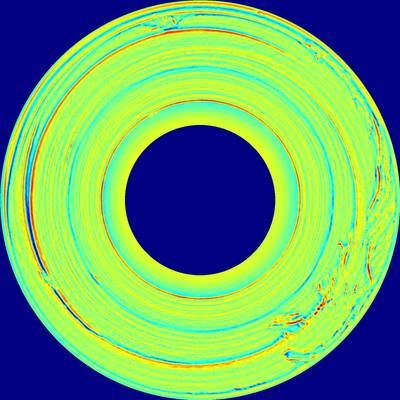
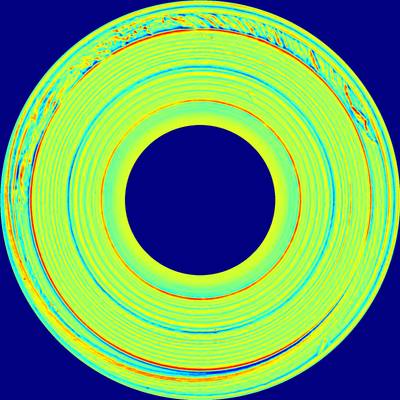
BTAD dataset has 2540 images. Click on one of the examples below or open "Explore" tool anytime you need to view dataset images with annotations. This tool has extended visualization capabilities like zoom, translation, objects table, custom filters and more. Hover the mouse over the images to hide or show annotations.


Class balance #
There are 3 annotation classes in the dataset. Find the general statistics and balances for every class in the table below. Click any row to preview images that have labels of the selected class. Sort by column to find the most rare or prevalent classes.

Class ㅤ | Images ㅤ | Objects ㅤ | Count on image average | Area on image average |
|---|---|---|---|---|
product_2➔ mask | 199 | 496 | 2.49 | 6.32% |
product_1➔ mask | 49 | 161 | 3.29 | 4.65% |
product_3➔ mask | 31 | 34 | 1.1 | 2.94% |
Co-occurrence matrix #
Co-occurrence matrix is an extremely valuable tool that shows you the images for every pair of classes: how many images have objects of both classes at the same time. If you click any cell, you will see those images. We added the tooltip with an explanation for every cell for your convenience, just hover the mouse over a cell to preview the description.
Images #
Explore every single image in the dataset with respect to the number of annotations of each class it has. Click a row to preview selected image. Sort by any column to find anomalies and edge cases. Use horizontal scroll if the table has many columns for a large number of classes in the dataset.
Object distribution #
Interactive heatmap chart for every class with object distribution shows how many images are in the dataset with a certain number of objects of a specific class. Users can click cell and see the list of all corresponding images.
Class sizes #
The table below gives various size properties of objects for every class. Click a row to see the image with annotations of the selected class. Sort columns to find classes with the smallest or largest objects or understand the size differences between classes.
Class | Object count | Avg area | Max area | Min area | Min height | Min height | Max height | Max height | Avg height | Avg height | Min width | Min width | Max width | Max width |
|---|---|---|---|---|---|---|---|---|---|---|---|---|---|---|
product_2 mask | 496 | 2.53% | 66.73% | 0.02% | 2px | 0.33% | 596px | 99.33% | 47px | 7.75% | 36px | 6% | 580px | 96.67% |
product_1 mask | 161 | 1.42% | 13.39% | 0% | 11px | 0.69% | 1600px | 100% | 322px | 20.09% | 1px | 0.06% | 1548px | 96.75% |
product_3 mask | 34 | 2.68% | 13.16% | 0.11% | 17px | 2.83% | 392px | 65.33% | 154px | 25.64% | 33px | 4.12% | 604px | 75.5% |
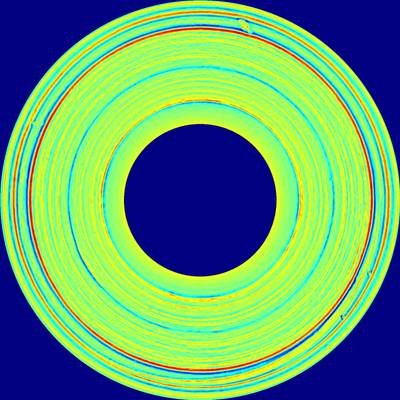
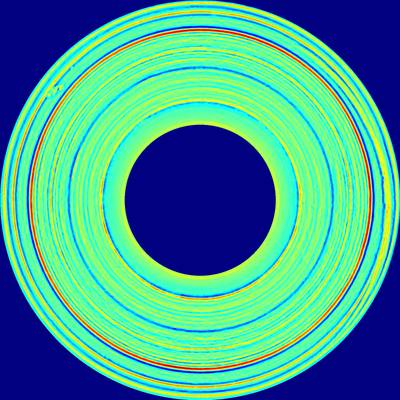
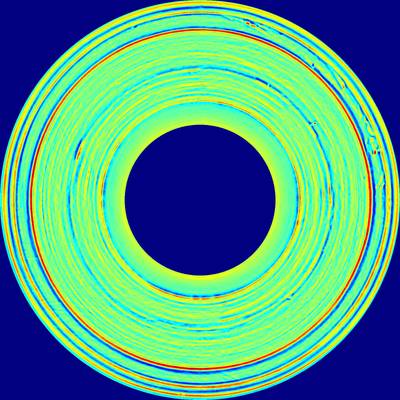
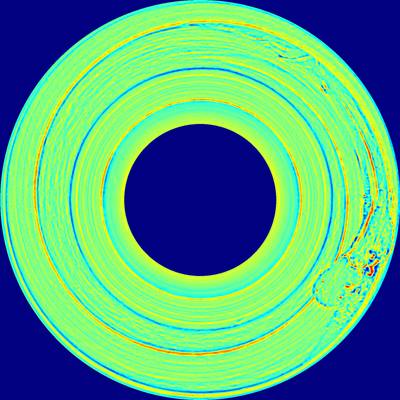
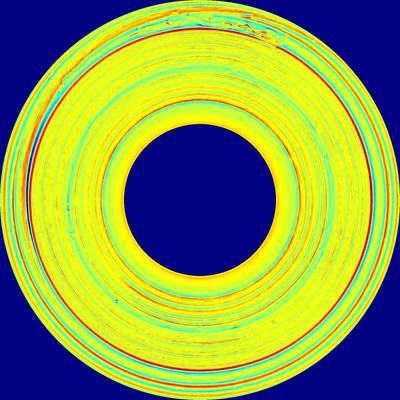
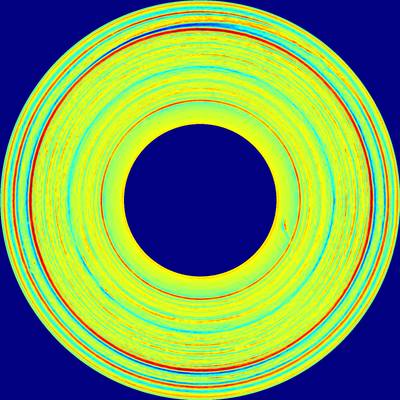
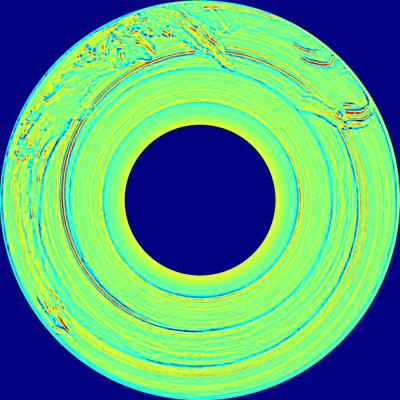
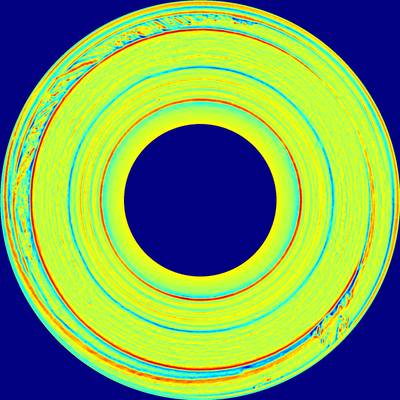
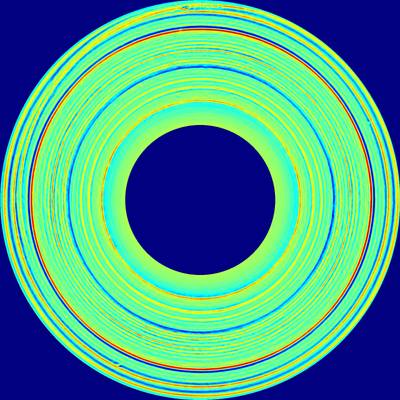
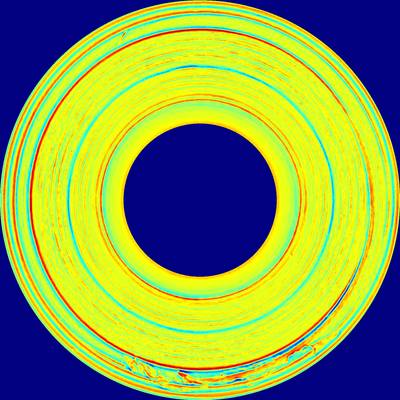
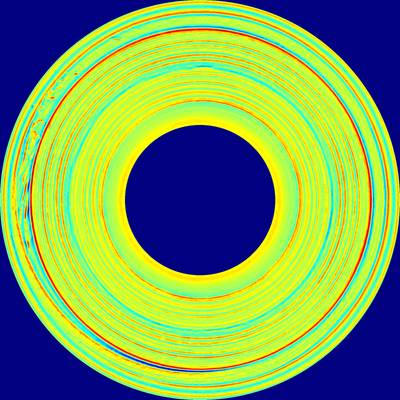
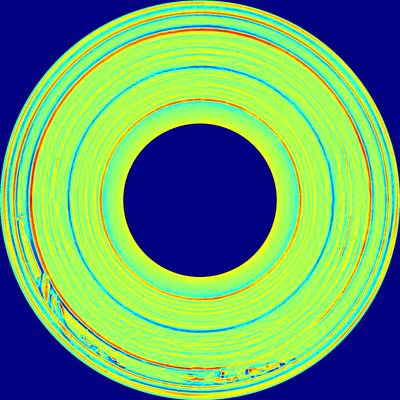
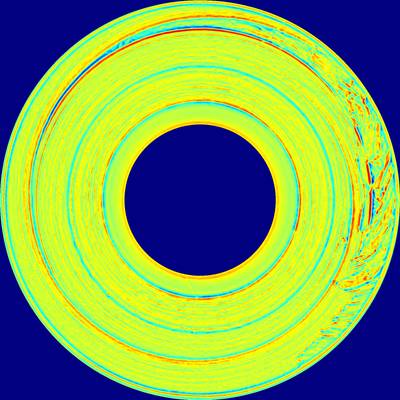
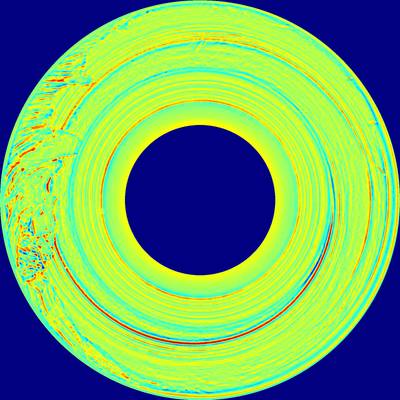
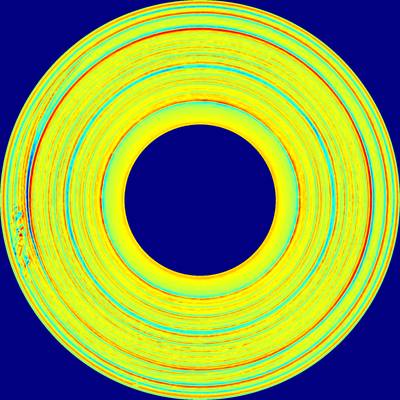
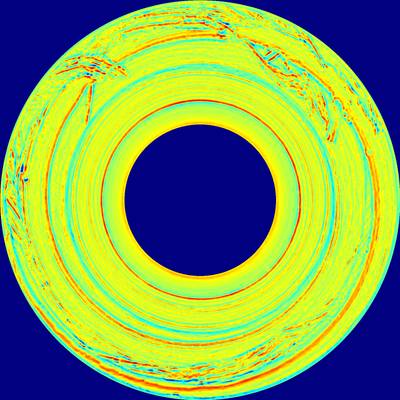
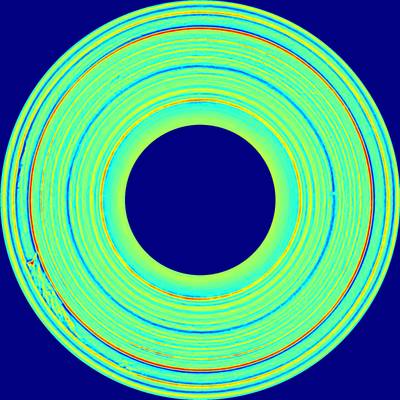
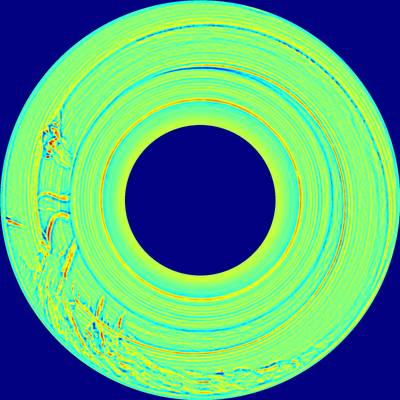
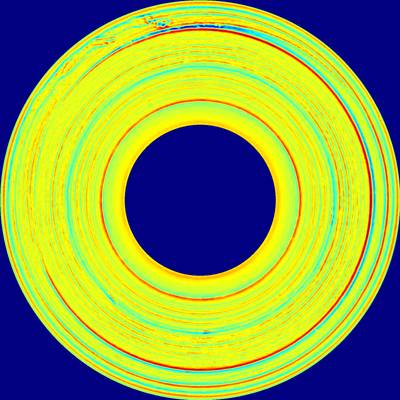
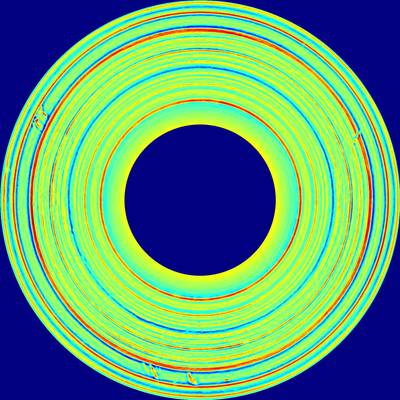
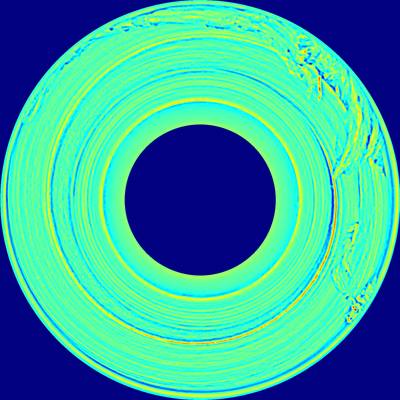
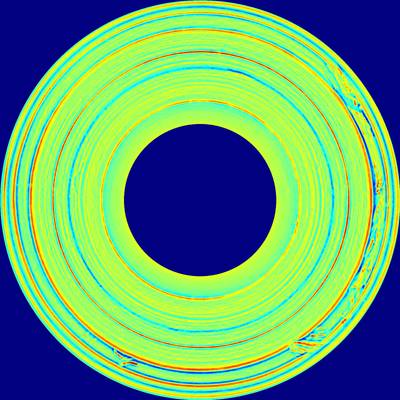
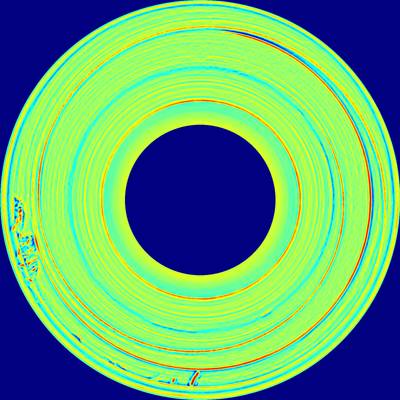
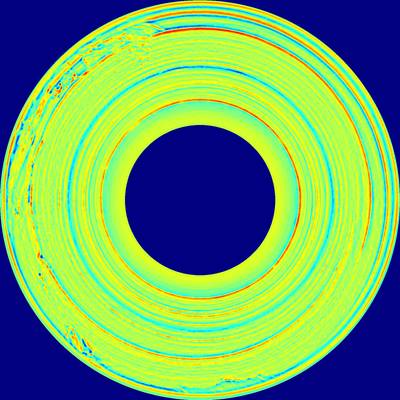
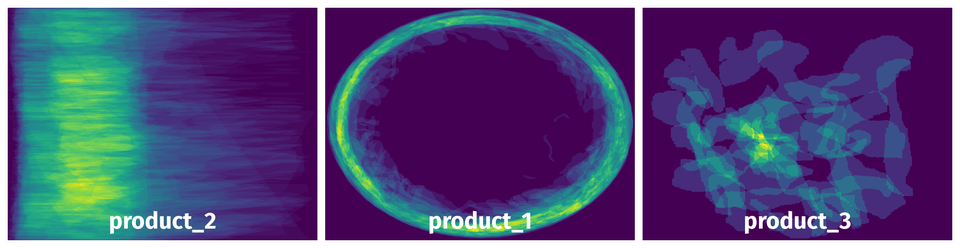
Spatial Heatmap #
The heatmaps below give the spatial distributions of all objects for every class. These visualizations provide insights into the most probable and rare object locations on the image. It helps analyze objects' placements in a dataset.
Objects #
Table contains all 691 objects. Click a row to preview an image with annotations, and use search or pagination to navigate. Sort columns to find outliers in the dataset.
Object ID ㅤ | Class ㅤ | Image name click row to open | Image size height x width | Height ㅤ | Height ㅤ | Width ㅤ | Width ㅤ | Area ㅤ |
|---|---|---|---|---|---|---|---|---|
1➔ | product_1 mask | 01_ko_0034.bmp | 1600 x 1600 | 360px | 22.5% | 230px | 14.38% | 0.68% |
2➔ | product_1 mask | 01_ko_0034.bmp | 1600 x 1600 | 48px | 3% | 72px | 4.5% | 0.07% |
3➔ | product_2 mask | 02_ko_0088.png | 600 x 600 | 6px | 1% | 74px | 12.33% | 0.1% |
4➔ | product_2 mask | 02_ko_0003.png | 600 x 600 | 149px | 24.83% | 155px | 25.83% | 2.75% |
5➔ | product_2 mask | 02_ko_0003.png | 600 x 600 | 11px | 1.83% | 139px | 23.17% | 0.24% |
6➔ | product_2 mask | 02_ko_0194.png | 600 x 600 | 21px | 3.5% | 169px | 28.17% | 0.68% |
7➔ | product_2 mask | 02_ko_0194.png | 600 x 600 | 122px | 20.33% | 235px | 39.17% | 5.73% |
8➔ | product_2 mask | 02_ko_0136.png | 600 x 600 | 6px | 1% | 84px | 14% | 0.11% |
9➔ | product_1 mask | 01_ko_0007.bmp | 1600 x 1600 | 1271px | 79.44% | 1002px | 62.62% | 3.62% |
10➔ | product_1 mask | 01_ko_0007.bmp | 1600 x 1600 | 181px | 11.31% | 164px | 10.25% | 0.2% |
License #
BTAD: beanTech Anomaly Detection Dataset is under CC BY-SA 4.0 license.
Citation #
If you make use of the BTAD data, please cite the following reference:
@inproceedings{
  mishra21-vt-adl,
  author = {Mishra, Pankaj and Verk, Riccardo and Fornasier, Daniele and Piciarelli, Claudio and Foresti, Gian Luca},
  title = {{VT-ADL}: A Vision Transformer Network for Image Anomaly Detection and Localization},
  booktitle = {30th IEEE/IES International Symposium on Industrial Electronics (ISIE)},
  year = {2021},
  month = {June},
  location = {Kyoto, Japan}
}
If you are happy with Dataset Ninja and use provided visualizations and tools in your work, please cite us:
@misc{ visualization-tools-for-btad-dataset,
  title = { Visualization Tools for BTAD Dataset },
  type = { Computer Vision Tools },
  author = { Dataset Ninja },
  howpublished = { \url{ https://datasetninja.com/btad } },
  url = { https://datasetninja.com/btad },
  journal = { Dataset Ninja },
  publisher = { Dataset Ninja },
  year = { 2026 },
  month = { jul },
  note = { visited on 2026-07-16 },
}
Download #
Dataset BTAD can be downloaded in Supervisely format:
As an alternative, it can be downloaded with dataset-tools package:
pip install --upgrade dataset-tools
… using following python code:
import dataset_tools as dtools

dtools.download(dataset='BTAD', dst_dir='~/dataset-ninja/')
Make sure not to overlook the python code example available on the Supervisely Developer Portal. It will give you a clear idea of how to effortlessly work with the downloaded dataset.
The data in original format can be downloaded here.
Disclaimer #
Our gal from the legal dep told us we need to post this:
Dataset Ninja provides visualizations and statistics for some datasets that can be found online and can be downloaded by general audience. Dataset Ninja is not a dataset hosting platform and can only be used for informational purposes. The platform does not claim any rights for the original content, including images, videos, annotations and descriptions. Joint publishing is prohibited.
You take full responsibility when you use datasets presented at Dataset Ninja, as well as other information, including visualizations and statistics we provide. You are in charge of compliance with any dataset license and all other permissions. You are required to navigate datasets homepage and make sure that you can use it. In case of any questions, get in touch with us at hello@datasetninja.com.