
Introduction #
The BUP20: Sweet Pepper Dataset was captured at the University of Bonn’s campus Klein-Altendorf (CKA) in a commercial glasshouse. The authors propose a novel field agnostic monitoring technique that is able to operate on two different robots, in arable farmland or a glasshouse (horticultural setting). Instance segmentation forms the backbone of this approach from which object location and class, object area, and yield information can be obtained.
Note, similar BUP20: Sweet Pepper Dataset datasets are also available on the DatasetNinja.com:
Motivation
Farmers require a wealth of diverse and intricate information to make informed agronomic decisions related to crop management, including intervention tasks. Traditionally, this information is gathered by farmers traversing their fields or greenhouses, a process that is often time-consuming and potentially expensive. In recent years, there has been a notable surge in the adoption of robotic platforms, driven by advancements in artificial intelligence. However, these platforms are typically specialized for specific settings, such as arable farmland, or their algorithms are tailored to a singular platform, resulting in a substantial gap between existing technology and the needs of farmers.
In the realm of agricultural automation, researchers have primarily utilized broad inputs like temperature, lighting, and CO2, which serve as inputs to AI-based approaches controlling outputs like lighting and nutrients for the crop. However, there is a clear opportunity for improvement by providing more frequent and detailed inputs regarding the crop’s condition.
From the perspective of stakeholders, namely farmers, monitoring plants and their ecosystem is pivotal for making well-informed management decisions. In the absence of robotics or automation, farmers must physically inspect their farms multiple times, paying close attention to critical indicators such as crop or fruit count, as well as the presence of weeds, pests, or diseases. Robotic platforms have the potential to both automate and enhance these observations, undertaking repetitive tasks with a high degree of precision.
The agnostic monitoring algorithm provides up-to-date information to the farmer based on instance segmentation with ripeness or species information and area estimation. This assists in making more informed management decisions such as weeding or harvesting using a tracking-via-segmentation approach for yield estimation. The approach is evaluated on two robotic platforms PATHoBot (LEFT) and BonnBot-I (RIGHT) which work in significantly different environments: glasshouse or arable fields. Area estimation values are in m2.
Dataset description
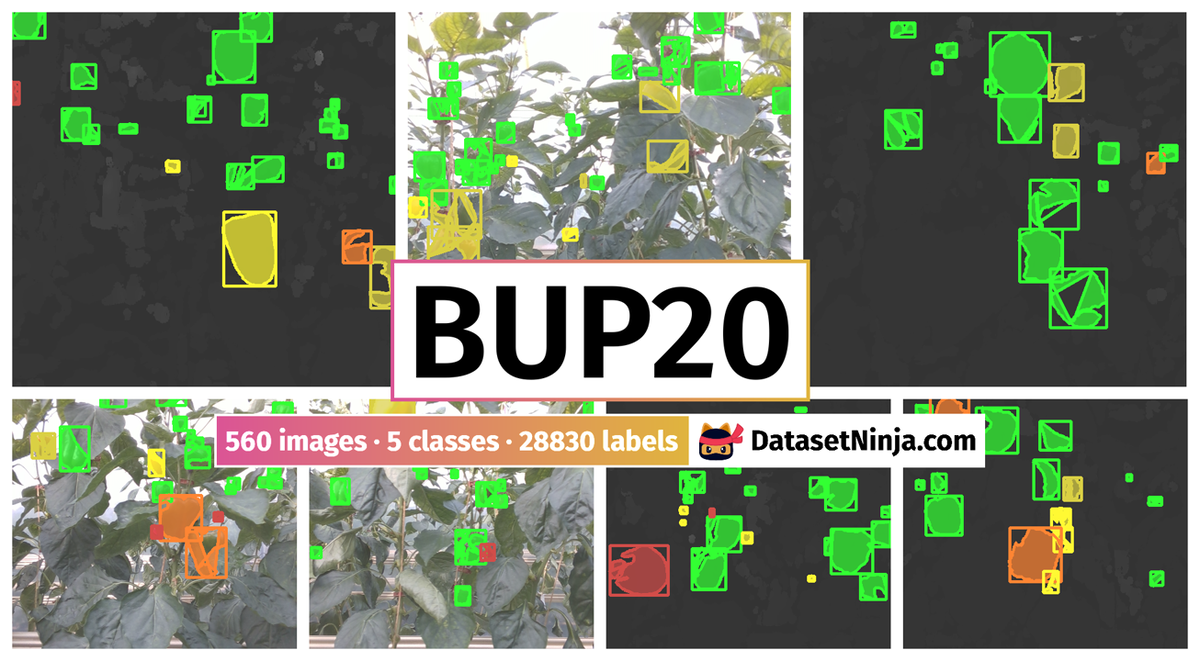
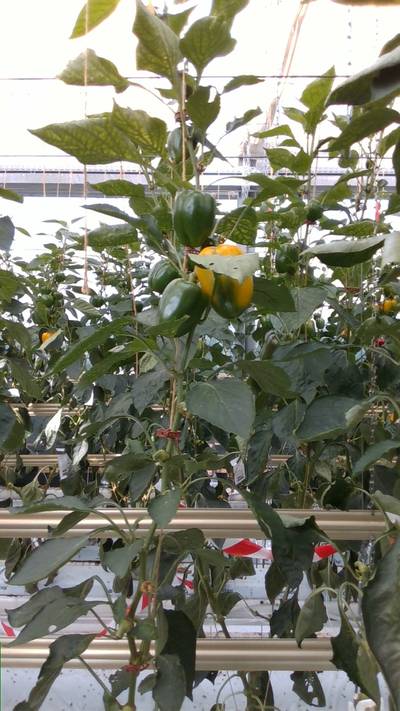
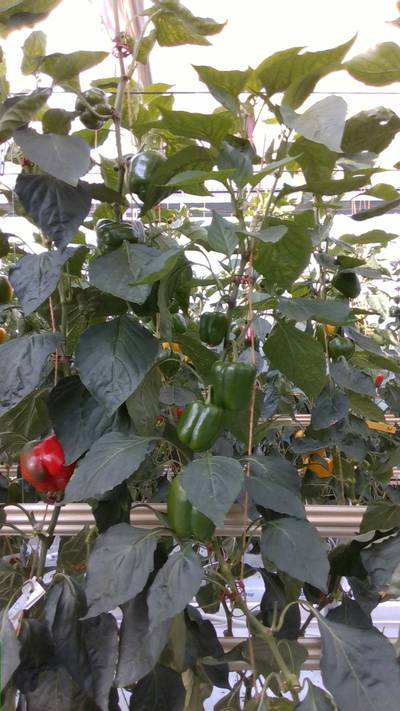
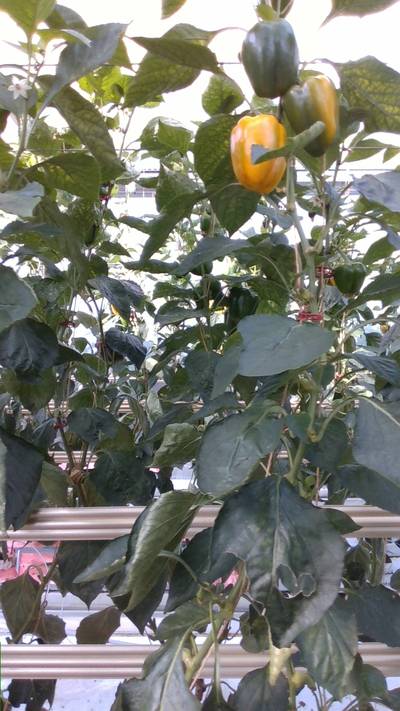
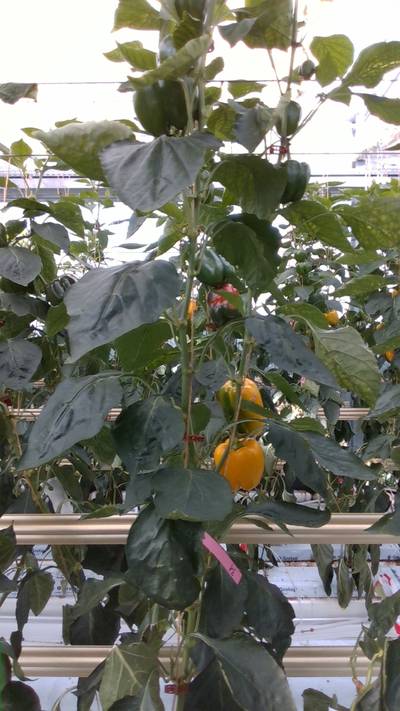
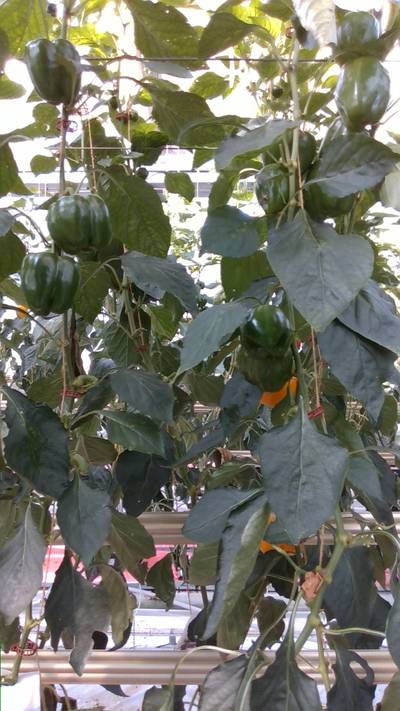
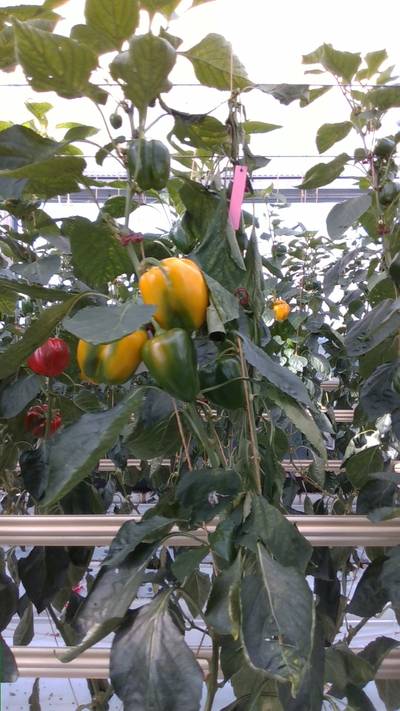
There are two critical aspects to the BUP20 dataset. First, it has labeled instance segmentation masks and full temporal sequences for tracking. Second, it has important robot and scene information, such as registered depth images, camera parameters, and wheel odometry information. It consists of non-overlapping annotated images. The sweet pepper dataset was captured at the University of Bonn’s campus Klein-Altendorf (CKA) in a commercial glasshouse. Images were captured on an Intel RealSense 435i camera (Intel Corporation, Santa Clara, California, USA.) with a resolution of 1280 × 720. The BUP20 dataset captured two different cultivars: Mavera (green-yellow) and Allrounder (green-red). While green dominates, there is a rich representation of all the sub-classes.
| Name | Abbreviation | Train | Validation | Evaluation |
|---|---|---|---|---|
| BUP20 | ||||
| Red | Rd | 158 | 52 | 100 |
| Yellow | Yl | 318 | 98 | 181 |
| Green | Gn | 2774 | 1285 | 1466 |
| Mixed Red | Mr | 100 | 62 | 70 |
| Mixed Yellow | My | 189 | 101 | 143 |
Sweet pepper dataset (BUP20).
To quantitatively assess the tracking algorithm’s performance, they conducted additional annotation of the data. Utilizing the provided video sequences, three annotators systematically tallied the occurrences of the five sub-classes in the image sequences, ensuring each sweet pepper was accounted for only once. This meticulous process yielded ground truth data, encompassing counts for each sub-class across an entire row.
The annotation of the BUP20 dataset presented challenges due to the potential appearance of fruit in the images from distant rows. Annotators were instructed to utilize the heat rails, situated approximately 1.05 meters from the sensor, as a reference guide. Fruits appearing beyond this reference point were excluded from the count. Despite this guideline, determining fruit location, coupled with challenges such as juvenile peppers resembling leaves and varying degrees of occlusion, introduced some ambiguity in the annotations.
 Homepage
 Research Paper
Summary #
BUP20: Sweet Pepper Dataset is a dataset for instance segmentation, semantic segmentation, object detection, and monocular depth estimation tasks. It is used in the agricultural and robotics industries.
The dataset consists of 560 images with 28830 labeled objects belonging to 5 different classes including green, yellow, mixed yellow, and other: red and mixed red.
Images in the BUP20 dataset have pixel-level instance segmentation and bounding box annotations. Due to the nature of the instance segmentation task, it can be automatically transformed into a semantic segmentation task (only one mask for every class). All images are labeled (i.e. with annotations). There are 3 splits in the dataset: train (248 images), test (186 images), and val (126 images). Alternatively, the dataset could be split into 5 rows: row4 (126 images), row2 (124 images), row3 (124 images), row5 (124 images), and row6 (62 images), or into 2 dates: 2020-10-01 (310 images) and 2020-09-24 (250 images). Additionally, images are grouped by im id. Also, every image marked with odometry tag, every image and label contain milliseconds tag. Every label contain infomation about its labeller: claus smitt, ramsay, chris mccool, agr user1, michallhal. Explore it in supervisely labeling tool. The dataset was released in 2020 by the University of Bonn, Germany.
Explore #
BUP20 dataset has 560 images. Click on one of the examples below or open "Explore" tool anytime you need to view dataset images with annotations. This tool has extended visualization capabilities like zoom, translation, objects table, custom filters and more. Hover the mouse over the images to hide or show annotations.


Class balance #
There are 5 annotation classes in the dataset. Find the general statistics and balances for every class in the table below. Click any row to preview images that have labels of the selected class. Sort by column to find the most rare or prevalent classes.

Class ㅤ | Images ㅤ | Objects ㅤ | Count on image average | Area on image average |
|---|---|---|---|---|
green➔ any | 560 | 22444 | 40.08 | 5.63% |
yellow➔ any | 394 | 2430 | 6.17 | 0.84% |
mixed yellow➔ any | 386 | 1750 | 4.53 | 1.1% |
red➔ any | 336 | 1270 | 3.78 | 0.61% |
mixed red➔ any | 284 | 936 | 3.3 | 0.93% |
Co-occurrence matrix #
Co-occurrence matrix is an extremely valuable tool that shows you the images for every pair of classes: how many images have objects of both classes at the same time. If you click any cell, you will see those images. We added the tooltip with an explanation for every cell for your convenience, just hover the mouse over a cell to preview the description.
Images #
Explore every single image in the dataset with respect to the number of annotations of each class it has. Click a row to preview selected image. Sort by any column to find anomalies and edge cases. Use horizontal scroll if the table has many columns for a large number of classes in the dataset.
Object distribution #
Interactive heatmap chart for every class with object distribution shows how many images are in the dataset with a certain number of objects of a specific class. Users can click cell and see the list of all corresponding images.
Class sizes #
The table below gives various size properties of objects for every class. Click a row to see the image with annotations of the selected class. Sort columns to find classes with the smallest or largest objects or understand the size differences between classes.
Class | Object count | Avg area | Max area | Min area | Min height | Min height | Max height | Max height | Avg height | Avg height | Min width | Min width | Max width | Max width |
|---|---|---|---|---|---|---|---|---|---|---|---|---|---|---|
green any | 22444 | 0.23% | 35.18% | 0% | 1px | 0.08% | 545px | 42.58% | 46px | 3.56% | 1px | 0.14% | 632px | 87.78% |
yellow any | 2430 | 0.22% | 2.65% | 0% | 1px | 0.08% | 365px | 28.52% | 44px | 3.47% | 1px | 0.14% | 176px | 24.44% |
mixed yellow any | 1750 | 0.4% | 2.7% | 0% | 2px | 0.16% | 361px | 28.2% | 64px | 4.96% | 1px | 0.14% | 174px | 24.17% |
red any | 1270 | 0.25% | 3.13% | 0% | 1px | 0.08% | 166px | 12.97% | 46px | 3.6% | 1px | 0.14% | 175px | 24.31% |
mixed red any | 936 | 0.46% | 2.99% | 0% | 3px | 0.23% | 173px | 13.52% | 66px | 5.15% | 1px | 0.14% | 163px | 22.64% |
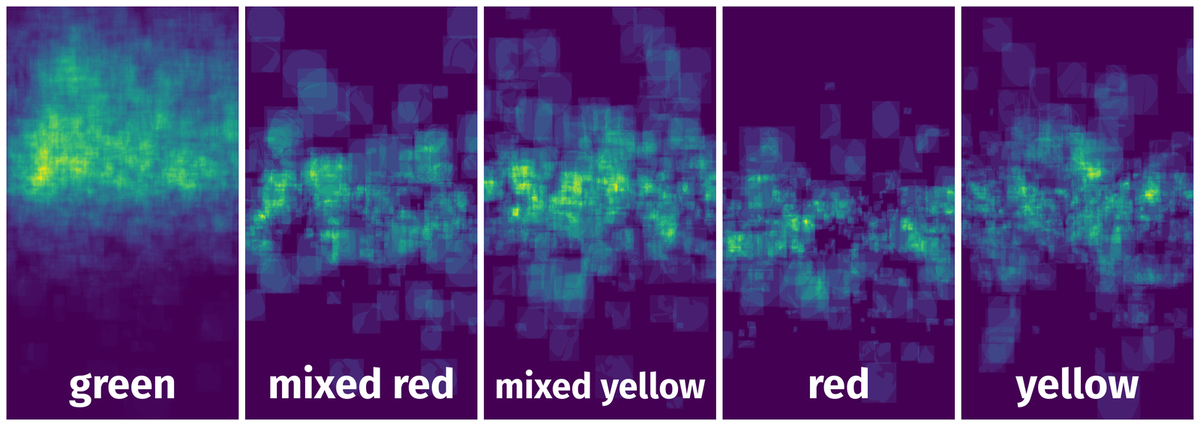
Spatial Heatmap #
The heatmaps below give the spatial distributions of all objects for every class. These visualizations provide insights into the most probable and rare object locations on the image. It helps analyze objects' placements in a dataset.
Objects #
Table contains all 28830 objects. Click a row to preview an image with annotations, and use search or pagination to navigate. Sort columns to find outliers in the dataset.
Object ID ㅤ | Class ㅤ | Image name click row to open | Image size height x width | Height ㅤ | Height ㅤ | Width ㅤ | Width ㅤ | Area ㅤ |
|---|---|---|---|---|---|---|---|---|
1➔ | mixed yellow any | 1601541705384582.tiff | 1280 x 720 | 83px | 6.48% | 90px | 12.5% | 0.44% |
2➔ | mixed yellow any | 1601541705384582.tiff | 1280 x 720 | 82px | 6.41% | 90px | 12.5% | 0.8% |
3➔ | red any | 1601541705384582.tiff | 1280 x 720 | 69px | 5.39% | 67px | 9.31% | 0.27% |
4➔ | red any | 1601541705384582.tiff | 1280 x 720 | 69px | 5.39% | 66px | 9.17% | 0.49% |
5➔ | green any | 1601541705384582.tiff | 1280 x 720 | 26px | 2.03% | 25px | 3.47% | 0.01% |
6➔ | green any | 1601541705384582.tiff | 1280 x 720 | 24px | 1.88% | 24px | 3.33% | 0.06% |
7➔ | yellow any | 1601541705384582.tiff | 1280 x 720 | 22px | 1.72% | 23px | 3.19% | 0.01% |
8➔ | yellow any | 1601541705384582.tiff | 1280 x 720 | 22px | 1.72% | 22px | 3.06% | 0.05% |
9➔ | yellow any | 1601541705384582.tiff | 1280 x 720 | 16px | 1.25% | 13px | 1.81% | 0.01% |
10➔ | yellow any | 1601541705384582.tiff | 1280 x 720 | 16px | 1.25% | 13px | 1.81% | 0.02% |
License #
License is unknown for the BUP20: Sweet Pepper Dataset dataset.
Citation #
If you make use of the BUP20 data, please cite the following reference:
@inproceedings{smitt2021pathobot,
  title={Pathobot: A robot for glasshouse crop phenotyping and intervention},
  author={Smitt, Claus and Halstead, Michael and Zaenker, Tobias and Bennewitz, Maren and McCool, Chris},
  booktitle={2021 IEEE International Conference on Robotics and Automation (ICRA)},
  pages={2324--2330},
  year={2021},
  organization={IEEE}
}
If you are happy with Dataset Ninja and use provided visualizations and tools in your work, please cite us:
@misc{ visualization-tools-for-bup20-dataset,
  title = { Visualization Tools for BUP20 Dataset },
  type = { Computer Vision Tools },
  author = { Dataset Ninja },
  howpublished = { \url{ https://datasetninja.com/bup20 } },
  url = { https://datasetninja.com/bup20 },
  journal = { Dataset Ninja },
  publisher = { Dataset Ninja },
  year = { 2026 },
  month = { aug },
  note = { visited on 2026-08-02 },
}
Download #
Please visit dataset homepage to download the data.
Disclaimer #
Our gal from the legal dep told us we need to post this:
Dataset Ninja provides visualizations and statistics for some datasets that can be found online and can be downloaded by general audience. Dataset Ninja is not a dataset hosting platform and can only be used for informational purposes. The platform does not claim any rights for the original content, including images, videos, annotations and descriptions. Joint publishing is prohibited.
You take full responsibility when you use datasets presented at Dataset Ninja, as well as other information, including visualizations and statistics we provide. You are in charge of compliance with any dataset license and all other permissions. You are required to navigate datasets homepage and make sure that you can use it. In case of any questions, get in touch with us at hello@datasetninja.com.