

Introduction #
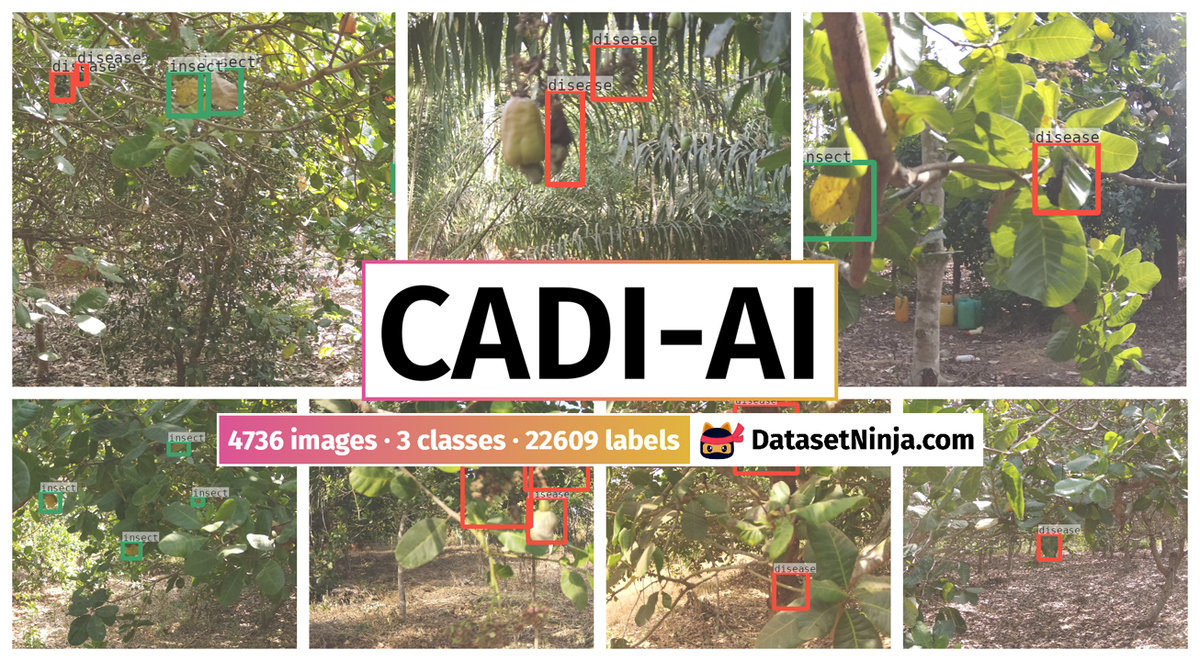
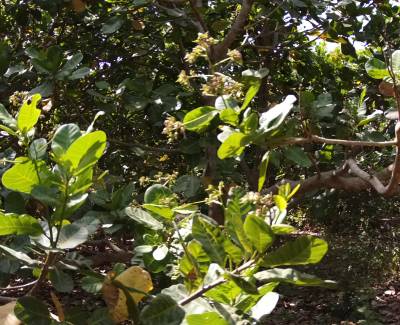
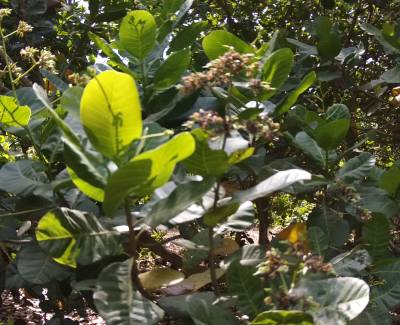
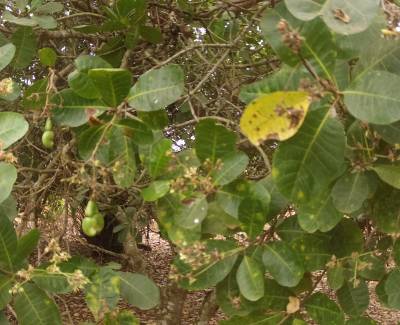
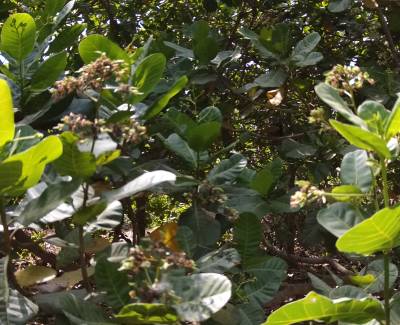
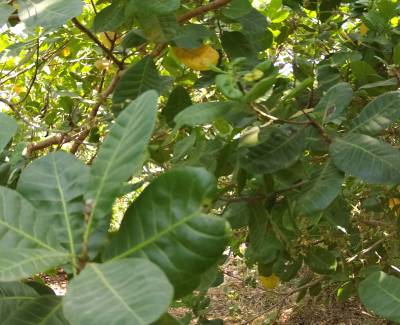
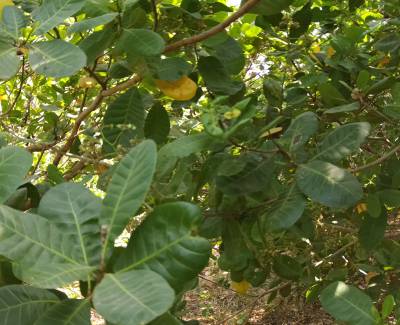
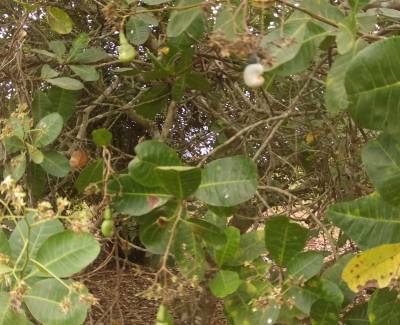
Authors introduce CADI-AI: Cashew Disease Identification with AI, a valuable dataset designed for object detection tasks, wherein a model has been rigorously trained to discern and pinpoint regions afflicted by the distinctive influences of abiotic factors, diseases, and insect infestations in cashew orchards. This dataset comprises 4,736 images containing a total of 22,609 labeled objects categorized into three distinct classes: insect, disease, and abiotic.

Class labels associated with data.
Motivation
The creation of this dataset represents a first contribution of drone data to the field of cashew crop research: Providing an open and accessible resource of high-quality, well-labeled drone imagery collected from Ghana Bono-Region, this dataset will offer data scientists, researchers, and social entrepreneurs within Sub-Saharan Africa and beyond, opportunities for innovative machine learning experiments and the development of solutions for infield cashew crop disease diagnosis and spatial analysis.
About CADI-AI
Each instance in the dataset includes crop image (JPEG), image status (Disease, Abiotic, and Insect), file type (images and bounding box annotations) and location (this variable though is without values).
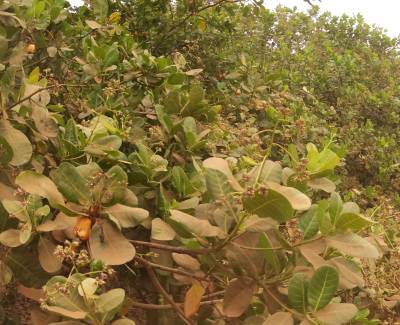
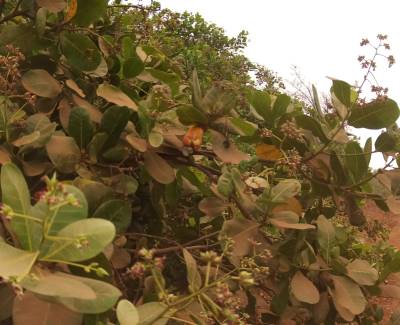
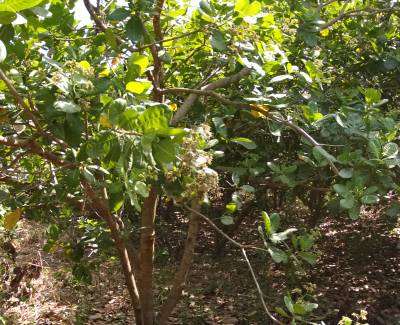
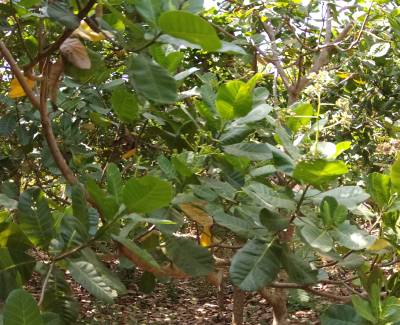
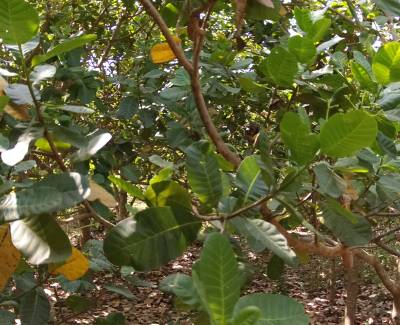
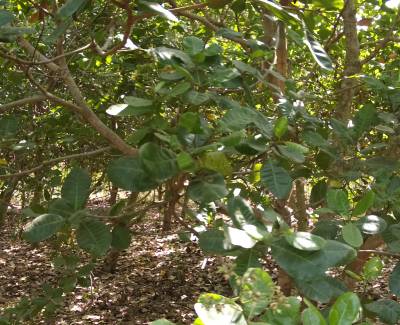
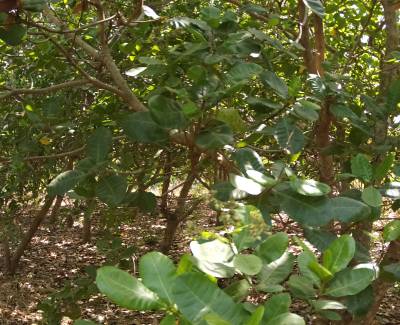
The dataset contains various instances that were captured in the Bono region, which is renowned for its cashew production. The data was collected in two rounds: The first data collection happened in November 2022, the second in January 2023. The data captured represents cashew data from a year where cashew blooming was particularly late. Given that the data was collected punctually only twice, it might be that not all blooming variations of Cashews have been captured, potentially influencing the variety of the collected data.
Each instance is associated with a class label based on the status of the crop. The labels are insect/pest, disease and abiotic:
- Insect/ pest stress factors represent the damage to crops by insects or pests
- Diseased factors represent attacks on crops by microorganisms.
- Abiotic stress factors represent stress factors caused by non-living factors, e.g. environmental factors like weather or soil conditions or the lack of mineral nutrients to the crop.
The decision to use the labels “abiotic”, “disease”, and “insect” for authors’ object detection task was recommended by an agricultural scientist with expertise in crop health and disease management, Dr. Torkpor Stephen from University of Ghana.
It is important to note that while these labels provide a general categorization of crop damage, they may not fully capture the complexity of the underlying causes. In addition, the labels may not be exhaustive and other types of damage may not be captured by these categories. As with any dataset, users should be aware of the limitations and context of the labels used and exercise caution when interpreting the results of models trained on this data.
Examples of the limitations and complexities involved includes:
- A plant may exhibit symptoms of both insect damage and disease, making it difficult to assign a single label to the damage.
- Damage caused by abiotic factors such as drought or nutrient deficiency may be similar to damage caused by disease or insect infestation, leading to confusion when assigning labels.
- Damage caused by multiple factors may not fit neatly into a single label category, requiring more nuanced and complex labeling.
- Different species of insects or diseases may cause similar damage to crops, making it difficult to distinguish between them using only the three labels.
- Other factors such as environmental stress, mechanical damage, or chemical exposure may also cause damage to crops, but may not be captured by the current labels.
Collection process
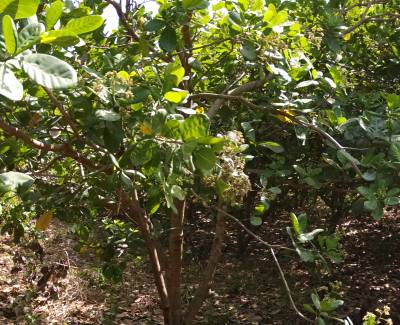
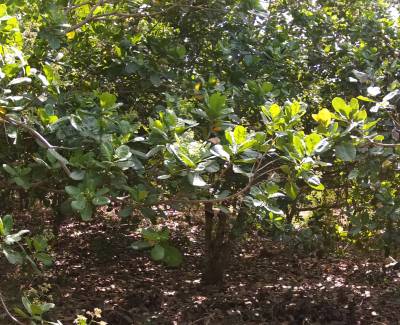
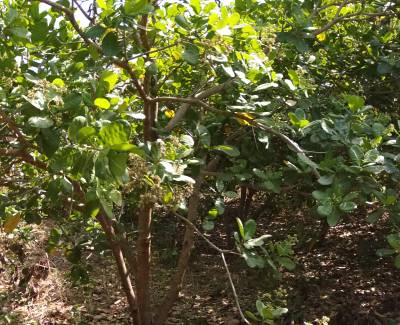
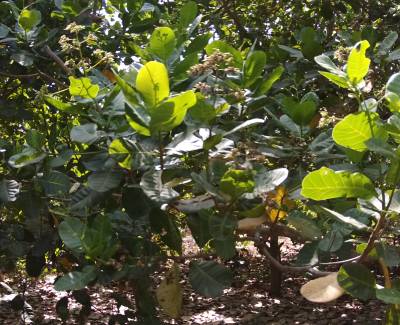
The images for the cashew data collection process were captured using a drone that was flown manually. The drone was flown at different altitudes to ensure that comprehensive information about the cashew crops was gathered. The photos of the cashew crop were taken at different angles with altitudes ranging from 2 to 10 meters. This altitude range provides a good balance between capturing a close-up view of the fruits and their growth stages and a wider perspective that allows for variation.
Preprocessing and labeling of the data were done during the data annotation stage using annotation tools (makesense.ai). Preprocessing of the data involved removing crop images in which human figures or faces were accidentally captured. Also blurry images were deleted.
The data was labeled by data scientists of KaraAgro AI who worked on this project. To ensure the accurate and efficient annotation of data, the team used advanced annotating tools (makesense.ai, roboflow) that offered various annotation formats (xml, yolo). Before the annotation process began, an expert in Agricultural Science reviewed the cashew images and provided comprehensive training on the annotation process, including appropriate labels (abiotic, insect, and diseased) to assign to each image.
 Homepage
 Datasheet
 GitHub
Summary #
CADI-AI: Cashew Disease Identification with AI is a dataset for an object detection task. It is used in the drone inspection domain, and in the agricultural industry.
The dataset consists of 4736 images with 22609 labeled objects belonging to 3 different classes including insect, disease, and abiotic.
Images in the CADI-AI dataset have bounding box annotations. All images are labeled (i.e. with annotations). There are 3 splits in the dataset: train (3788 images), val (710 images), and test (238 images). The dataset was released in 2023 by the KaraAgro AI Foundation.
Explore #
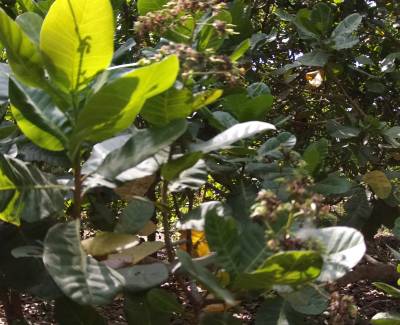
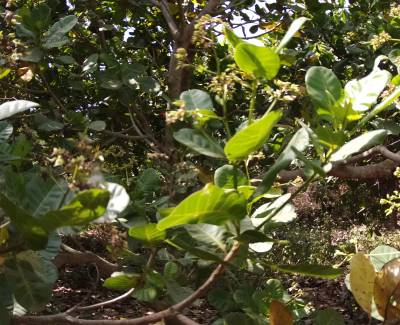
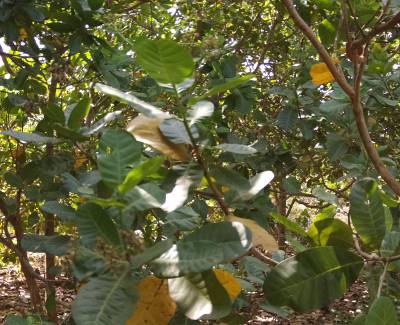
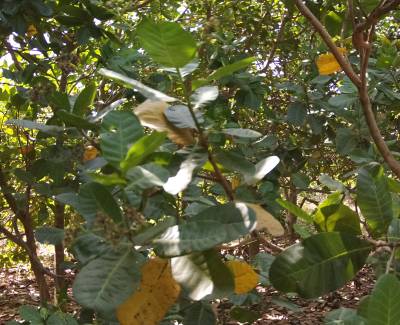
CADI-AI dataset has 4736 images. Click on one of the examples below or open "Explore" tool anytime you need to view dataset images with annotations. This tool has extended visualization capabilities like zoom, translation, objects table, custom filters and more. Hover the mouse over the images to hide or show annotations.


Class balance #
There are 3 annotation classes in the dataset. Find the general statistics and balances for every class in the table below. Click any row to preview images that have labels of the selected class. Sort by column to find the most rare or prevalent classes.

Class ㅤ | Images ㅤ | Objects ㅤ | Count on image average | Area on image average |
|---|---|---|---|---|
insect➔ rectangle | 2886 | 13959 | 4.84 | 4.79% |
disease➔ rectangle | 2826 | 7032 | 2.49 | 4.55% |
abiotic➔ rectangle | 1036 | 1618 | 1.56 | 8.54% |
Co-occurrence matrix #
Co-occurrence matrix is an extremely valuable tool that shows you the images for every pair of classes: how many images have objects of both classes at the same time. If you click any cell, you will see those images. We added the tooltip with an explanation for every cell for your convenience, just hover the mouse over a cell to preview the description.
Images #
Explore every single image in the dataset with respect to the number of annotations of each class it has. Click a row to preview selected image. Sort by any column to find anomalies and edge cases. Use horizontal scroll if the table has many columns for a large number of classes in the dataset.
Object distribution #
Interactive heatmap chart for every class with object distribution shows how many images are in the dataset with a certain number of objects of a specific class. Users can click cell and see the list of all corresponding images.
Class sizes #
The table below gives various size properties of objects for every class. Click a row to see the image with annotations of the selected class. Sort columns to find classes with the smallest or largest objects or understand the size differences between classes.
Class | Object count | Avg area | Max area | Min area | Min height | Min height | Max height | Max height | Avg height | Avg height | Min width | Min width | Max width | Max width |
|---|---|---|---|---|---|---|---|---|---|---|---|---|---|---|
insect rectangle | 13959 | 1% | 25.22% | 0% | 2px | 0.15% | 797px | 61.31% | 130px | 10.01% | 1px | 0.06% | 1202px | 75.12% |
disease rectangle | 7032 | 1.86% | 66.64% | 0% | 1px | 0.08% | 1300px | 100% | 176px | 13.56% | 1px | 0.06% | 1585px | 99.06% |
abiotic rectangle | 1618 | 5.57% | 74.81% | 0.01% | 15px | 1.15% | 1300px | 100% | 232px | 17.83% | 11px | 0.69% | 1531px | 95.69% |
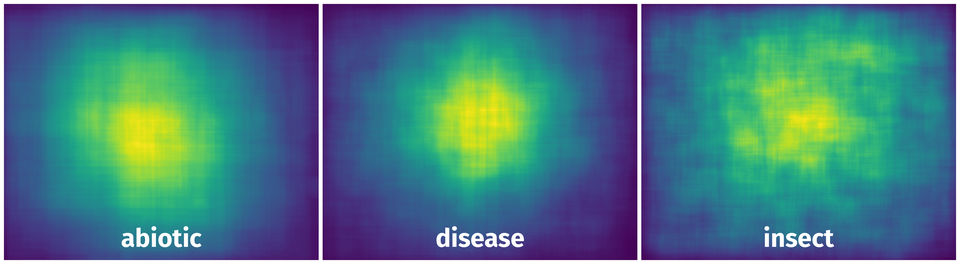
Spatial Heatmap #
The heatmaps below give the spatial distributions of all objects for every class. These visualizations provide insights into the most probable and rare object locations on the image. It helps analyze objects' placements in a dataset.
Objects #
Table contains all 22609 objects. Click a row to preview an image with annotations, and use search or pagination to navigate. Sort columns to find outliers in the dataset.
Object ID ㅤ | Class ㅤ | Image name click row to open | Image size height x width | Height ㅤ | Height ㅤ | Width ㅤ | Width ㅤ | Area ㅤ |
|---|---|---|---|---|---|---|---|---|
1➔ | disease rectangle | 2668.jpg | 1300 x 1600 | 414px | 31.85% | 375px | 23.44% | 7.46% |
2➔ | disease rectangle | 2668.jpg | 1300 x 1600 | 296px | 22.77% | 358px | 22.38% | 5.09% |
3➔ | disease rectangle | 2668.jpg | 1300 x 1600 | 183px | 14.08% | 377px | 23.56% | 3.32% |
4➔ | insect rectangle | 2668.jpg | 1300 x 1600 | 222px | 17.08% | 217px | 13.56% | 2.32% |
5➔ | disease rectangle | 2668.jpg | 1300 x 1600 | 41px | 3.15% | 41px | 2.56% | 0.08% |
6➔ | disease rectangle | 2668.jpg | 1300 x 1600 | 72px | 5.54% | 65px | 4.06% | 0.23% |
7➔ | disease rectangle | 2668.jpg | 1300 x 1600 | 64px | 4.92% | 57px | 3.56% | 0.18% |
8➔ | insect rectangle | 2668.jpg | 1300 x 1600 | 104px | 8% | 101px | 6.31% | 0.51% |
9➔ | disease rectangle | 1633.jpg | 1300 x 1600 | 179px | 13.77% | 101px | 6.31% | 0.87% |
10➔ | disease rectangle | 1633.jpg | 1300 x 1600 | 122px | 9.38% | 119px | 7.44% | 0.7% |
License #
CADI-AI: Cashew Disease Identification with AI is under GNU GPL 3.0 license.
Citation #
If you make use of the CADI-AI data, please cite the following reference:
@dataset{CADI-AI,
  organization={KaraAgro AI Foundation},
  title={CADI-AI: Cashew Disease Identification with AI},
  year={2023},
  url={https://www.kaggle.com/datasets/karaagroaiprojects/cadi-ai}
}
If you are happy with Dataset Ninja and use provided visualizations and tools in your work, please cite us:
@misc{ visualization-tools-for-cadi-ai-dataset,
  title = { Visualization Tools for CADI-AI Dataset },
  type = { Computer Vision Tools },
  author = { Dataset Ninja },
  howpublished = { \url{ https://datasetninja.com/cadi-ai } },
  url = { https://datasetninja.com/cadi-ai },
  journal = { Dataset Ninja },
  publisher = { Dataset Ninja },
  year = { 2026 },
  month = { jul },
  note = { visited on 2026-07-16 },
}
Download #
Dataset CADI-AI can be downloaded in Supervisely format:
As an alternative, it can be downloaded with dataset-tools package:
pip install --upgrade dataset-tools
… using following python code:
import dataset_tools as dtools

dtools.download(dataset='CADI-AI', dst_dir='~/dataset-ninja/')
Make sure not to overlook the python code example available on the Supervisely Developer Portal. It will give you a clear idea of how to effortlessly work with the downloaded dataset.
Disclaimer #
Our gal from the legal dep told us we need to post this:
Dataset Ninja provides visualizations and statistics for some datasets that can be found online and can be downloaded by general audience. Dataset Ninja is not a dataset hosting platform and can only be used for informational purposes. The platform does not claim any rights for the original content, including images, videos, annotations and descriptions. Joint publishing is prohibited.
You take full responsibility when you use datasets presented at Dataset Ninja, as well as other information, including visualizations and statistics we provide. You are in charge of compliance with any dataset license and all other permissions. You are required to navigate datasets homepage and make sure that you can use it. In case of any questions, get in touch with us at hello@datasetninja.com.