
Introduction #
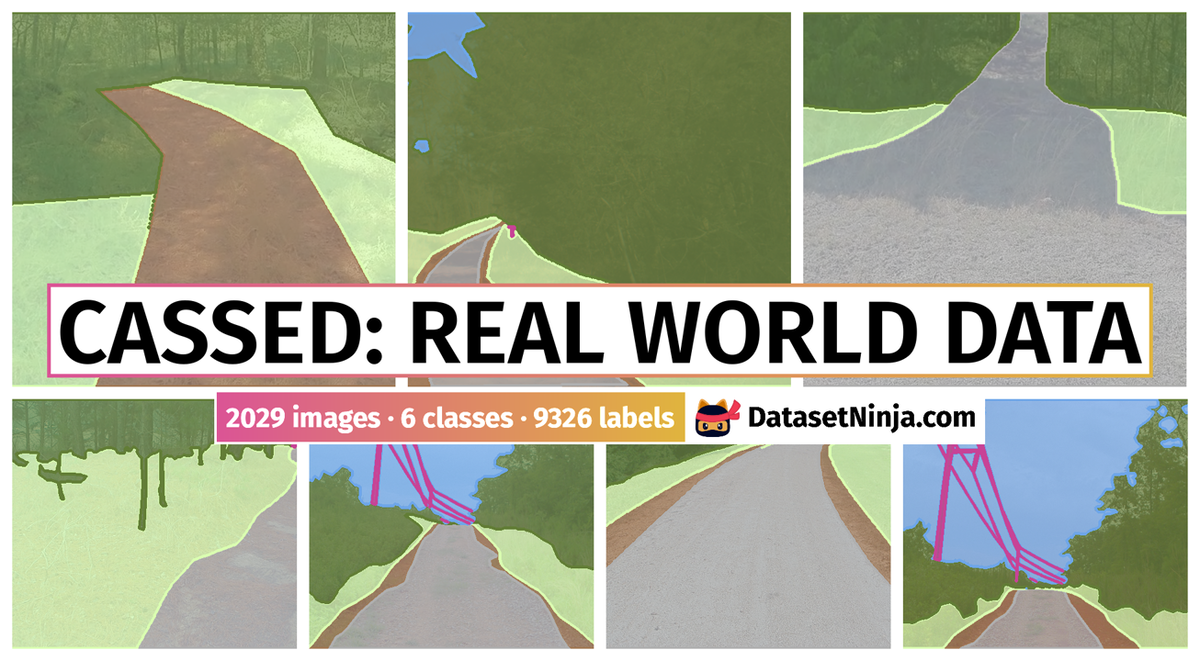
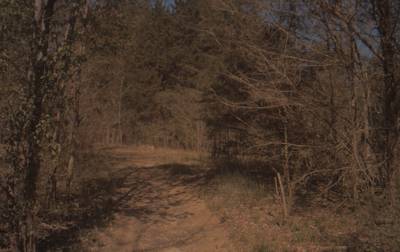
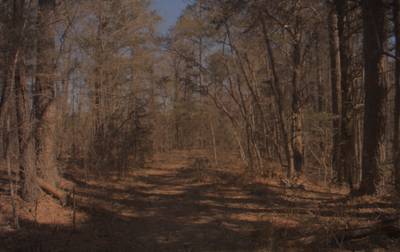
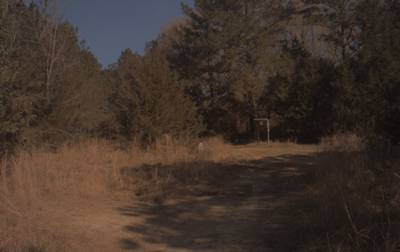
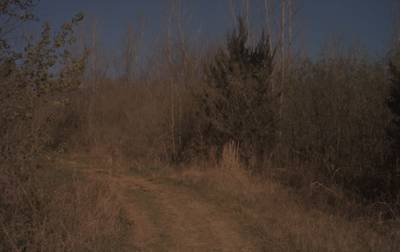
The CaSSeD: Real World Data dataset is a part of the CaSSeD: CAVS Semantic Segmentation Dataset for Off-Road Autonomous Driving comprised of two sets of segmentation data specially targeted for the unstructured, off-road driving environment. The presented one is a real-world semantic segmentation dataset with 1700 images collected at the CAVS proving grounds, a 55-acre area with trails, hills, obstacles, and dense vegetation, similar to a forest environment. Data were collected during winter 2018 and summer 2019 using a Sekonix SF3325-100 GMSL camera mounted on the top of a Polaris Ranger crew XP100, capturing imagery at 10 frames per second. The images are semantically labeled using classes such as smooth trail, rough trail, small vegetation, forest, sky, and obstacles.
Please note, that the actual number of images differs from the the claimed by the authors
 Homepage
Summary #
CaSSeD: CAVS Semantic Segmentation Dataset for Off-Road Autonomous Driving (Real World Data) is a dataset for a semantic segmentation task. It is used in the automotive industry.
The dataset consists of 2029 images with 9326 labeled objects belonging to 6 different classes including forest, small vegetation, smooth trail, and other: rough trail, sky, and obstacles.
Images in the CaSSeD: Real World Data dataset have pixel-level semantic segmentation annotations. There is 1 unlabeled image (i.e. without annotations). There are 8 splits in the dataset: dataset1C_main_trail (350 images), train (350 images), dataset3_north_farm (300 images), dataset4_north_slope (300 images), dataset2_fogdata (279 images), dataset1A_brown_field (200 images), test (150 images), and dataset1B_powerline (100 images). Alternatively, the dataset could be split into 3 test image set locations: browns_field (60 images), main_trail (60 images), and powerline (30 images). The dataset was released in 2022 by the Mississippi State University, Mississippi State, MS, USA and Dynetics Inc., Huntsville, AL, USA.
Explore #
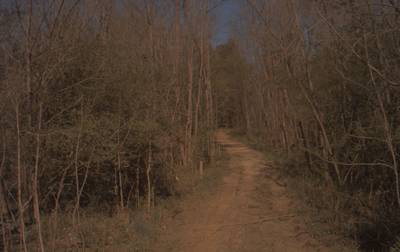
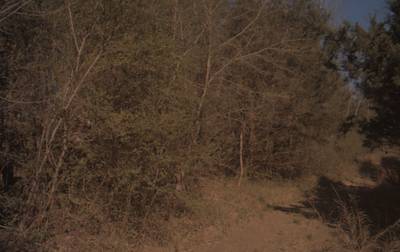
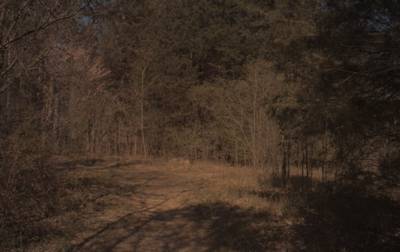
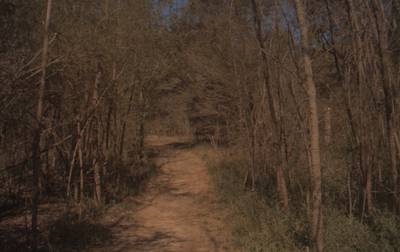
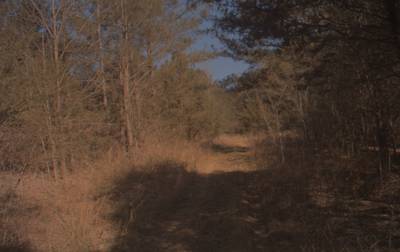
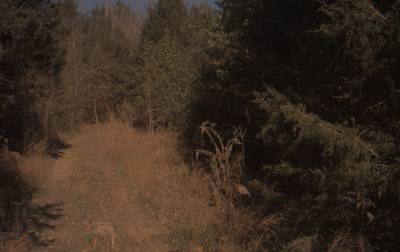
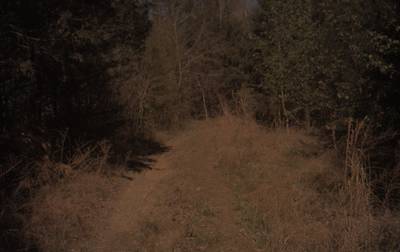
CaSSeD: Real World Data dataset has 2029 images. Click on one of the examples below or open "Explore" tool anytime you need to view dataset images with annotations. This tool has extended visualization capabilities like zoom, translation, objects table, custom filters and more. Hover the mouse over the images to hide or show annotations.


Class balance #
There are 6 annotation classes in the dataset. Find the general statistics and balances for every class in the table below. Click any row to preview images that have labels of the selected class. Sort by column to find the most rare or prevalent classes.

Class ㅤ | Images ㅤ | Objects ㅤ | Count on image average | Area on image average |
|---|---|---|---|---|
forest➔ mask | 2023 | 2023 | 1 | 52.71% |
small vegetation➔ mask | 2000 | 2000 | 1 | 19.58% |
smooth trail➔ mask | 1680 | 1680 | 1 | 9.08% |
rough trail➔ mask | 1505 | 1505 | 1 | 20.61% |
sky➔ mask | 1183 | 1183 | 1 | 6.51% |
obstacles➔ mask | 935 | 935 | 1 | 1.01% |
Co-occurrence matrix #
Co-occurrence matrix is an extremely valuable tool that shows you the images for every pair of classes: how many images have objects of both classes at the same time. If you click any cell, you will see those images. We added the tooltip with an explanation for every cell for your convenience, just hover the mouse over a cell to preview the description.
Images #
Explore every single image in the dataset with respect to the number of annotations of each class it has. Click a row to preview selected image. Sort by any column to find anomalies and edge cases. Use horizontal scroll if the table has many columns for a large number of classes in the dataset.
Object distribution #
Interactive heatmap chart for every class with object distribution shows how many images are in the dataset with a certain number of objects of a specific class. Users can click cell and see the list of all corresponding images.
Class sizes #
The table below gives various size properties of objects for every class. Click a row to see the image with annotations of the selected class. Sort columns to find classes with the smallest or largest objects or understand the size differences between classes.
Class | Object count | Avg area | Max area | Min area | Min height | Min height | Max height | Max height | Avg height | Avg height | Min width | Min width | Max width | Max width |
|---|---|---|---|---|---|---|---|---|---|---|---|---|---|---|
forest mask | 2023 | 52.71% | 99.33% | 2.22% | 36px | 7.96% | 1208px | 100% | 515px | 79.41% | 410px | 56.94% | 1920px | 100% |
small vegetation mask | 2000 | 19.58% | 58.38% | 0.33% | 11px | 2.43% | 912px | 100% | 325px | 56.23% | 88px | 8.59% | 1920px | 100% |
smooth trail mask | 1680 | 9.08% | 75.01% | 0.06% | 8px | 1.77% | 914px | 100% | 302px | 50.61% | 9px | 1.25% | 1920px | 100% |
rough trail mask | 1505 | 20.61% | 76.5% | 0.16% | 32px | 4.97% | 913px | 100% | 335px | 57.41% | 28px | 2.73% | 1920px | 100% |
sky mask | 1183 | 6.51% | 50.23% | 0% | 3px | 0.66% | 1208px | 100% | 223px | 25.79% | 10px | 0.98% | 1920px | 100% |
obstacles mask | 935 | 1.01% | 11.43% | 0% | 1px | 0.17% | 1071px | 88.66% | 231px | 27.1% | 1px | 0.1% | 1798px | 100% |
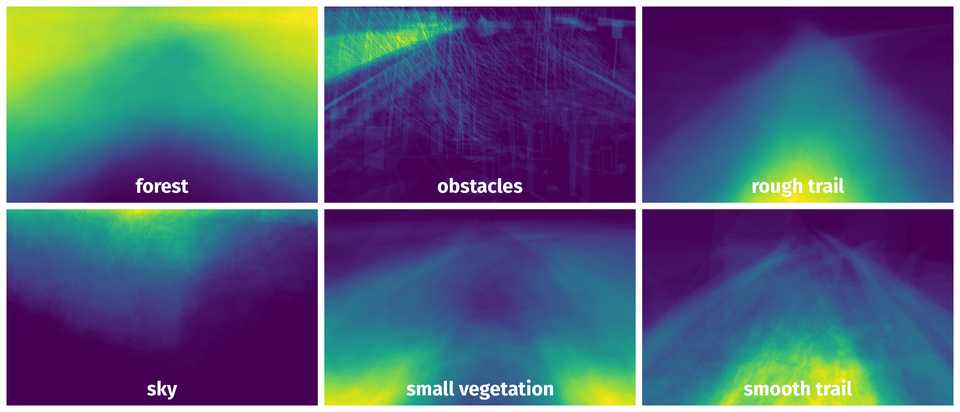
Spatial Heatmap #
The heatmaps below give the spatial distributions of all objects for every class. These visualizations provide insights into the most probable and rare object locations on the image. It helps analyze objects' placements in a dataset.
Objects #
Table contains all 9326 objects. Click a row to preview an image with annotations, and use search or pagination to navigate. Sort columns to find outliers in the dataset.
Object ID ㅤ | Class ㅤ | Image name click row to open | Image size height x width | Height ㅤ | Height ㅤ | Width ㅤ | Width ㅤ | Area ㅤ |
|---|---|---|---|---|---|---|---|---|
1➔ | smooth trail mask | screenshot_rgba_0093.png | 604 x 960 | 289px | 47.85% | 576px | 60% | 3.72% |
2➔ | rough trail mask | screenshot_rgba_0093.png | 604 x 960 | 288px | 47.68% | 427px | 44.48% | 9.47% |
3➔ | small vegetation mask | screenshot_rgba_0093.png | 604 x 960 | 304px | 50.33% | 960px | 100% | 15.66% |
4➔ | forest mask | screenshot_rgba_0093.png | 604 x 960 | 604px | 100% | 960px | 100% | 68.09% |
5➔ | sky mask | screenshot_rgba_0093.png | 604 x 960 | 204px | 33.77% | 212px | 22.08% | 0.94% |
6➔ | smooth trail mask | screenshot_rgba_0002.png | 604 x 960 | 162px | 26.82% | 506px | 52.71% | 2.49% |
7➔ | rough trail mask | screenshot_rgba_0002.png | 604 x 960 | 178px | 29.47% | 537px | 55.94% | 8.46% |
8➔ | small vegetation mask | screenshot_rgba_0002.png | 604 x 960 | 243px | 40.23% | 960px | 100% | 10.96% |
9➔ | forest mask | screenshot_rgba_0002.png | 604 x 960 | 574px | 95.03% | 960px | 100% | 76.04% |
10➔ | obstacles mask | screenshot_rgba_0002.png | 604 x 960 | 39px | 6.46% | 54px | 5.62% | 0.33% |
License #
License is unknown for the CaSSeD: CAVS Semantic Segmentation Dataset for Off-Road Autonomous Driving (Real World Data) dataset.
Citation #
If you make use of the CaSSeD: Real World Data data, please cite the following reference:
@dataset{CaSSeD: Real World Data,
  author={Suvash Sharma and Lalitha Dabbiru and Chris Goodin and Daniel Carruth and Matthew Doude and Christopher Hudson and John Ball and Bo Tang},
  title={CaSSeD: CAVS Semantic Segmentation Dataset for Off-Road Autonomous Driving (Real World Data)},
  year={2022},
  url={https://www.cavs.msstate.edu/resources/autonomous_dataset.php}
}
If you are happy with Dataset Ninja and use provided visualizations and tools in your work, please cite us:
@misc{ visualization-tools-for-cassed-real-world-data-dataset,
  title = { Visualization Tools for CaSSeD: Real World Data Dataset },
  type = { Computer Vision Tools },
  author = { Dataset Ninja },
  howpublished = { \url{ https://datasetninja.com/cassed-real-world-data } },
  url = { https://datasetninja.com/cassed-real-world-data },
  journal = { Dataset Ninja },
  publisher = { Dataset Ninja },
  year = { 2026 },
  month = { aug },
  note = { visited on 2026-08-02 },
}
Download #
Please visit dataset homepage to download the data.
Disclaimer #
Our gal from the legal dep told us we need to post this:
Dataset Ninja provides visualizations and statistics for some datasets that can be found online and can be downloaded by general audience. Dataset Ninja is not a dataset hosting platform and can only be used for informational purposes. The platform does not claim any rights for the original content, including images, videos, annotations and descriptions. Joint publishing is prohibited.
You take full responsibility when you use datasets presented at Dataset Ninja, as well as other information, including visualizations and statistics we provide. You are in charge of compliance with any dataset license and all other permissions. You are required to navigate datasets homepage and make sure that you can use it. In case of any questions, get in touch with us at hello@datasetninja.com.