

Introduction #
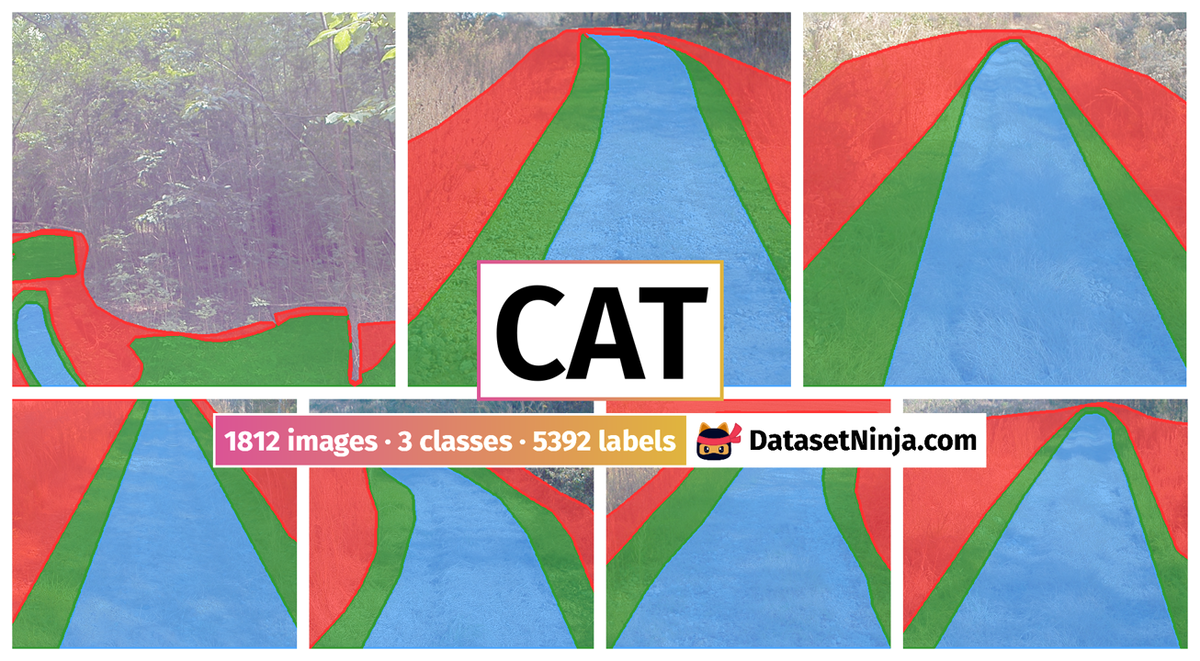
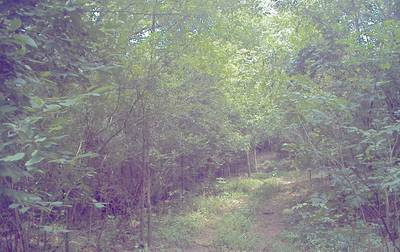
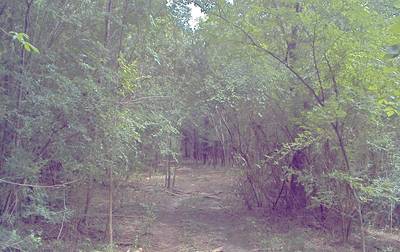
The creators of the CaT: CAVS Traversability Dataset (CAVS stands for the Center for Advanced Vehicular Systems), aim to enhance path extraction in off-road driving scenarios. They introduce a novel semantic segmentation concept that involves finely segmenting driving trails into sub-trails and areas, corresponding to the capabilities of different vehicle classes, to ensure safe traversal. In this dataset, three distinct vehicle classes (sedan, pickup, and off-road) are considered, and images are labeled based on their suitability for these vehicle types. The dataset comprises a total of 1812 images, which are divided into both train and test sets with a split ratio of 70/30. During the selection of images for the testing set, close attention is paid ensuring that they adequately represent the variety of trails considered, encompassing both general and specialized scenarios.
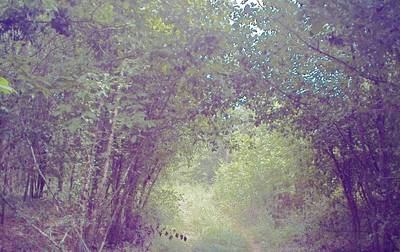
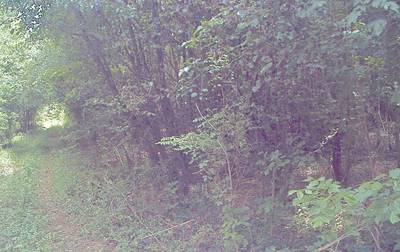
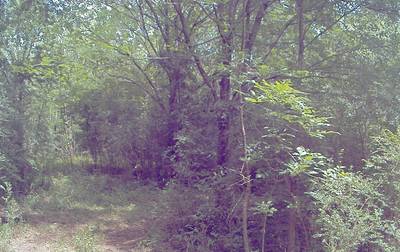
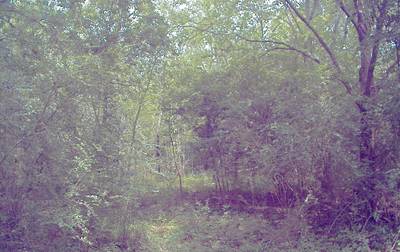
Due to the well-structured nature of typical on-road scenes, current road extraction processes are largely successful and most types of vehicles are able to traverse through the area that is detected as road. However, the off-road driving domain has many additional uncertainties such as uneven terrain structure, positive and negative obstacles, ditches, quagmires, hidden objects, etc. making it very unstructured. Traversing through such an unstructured area is constrained by a vehicle’s type and its capability. Therefore, an alternative approach to segmentation of the off-road driving trail is required that supports consideration of the vehicle type in a way that is not considered in state-of-the-art on-road segmentation approaches.
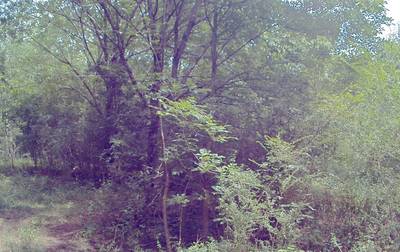
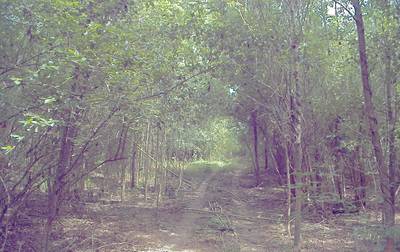
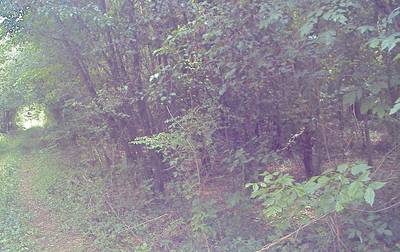
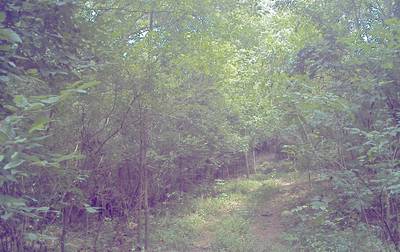
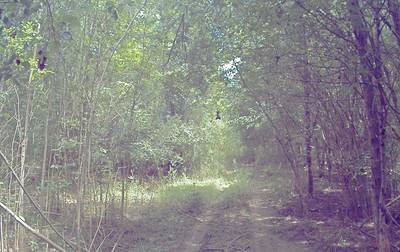
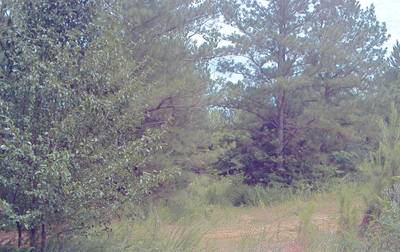
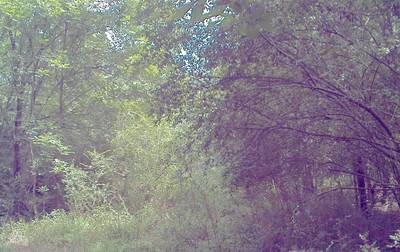
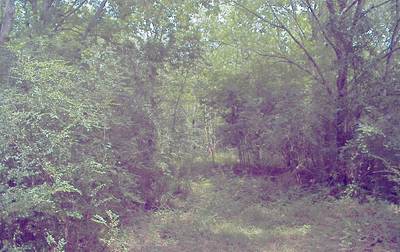
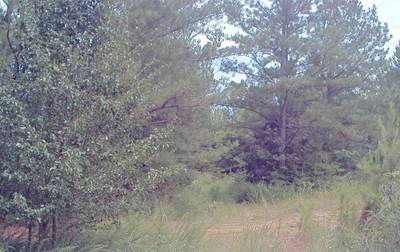
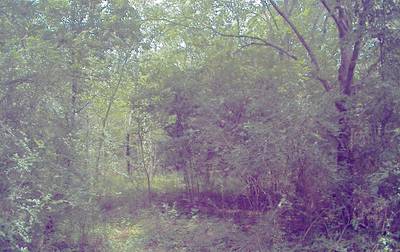
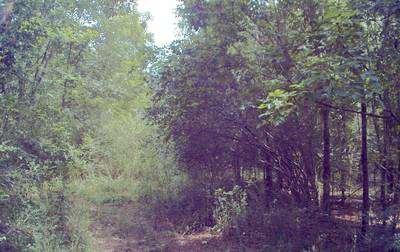
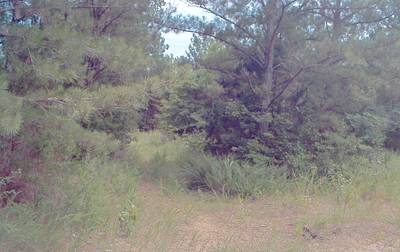
So the proposed dataset facilitates the segmentation of off-road driving trails into three regions based on the nature of the driving area and vehicle capability: brown_field, main_trail, power_line.
The vehicle used in the authors’ data collection platform along with the sensors placed over it is shown in the picture below. The authors chose the Polaris Ranger crew XP100 due to its’ good ground clearance and stronger chassis with a full-body skid plate that is quite favourable for off-road driving. All the sensors are placed on a special wooden structure which we call ‘Ranger hat’. In the Ranger hat, the lidar and Global Navigation Satellite System/Inertial Navigation System (GNSS/INS) modules are placed vertically up and down. Two cameras are placed on both the sides of GNS/INS module symmetrically.
As shown in this picture, two white modules on both the sides of yellow IMU unit on the ranger hat are the camera sensors we used. These are the Sekonix SF3325-100 model with RCCB (Red-Clear-Clear-Blue) color filters and AR0231 CMOS image sensor with an active-pixel array of 1928×1208 with an LED Flicker Mitigation (LFM). With an IP69k rating, these cameras are capable of resisting the effects of adverse environmental conditions like high temperature, dust, and high water pressure. The serialized input-output is supported with an MAX96705 GMSL serializer with 27MHz.
The overall collection pipeline along with the connection detailing is shown in the picture below. As shown in the figure, both of the cameras are connected to the ROS (Robotic Operating System) nodes available on the Drive PX2. The output of the camera is transferred over the network through PX2 and is finally saved in the collection computer. All the datasets are collected in rosbag formats which we transfer to the CAVS servers for the final storage. Representative images from each trail are selected from the rosbag extractions and provided to the labelers to annotate with the traversability labels.
 Homepage
 Research Paper
Summary #
CaT: CAVS Traversability Dataset for Off-Road Autonomous Driving is a dataset for a semantic segmentation task. It is used in the automotive industry.
The dataset consists of 1812 images with 5392 labeled objects belonging to 3 different classes including off road, sedan, and pickup.
Images in the CaT dataset have pixel-level semantic segmentation annotations. All images are labeled (i.e. with annotations). There are 2 splits in the dataset: train (1268 images) and test (544 images). Alternatively, the dataset could be split into 3 locations: power_line (1422 images), brown_field (200 images), and main_trail (190 images). The dataset was released in 2022 by the Mississippi State University, Mississippi State, MS, USA and Dynetics Inc., Huntsville, AL, USA.
Explore #
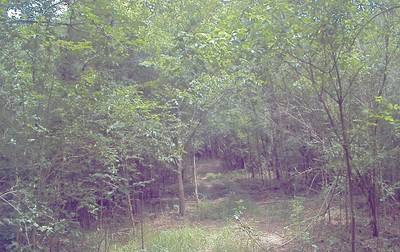
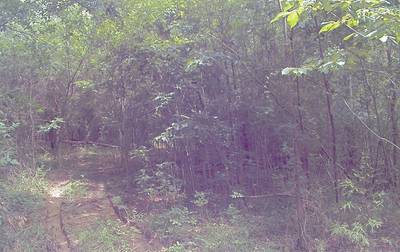
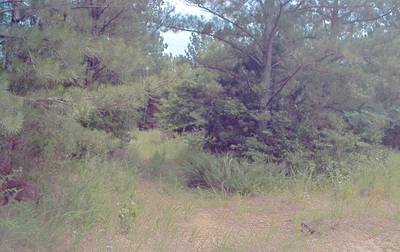
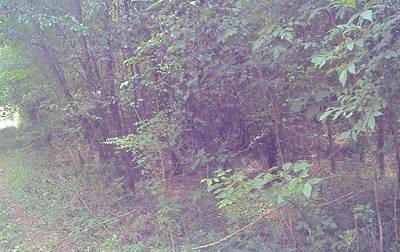
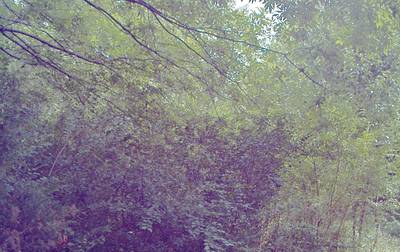
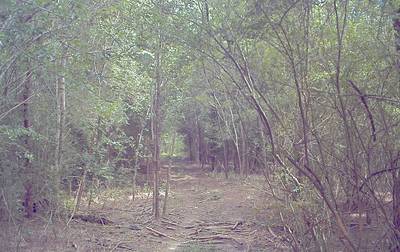
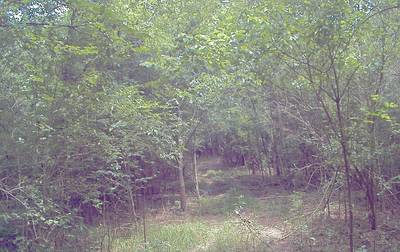
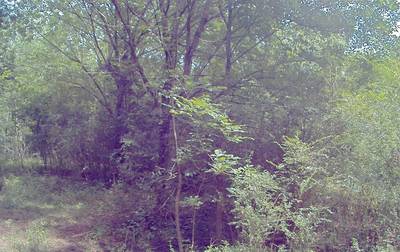
CaT dataset has 1812 images. Click on one of the examples below or open "Explore" tool anytime you need to view dataset images with annotations. This tool has extended visualization capabilities like zoom, translation, objects table, custom filters and more. Hover the mouse over the images to hide or show annotations.


Class balance #
There are 3 annotation classes in the dataset. Find the general statistics and balances for every class in the table below. Click any row to preview images that have labels of the selected class. Sort by column to find the most rare or prevalent classes.

Class ㅤ | Images ㅤ | Objects ㅤ | Count on image average | Area on image average |
|---|---|---|---|---|
off road➔ mask | 1812 | 1812 | 1 | 23.28% |
sedan➔ mask | 1805 | 1805 | 1 | 28.3% |
pickup➔ mask | 1775 | 1775 | 1 | 15.06% |
Co-occurrence matrix #
Co-occurrence matrix is an extremely valuable tool that shows you the images for every pair of classes: how many images have objects of both classes at the same time. If you click any cell, you will see those images. We added the tooltip with an explanation for every cell for your convenience, just hover the mouse over a cell to preview the description.
Images #
Explore every single image in the dataset with respect to the number of annotations of each class it has. Click a row to preview selected image. Sort by any column to find anomalies and edge cases. Use horizontal scroll if the table has many columns for a large number of classes in the dataset.
Object distribution #
Interactive heatmap chart for every class with object distribution shows how many images are in the dataset with a certain number of objects of a specific class. Users can click cell and see the list of all corresponding images.
Class sizes #
The table below gives various size properties of objects for every class. Click a row to see the image with annotations of the selected class. Sort columns to find classes with the smallest or largest objects or understand the size differences between classes.
Class | Object count | Avg area | Max area | Min area | Min height | Min height | Max height | Max height | Avg height | Avg height | Min width | Min width | Max width | Max width |
|---|---|---|---|---|---|---|---|---|---|---|---|---|---|---|
off road mask | 1812 | 23.28% | 56.43% | 0.14% | 35px | 2.9% | 954px | 100% | 355px | 71.07% | 140px | 13.67% | 1920px | 100% |
sedan mask | 1805 | 28.3% | 80.81% | 0.39% | 24px | 3.73% | 914px | 100% | 363px | 73.41% | 88px | 8.59% | 1911px | 100% |
pickup mask | 1775 | 15.06% | 34.81% | 0.58% | 42px | 6.21% | 915px | 100% | 367px | 73.87% | 111px | 10.84% | 1920px | 100% |
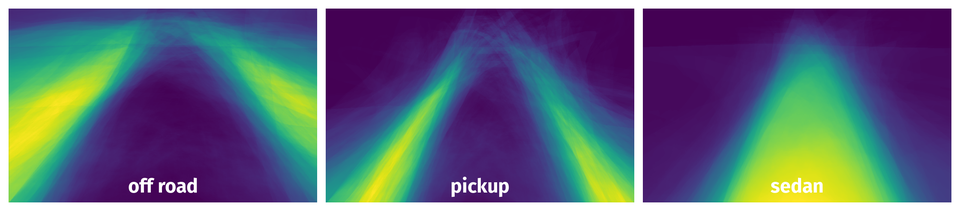
Spatial Heatmap #
The heatmaps below give the spatial distributions of all objects for every class. These visualizations provide insights into the most probable and rare object locations on the image. It helps analyze objects' placements in a dataset.
Objects #
Table contains all 5392 objects. Click a row to preview an image with annotations, and use search or pagination to navigate. Sort columns to find outliers in the dataset.
Object ID ㅤ | Class ㅤ | Image name click row to open | Image size height x width | Height ㅤ | Height ㅤ | Width ㅤ | Width ㅤ | Area ㅤ |
|---|---|---|---|---|---|---|---|---|
1➔ | sedan mask | img_346.png | 604 x 960 | 290px | 48.01% | 384px | 40% | 11.46% |
2➔ | pickup mask | img_346.png | 604 x 960 | 305px | 50.5% | 715px | 74.48% | 13.75% |
3➔ | off road mask | img_346.png | 604 x 960 | 304px | 50.33% | 692px | 72.08% | 0.9% |
4➔ | sedan mask | img_pln_546.png | 452 x 720 | 361px | 79.87% | 418px | 58.06% | 28.5% |
5➔ | pickup mask | img_pln_546.png | 452 x 720 | 369px | 81.64% | 550px | 76.39% | 11.85% |
6➔ | off road mask | img_pln_546.png | 452 x 720 | 376px | 83.19% | 720px | 100% | 36.62% |
7➔ | sedan mask | img_pln_513.png | 452 x 720 | 346px | 76.55% | 462px | 64.17% | 29.14% |
8➔ | pickup mask | img_pln_513.png | 452 x 720 | 363px | 80.31% | 717px | 99.58% | 24.66% |
9➔ | off road mask | img_pln_513.png | 452 x 720 | 403px | 89.16% | 720px | 100% | 29.75% |
10➔ | sedan mask | img_pln_231.png | 452 x 720 | 385px | 85.18% | 425px | 59.03% | 27.28% |
License #
Citation #
If you make use of the CaT data, please cite the following reference:
Z. Wang, J. Nakazato, M. Asad, E. Javanmardi and M. Tsukada, "Overcoming Environmental Challenges in CAVs through MEC-based Federated Learning,"
2023 Fourteenth International Conference on Ubiquitous and Future Networks (ICUFN), Paris, France, 2023, pp. 151-156, doi: 10.1109/ICUFN57995.2023.10200688.

S. Dokania, A. H. A. Hafez, A. Subramanian, M. Chandraker and C. V. Jawahar, "IDD-3D: Indian Driving Dataset for 3D Unstructured Road Scenes," 2023 IEEE/CVF Winter Conference on Applications of Computer Vision (WACV), Waikoloa, HI, USA, 2023, pp. 4471-4480, doi: 10.1109/WACV56688.2023.00446.

D. W. Carruth, C. T. Walden, C. Goodin and S. C. Fuller, "Challenges in Low Infrastructure and Off-Road Automated Driving," 2022
Fifth International Conference on Connected and Autonomous Driving (MetroCAD), Detroit, MI, USA, 2022, pp. 13-20, doi: 10.1109/MetroCAD56305.2022.00008.
If you are happy with Dataset Ninja and use provided visualizations and tools in your work, please cite us:
@misc{ visualization-tools-for-cat-dataset,
  title = { Visualization Tools for CaT Dataset },
  type = { Computer Vision Tools },
  author = { Dataset Ninja },
  howpublished = { \url{ https://datasetninja.com/cat } },
  url = { https://datasetninja.com/cat },
  journal = { Dataset Ninja },
  publisher = { Dataset Ninja },
  year = { 2026 },
  month = { jul },
  note = { visited on 2026-07-26 },
}
Download #
Dataset CaT can be downloaded in Supervisely format:
As an alternative, it can be downloaded with dataset-tools package:
pip install --upgrade dataset-tools
… using following python code:
import dataset_tools as dtools

dtools.download(dataset='CaT', dst_dir='~/dataset-ninja/')
Make sure not to overlook the python code example available on the Supervisely Developer Portal. It will give you a clear idea of how to effortlessly work with the downloaded dataset.
Disclaimer #
Our gal from the legal dep told us we need to post this:
Dataset Ninja provides visualizations and statistics for some datasets that can be found online and can be downloaded by general audience. Dataset Ninja is not a dataset hosting platform and can only be used for informational purposes. The platform does not claim any rights for the original content, including images, videos, annotations and descriptions. Joint publishing is prohibited.
You take full responsibility when you use datasets presented at Dataset Ninja, as well as other information, including visualizations and statistics we provide. You are in charge of compliance with any dataset license and all other permissions. You are required to navigate datasets homepage and make sure that you can use it. In case of any questions, get in touch with us at hello@datasetninja.com.