

Introduction #
The authors of the Cattle Detection and Counting in UAV Images dataset propose a system for cattle detection and counting to assist with grazing cattle management. Their approach relies on Convolutional Neural Networks (CNNs) and utilizes aerial images captured by an Unmanned Aerial Vehicle (UAV). To enhance the accuracy of cattle detection, they leverage the predictability of object size in UAV images, assuming a relatively constant UAV height from the ground. Their method involves resizing images to an optimal resolution based on object size and network down-sampling rates, both during training and testing.
Cattle counting is a crucial task in grazing cattle management, aiding farmers in efficiently organizing pasturing layouts and promptly identifying cattle-related incidents. However, manually counting cattle by walking across the pasture is both labor-intensive and time-consuming. Therefore, the authors advocate for computer vision-based cattle monitoring as a cost-effective and labor-saving alternative. They highlight the potential of using aerial images captured by UAVs for monitoring animals over extensive and hard-to-reach areas. UAVs offer advantages such as wide coverage and reduced object overlap from a bird’s-eye perspective, making them suitable for object detection and counting.
The authors describe two fundamental approaches for estimating object counts from images: count-by-regression and count-by-detection. Given the need to cover large grazing areas and ensure cattle visibility in each image, they adopt the count-by-detection approach. This involves first detecting cattle in individual images and then aggregating the results to estimate the total count.
In their study, the authors employ a DJI Phantom 4 UAV, weighing 1,380 g and capable of approximately 28 minutes of flight time. They use the UAV’s still photography mode to capture images with a maximum size of 4,000x3,000 pixels. The UAV supports live viewing during photography through the DJI GO 4 mobile application.
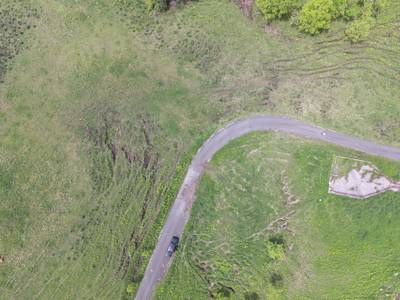
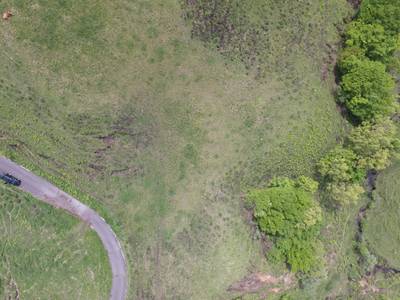
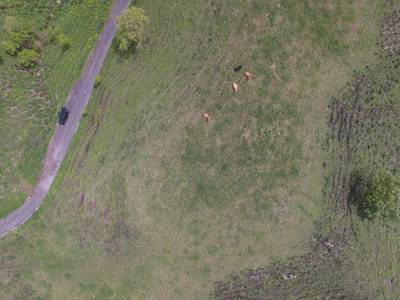
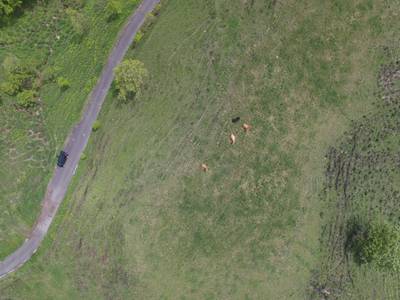
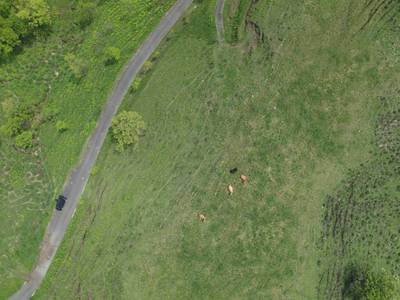
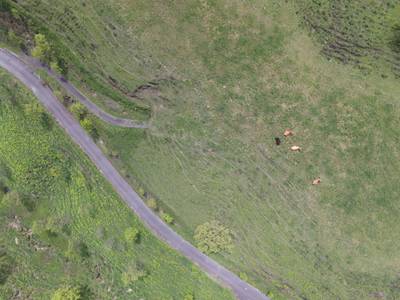
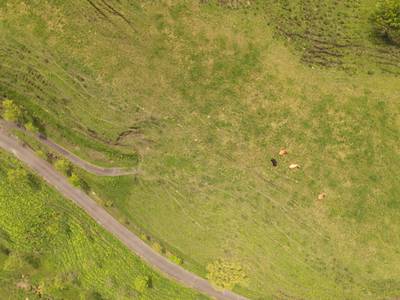
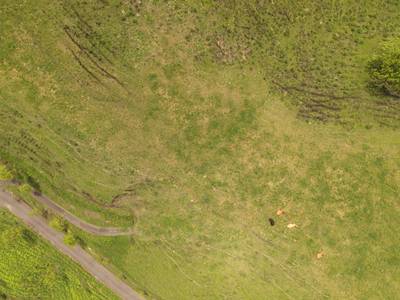
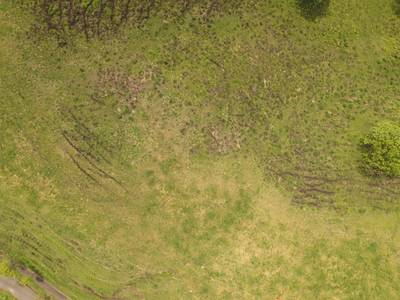
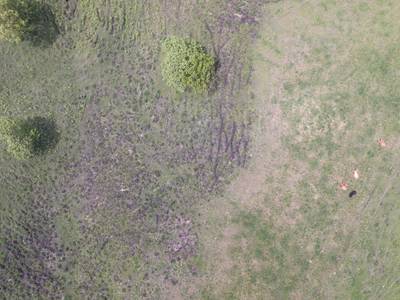
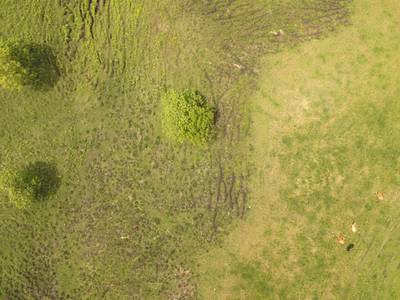
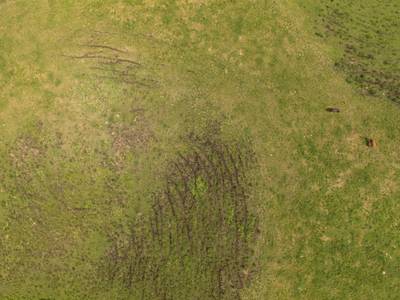
The dataset used in their research comprises two sets of pasture aerial images. Dataset1 consists of 656 images, captured on 18 May 2016, in Aso, Kumamoto, Japan, under sunny and clear weather conditions. The UAV was flown at an altitude of about 50 m during seven flights, labeled A to G. Each image covers an area of approximately 80 m x 60 m. Images were taken at 2-second intervals but sometimes had intervals of up to 12 seconds due to UAV turning. The images have an 80% overlap.
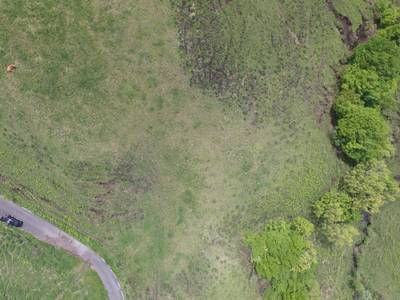
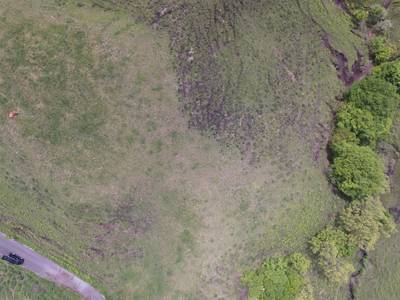
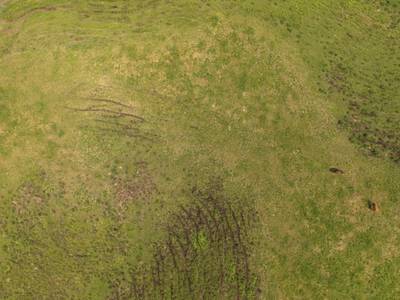
Dataset2 includes 14 images taken on 24 August 2016 during a single flight, also in sunny and clear conditions. This dataset covers a different area within the same pasture in Kumamoto, Japan. Images were captured every 6 seconds. The purpose of this dataset is to evaluate the robustness of the authors’ cattle detection and counting system.
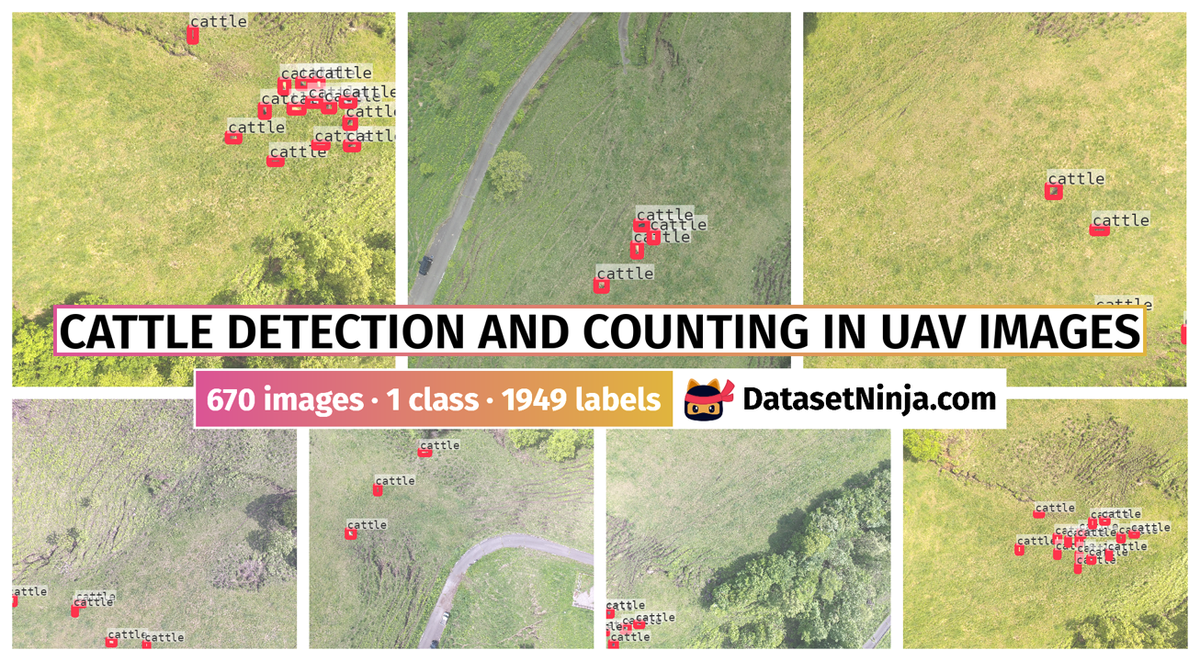
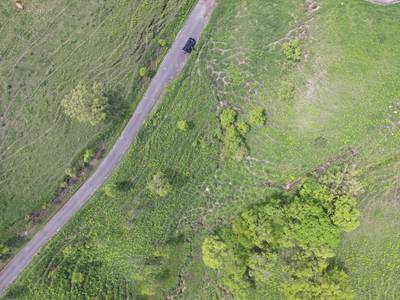
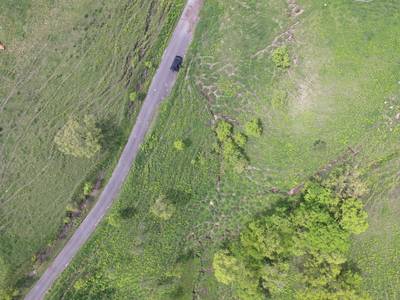
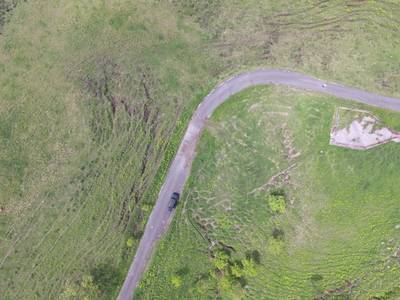
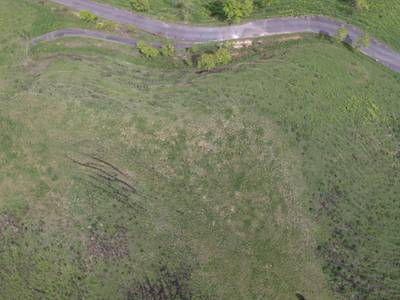
Figure 1. Examples of flight route and images in our two datasets. (a) shows one example of flight route. (b) shows examples of dataset 1. © shows examples of dataset 2.
For annotation purposes, the authors manually labeled all cattle in the images, providing details such as the top-left position, width, and height of the bounding boxes, data quality labels, and cattle IDs. The data quality label include Normal, Truncated, Blurred, and Occluded categories and examples of each label are provided. Multiple images of the same target were labeled with the same ID, allowing for individual cattle counting in each flight area. Flights F and G in Dataset1, containing more images, were divided into flight sections in the experiment. The areas covered by each flight section range from 1.5 to 5 hectares.
Dataset1 comprises 1,886 annotations of 212 individual cattle targets, while Dataset2 contains 62 annotations of 6 individual targets. The median cattle size is 87x90 pixels in Dataset1 and 59x101 pixels in Dataset2. The histogram of the longer edge length of cattle bounding boxes with the data quality label Normal in Dataset1 is presented. Among the 218 individual targets, 210 appeared in multiple images. The authors also assess the moving distance of cattle during each flight section, using body length as a reference.
 Homepage
 Research Paper
Summary #
Cattle Detection and Counting in UAV Images Based on Convolutional Neural Networks is a dataset for an object detection task. It is used in the livestock industry, and in the drone inspection domain.
The dataset consists of 670 images with 1949 labeled objects belonging to 1 single class (cattle).
Images in the Cattle Detection and Counting in UAV Images dataset have bounding box annotations. There are 340 (51% of the total) unlabeled images (i.e. without annotations). There are 2 splits in the dataset: Dataset1 (656 images) and Dataset2 (14 images). Additionally, every object contains information about cattle id, quality label (Normal, Truncated, Blurred, or Occluded), id conf (lack of confidence or high confidence). Explore them in supervisely labeling tool. The dataset was released in 2020 by the The University of Tokyo, Data61-CSIRO, and Kamiens Technology Inc.
Explore #
Cattle Detection and Counting in UAV Images dataset has 670 images. Click on one of the examples below or open "Explore" tool anytime you need to view dataset images with annotations. This tool has extended visualization capabilities like zoom, translation, objects table, custom filters and more. Hover the mouse over the images to hide or show annotations.


Class balance #
There are 1 annotation classes in the dataset. Find the general statistics and balances for every class in the table below. Click any row to preview images that have labels of the selected class. Sort by column to find the most rare or prevalent classes.

Class ㅤ | Images ㅤ | Objects ㅤ | Count on image average | Area on image average |
|---|---|---|---|---|
cattle➔ rectangle | 330 | 1949 | 5.91 | 0.37% |
Images #
Explore every single image in the dataset with respect to the number of annotations of each class it has. Click a row to preview selected image. Sort by any column to find anomalies and edge cases. Use horizontal scroll if the table has many columns for a large number of classes in the dataset.
Object distribution #
Interactive heatmap chart for every class with object distribution shows how many images are in the dataset with a certain number of objects of a specific class. Users can click cell and see the list of all corresponding images.
Class sizes #
The table below gives various size properties of objects for every class. Click a row to see the image with annotations of the selected class. Sort columns to find classes with the smallest or largest objects or understand the size differences between classes.
Class | Object count | Avg area | Max area | Min area | Min height | Min height | Max height | Max height | Avg height | Avg height | Min width | Min width | Max width | Max width |
|---|---|---|---|---|---|---|---|---|---|---|---|---|---|---|
cattle rectangle | 1949 | 0.06% | 0.16% | 0% | 15px | 0.5% | 169px | 5.63% | 89px | 2.97% | 18px | 0.45% | 168px | 4.2% |
Spatial Heatmap #
The heatmaps below give the spatial distributions of all objects for every class. These visualizations provide insights into the most probable and rare object locations on the image. It helps analyze objects' placements in a dataset.
Objects #
Table contains all 1949 objects. Click a row to preview an image with annotations, and use search or pagination to navigate. Sort columns to find outliers in the dataset.
Object ID ㅤ | Class ㅤ | Image name click row to open | Image size height x width | Height ㅤ | Height ㅤ | Width ㅤ | Width ㅤ | Area ㅤ |
|---|---|---|---|---|---|---|---|---|
1➔ | cattle rectangle | auto6_DJI_0081.JPG | 3000 x 4000 | 77px | 2.57% | 137px | 3.42% | 0.09% |
2➔ | cattle rectangle | auto6_DJI_0081.JPG | 3000 x 4000 | 61px | 2.03% | 121px | 3.02% | 0.06% |
3➔ | cattle rectangle | auto6_DJI_0081.JPG | 3000 x 4000 | 117px | 3.9% | 45px | 1.12% | 0.04% |
4➔ | cattle rectangle | auto6_DJI_0081.JPG | 3000 x 4000 | 89px | 2.97% | 73px | 1.82% | 0.05% |
5➔ | cattle rectangle | auto6_DJI_0081.JPG | 3000 x 4000 | 125px | 4.17% | 89px | 2.23% | 0.09% |
6➔ | cattle rectangle | auto6_DJI_0081.JPG | 3000 x 4000 | 101px | 3.37% | 113px | 2.83% | 0.1% |
7➔ | cattle rectangle | auto6_DJI_0081.JPG | 3000 x 4000 | 133px | 4.43% | 61px | 1.52% | 0.07% |
8➔ | cattle rectangle | auto6_DJI_0081.JPG | 3000 x 4000 | 81px | 2.7% | 97px | 2.42% | 0.07% |
9➔ | cattle rectangle | auto6_DJI_0081.JPG | 3000 x 4000 | 101px | 3.37% | 89px | 2.23% | 0.07% |
10➔ | cattle rectangle | auto6_DJI_0081.JPG | 3000 x 4000 | 109px | 3.63% | 69px | 1.73% | 0.06% |
License #
Cattle Detection and Counting in UAV Images Based on Convolutional Neural Networks is under CC BY-NC-ND 4.0 license.
Citation #
If you make use of the Cattle Detection and Counting in UAV Images data, please cite the following reference:
Cattle detection and counting in UAV images based on convolutional neural networks
Wen Shao, Rei Kawakami, Ryota Yoshihashi, Shaodi You, Hidemichi Kawase, Takeshi Naemura
International Journal of Remote Sensing, 41:1, 31-52,
DOI: 10.1080/01431161.2019.1624858 (2020)
If you are happy with Dataset Ninja and use provided visualizations and tools in your work, please cite us:
@misc{ visualization-tools-for-cattle-detection-and-counting-in-uav-images-dataset,
  title = { Visualization Tools for Cattle Detection and Counting in UAV Images Dataset },
  type = { Computer Vision Tools },
  author = { Dataset Ninja },
  howpublished = { \url{ https://datasetninja.com/cattle-detection-and-counting-in-uav-images } },
  url = { https://datasetninja.com/cattle-detection-and-counting-in-uav-images },
  journal = { Dataset Ninja },
  publisher = { Dataset Ninja },
  year = { 2026 },
  month = { jul },
  note = { visited on 2026-07-21 },
}
Download #
Dataset Cattle Detection and Counting in UAV Images can be downloaded in Supervisely format:
As an alternative, it can be downloaded with dataset-tools package:
pip install --upgrade dataset-tools
… using following python code:
import dataset_tools as dtools

dtools.download(dataset='Cattle Detection and Counting in UAV Images', dst_dir='~/dataset-ninja/')
Make sure not to overlook the python code example available on the Supervisely Developer Portal. It will give you a clear idea of how to effortlessly work with the downloaded dataset.
The data in original format can be downloaded here:
Disclaimer #
Our gal from the legal dep told us we need to post this:
Dataset Ninja provides visualizations and statistics for some datasets that can be found online and can be downloaded by general audience. Dataset Ninja is not a dataset hosting platform and can only be used for informational purposes. The platform does not claim any rights for the original content, including images, videos, annotations and descriptions. Joint publishing is prohibited.
You take full responsibility when you use datasets presented at Dataset Ninja, as well as other information, including visualizations and statistics we provide. You are in charge of compliance with any dataset license and all other permissions. You are required to navigate datasets homepage and make sure that you can use it. In case of any questions, get in touch with us at hello@datasetninja.com.