

Introduction #
The CBIS-DDSM: Curated Breast Imaging Subset of Digital Database for Screening Mammography includes decompressed images, data selection and curation by trained mammographers, updated mass segmentation and bounding boxes, and pathologic diagnosis for training data, formatted similarly to modern computer vision data sets. The data set contains 753 calcification cases and 891 mass cases, providing a data set size capable of analyzing decision support systems in mammography.
Authors mention that published research results are difficult to replicate due to the lack of a standard evaluation data set in the area of decision support systems in mammography; most computer-aided diagnosis (CADx) and detection (CADe) algorithms for breast cancer in mammography are evaluated on private data sets or on unspecified subsets of public databases. This causes an inability to directly compare the performance of methods or to replicate prior results. Authors seek to resolve this substantial challenge by releasing an updated and standardized version of the Digital Database for Screening Mammography (DDSM) for evaluation of future CADx and CADe systems (sometimes referred to generally as CAD) research in mammography.
The DDSM is a collection of mammograms from the following sources: Massachusetts General Hospital, Wake Forest University School of Medicine, Sacred Heart Hospital, and Washington University of St Louis School of Medicine. The DDSM was developed through a grant from the DOD Breast Cancer Research Program, US Army Research and Material Command, and the necessary patient consents were obtained by the original developers of the DDSM. The cases are annotated with ROIs for calcifications and masses, as well as the following information that may be useful for CADe and CADx algorithms: Breast Imaging Reporting and Data System (BI-RADS) descriptors for mass shape, mass margin, calcification type, calcification distribution, and breast density; overall BI-RADS assessment from 0 to 5; rating of the subtlety of the abnormality from 1 to 5; and patient age.
Mass segmentation
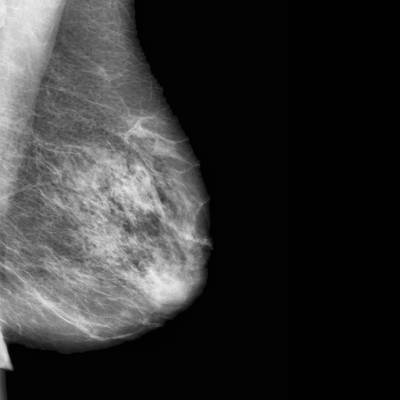
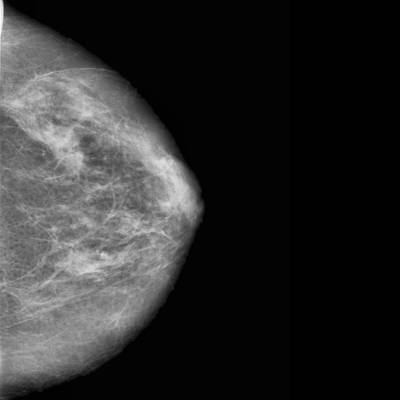
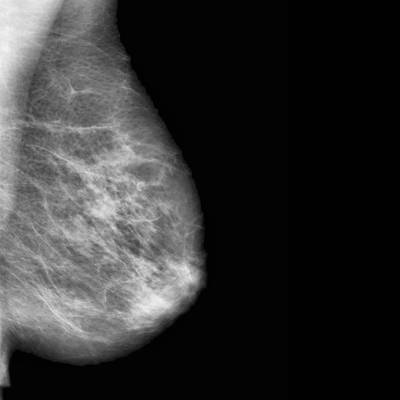
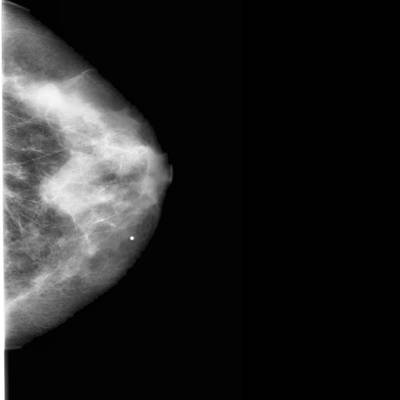
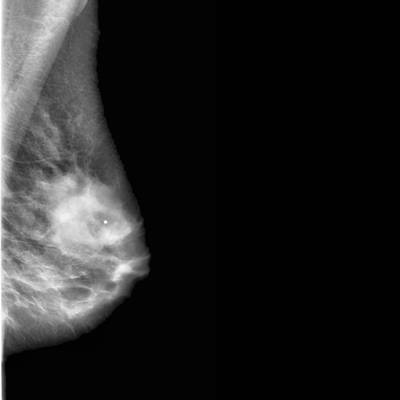
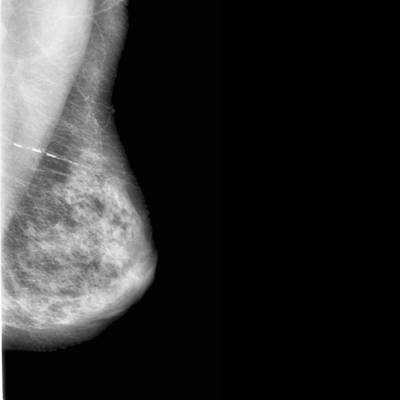
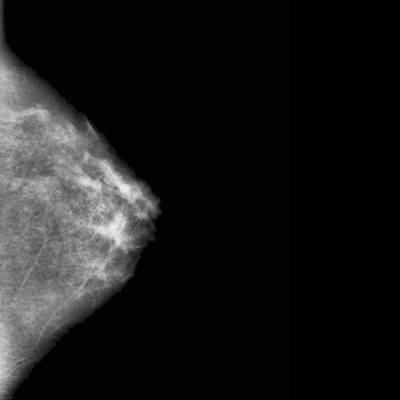
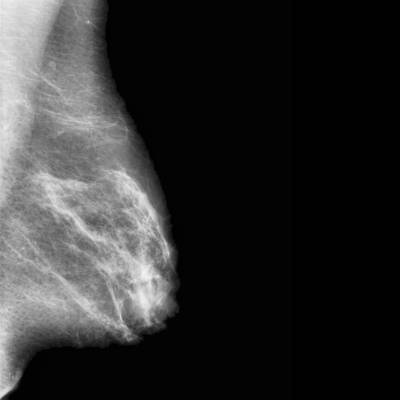
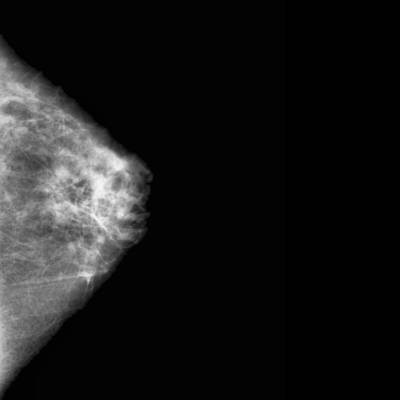
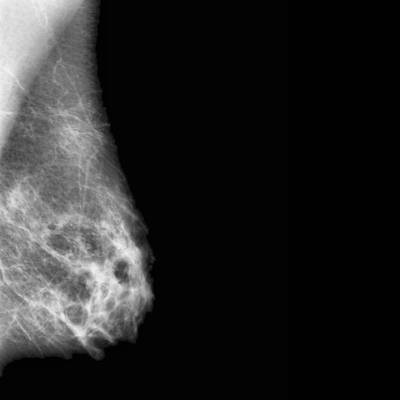
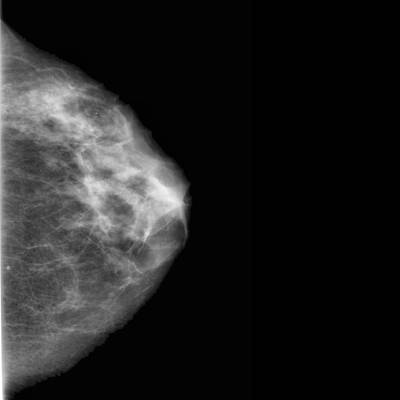
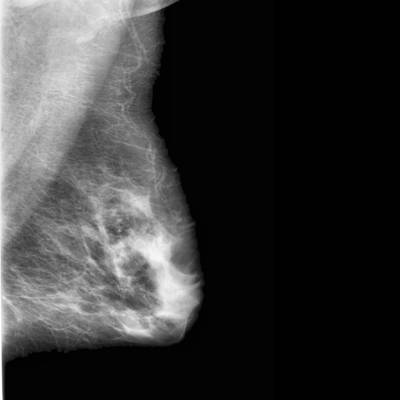
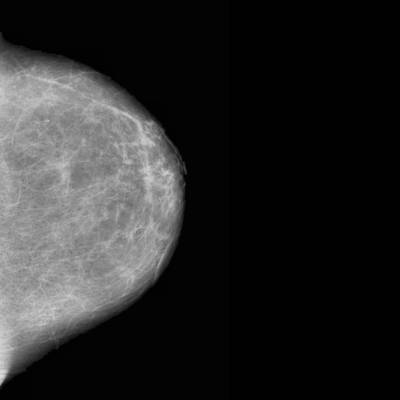
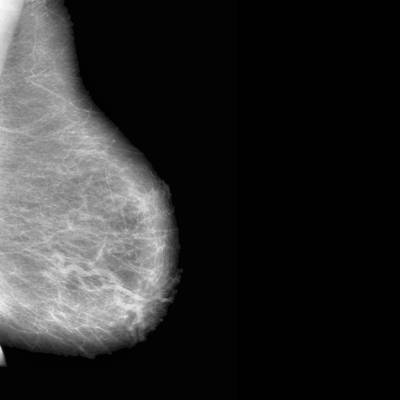
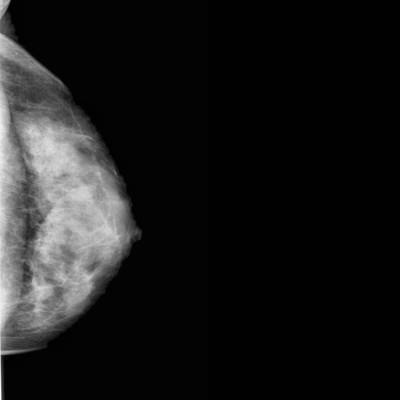
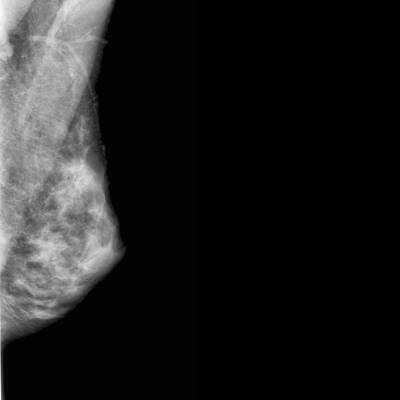
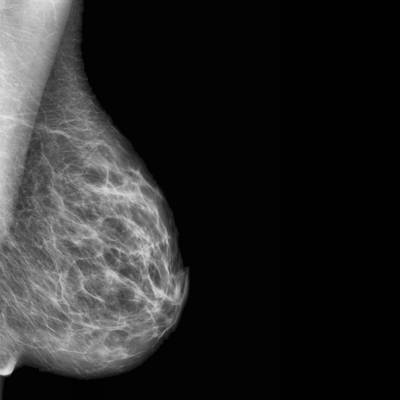
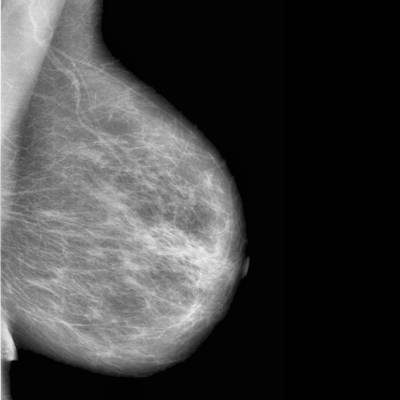
Mass margin and shape have long been proven substantial indicators for diagnosis in mammography. Because of this, many methods are based on developing mathematical descriptions of the tumour outline. Due to the dependence of these methods on accurate ROI segmentation and the imprecise nature of many of the DDSM-provided annotations, as seen in Fig. 1, we applied a lesion segmentation algorithm (described below) that is initialized by the general original DDSM contours but is able to supply much more accurate ROIs. Figure 1 contains example ROIs from the DDSM, our mammographer, and the automated segmentation algorithm. As shown, the DDSM outlines provide only a general location and not a precise mass boundary. The segmentation algorithm was designed to provide an exact delineation of the mass from the surrounding tissue. This segmentation was done only for masses and not calcifications.
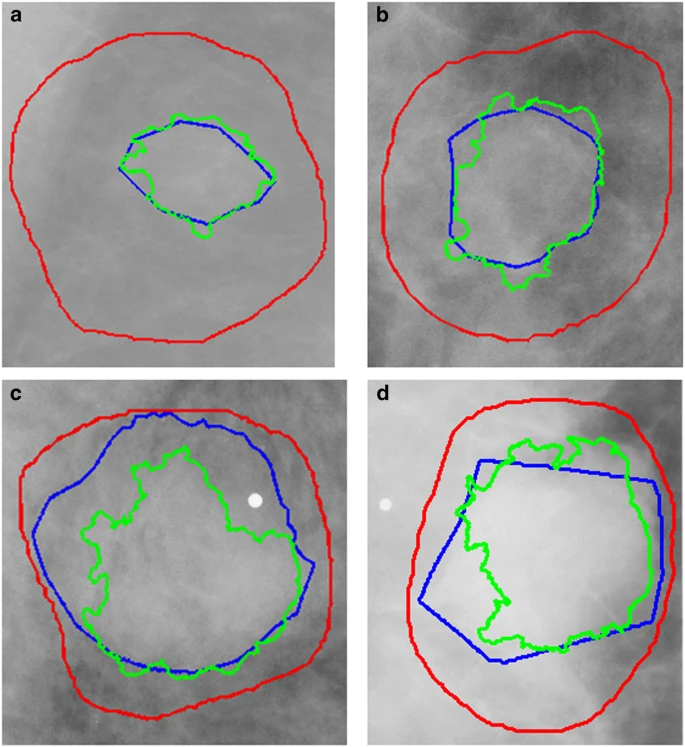
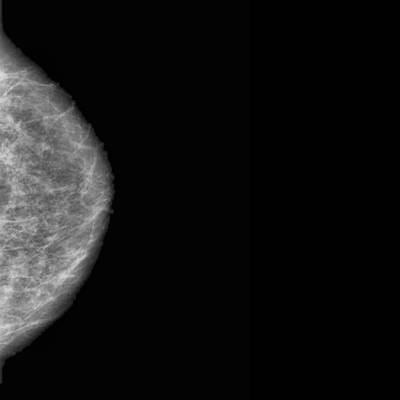
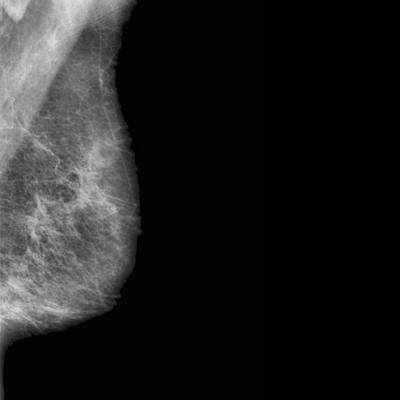
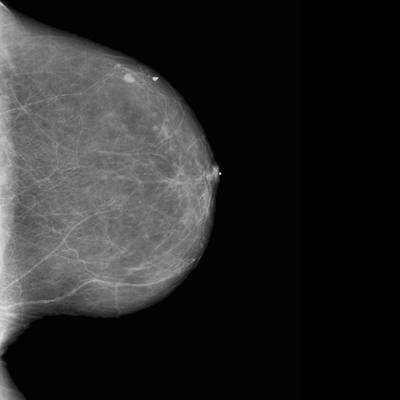
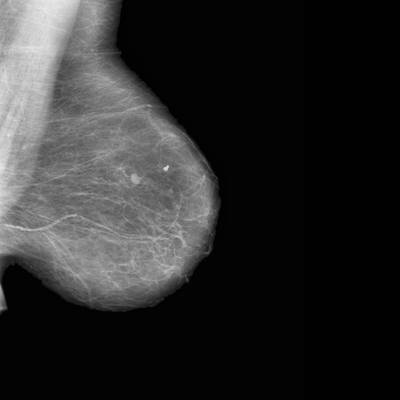
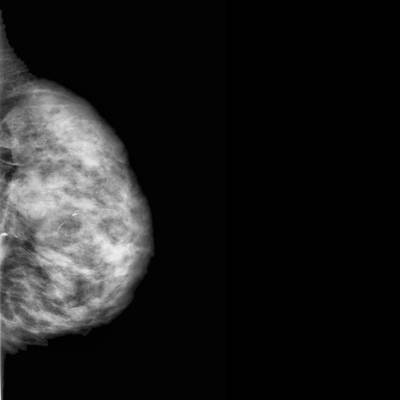
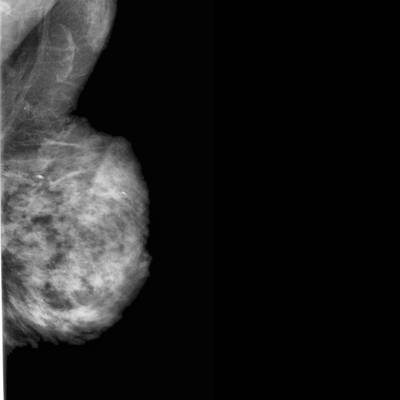
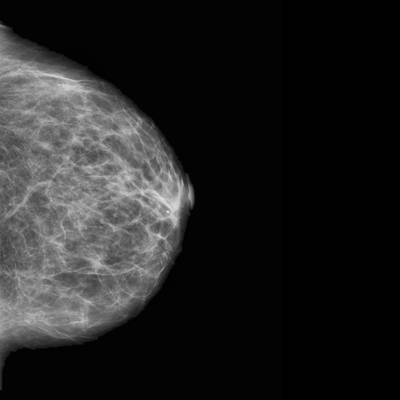
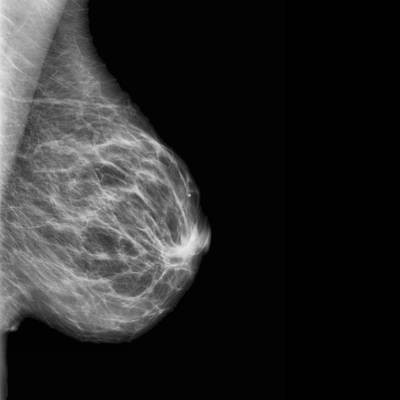
Figure 1. Example ROI outlines from each of the four BI-RADS density categories.
Standardized train/test splits
Separate sets of cases for training and testing algorithms are important for ensuring that all researchers are using the same cases for these tasks. Specifically, the test set should contain cases of varying difficulty in order to ensure that the method is tested thoroughly. The data were split into a training set and a testing set based on the BI-RADS category. This allows for an appropriate stratification for researchers working on CADe as well as CADx. Note that many of the BI-RADS assessments likely were updated after additional information was gathered by the physician, as it is unconventional to subscribe BI-RADS 4 and 5 to screening images. The split was obtained using 20% of the cases for testing and the rest for training. The data were split for all mass cases and all calcification cases separately. Here ‘case’ is used to indicate a particular abnormality, seen on the craniocaudal (CC) and/or mediolateral oblique (MLO) views, which are the standard views for screening mammography. Figure 2 displays the histograms of BI-RADS assessment and pathology for the training and test sets for calcification cases and mass cases. As shown, the data split was performed in such a way as to provide an equal level of difficulty in the training and test sets. Table 1 contains the number of benign and malignant cases for each set.
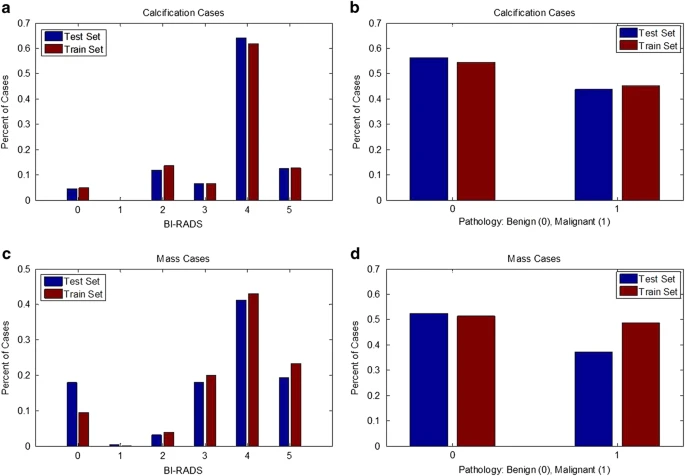
Figure 2. Histograms show the distribution of reading difficulty for training and test sets.
| Benign Cases | Malignant Cases | |
|---|---|---|
| Calcification Training Set | 329 cases (552 abnormalities) | 273 cases (304 abnormalities) |
| Calcification Test Set | 85 cases (112 abnormalities) | 66 cases (77 abnormalities) |
| Mass Training Set | 355 cases (387 abnormalities) | 336 cases (361 abnormalities) |
| Mass Training Set | 117 cases (135 abnormalities) | 83 cases (87 abnormalities) |
Table 1. Number of Cases and Abnormalities in the Training and Test Sets.
Data Records
The original images are distributed at the full mammography and abnormality level as DICOM files. Full mammography images include both MLO and CC views of the mammograms.
Metadata for each abnormality was transferred from the original csv files to tag format. For example:
-
Patient ID: the first 7 characters of images in the case file
-
Density category
-
Breast: Left or Right
-
View: CC or MLO
-
Mass shape (when applicable)
-
Mass margin (when applicable)
-
Calcification type (when applicable)
-
Calcification distribution (when applicable)
-
BI-RADS assessment
-
Pathology: Benign, Benign without call-back, or Malignant
Please note that the image data for this collection is structured such that each participant has multiple patient IDs. For example, participant 00038 has 10 separate patient IDs which provide information about the scans within the IDs (e.g. Calc-Test_P_00038_LEFT_CC, Calc-Test_P_00038_RIGHT_CC_1). This makes it appear as though there are 6,671 patients according to the DICOM metadata, but there are only 1,566 actual participants in the cohort.
 Homepage
 Research Paper
 Kaggle
Summary #
CBIS-DDSM: Curated Breast Imaging Subset of Digital Database for Screening Mammography is a dataset for instance segmentation, object detection, and semantic segmentation tasks. It is used in the medical industry.
The dataset consists of 3103 images with 3577 labeled objects belonging to 1 single class (abnormal_structure).
Images in the CBIS-DDSM dataset have pixel-level instance segmentation annotations. Due to the nature of the instance segmentation task, it can be automatically transformed into a semantic segmentation (only one mask for every class) or object detection (bounding boxes for every object) tasks. All images are labeled (i.e. with annotations). There are 2 splits in the dataset: train (2458 images) and test (645 images). Alternatively, the dataset could be split into 2 cases: mass (1592 images) and calcification (1511 images), or into 2 views: mlo (1643 images) and cc (1460 images), or into 2 breasts: left (1592 images) and right (1511 images), or into 3 pathologies: malignant (1367 images), benign (1336 images), and benign_without_callback (400 images), or into 6 BI-RADS assessments: assessment:4 (1544 images), assessment:5 (532 images), assessment:3 (429 images), assessment:2 (357 images), assessment:0 (239 images), and assessment:1 (2 images). Also, dataset includes calc_type, calc_distribution, mass_shape, mass_margins, breast_density, subtlety, patient_id tags. The dataset was released in 2017 by the Stanford University.
Explore #
CBIS-DDSM dataset has 3103 images. Click on one of the examples below or open "Explore" tool anytime you need to view dataset images with annotations. This tool has extended visualization capabilities like zoom, translation, objects table, custom filters and more. Hover the mouse over the images to hide or show annotations.


Class balance #
There are 1 annotation classes in the dataset. Find the general statistics and balances for every class in the table below. Click any row to preview images that have labels of the selected class. Sort by column to find the most rare or prevalent classes.

Class ㅤ | Images ㅤ | Objects ㅤ | Count on image average | Area on image average |
|---|---|---|---|---|
abnormal_structure➔ mask | 3103 | 3577 | 1.15 | 0.74% |
Images #
Explore every single image in the dataset with respect to the number of annotations of each class it has. Click a row to preview selected image. Sort by any column to find anomalies and edge cases. Use horizontal scroll if the table has many columns for a large number of classes in the dataset.
Object distribution #
Interactive heatmap chart for every class with object distribution shows how many images are in the dataset with a certain number of objects of a specific class. Users can click cell and see the list of all corresponding images.
Class sizes #
The table below gives various size properties of objects for every class. Click a row to see the image with annotations of the selected class. Sort columns to find classes with the smallest or largest objects or understand the size differences between classes.
Class | Object count | Avg area | Max area | Min area | Min height | Min height | Max height | Max height | Avg height | Avg height | Min width | Min width | Max width | Max width |
|---|---|---|---|---|---|---|---|---|---|---|---|---|---|---|
abnormal_structure mask | 3577 | 0.64% | 29.37% | 0% | 4px | 0.08% | 3801px | 73.45% | 373px | 7.85% | 4px | 0.09% | 2839px | 54.7% |
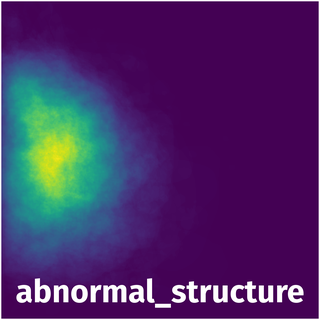
Spatial Heatmap #
The heatmaps below give the spatial distributions of all objects for every class. These visualizations provide insights into the most probable and rare object locations on the image. It helps analyze objects' placements in a dataset.
Objects #
Table contains all 3577 objects. Click a row to preview an image with annotations, and use search or pagination to navigate. Sort columns to find outliers in the dataset.
Object ID ㅤ | Class ㅤ | Image name click row to open | Image size height x width | Height ㅤ | Height ㅤ | Width ㅤ | Width ㅤ | Area ㅤ |
|---|---|---|---|---|---|---|---|---|
1➔ | abnormal_structure mask | Mass-Test_P_00928_RIGHT_CC_FULL_PRE.png | 4217 x 4217 | 332px | 7.87% | 292px | 6.92% | 0.36% |
2➔ | abnormal_structure mask | Calc-Test_P_02102_LEFT_CC_FULL_PRE.png | 4955 x 4955 | 1541px | 31.1% | 1765px | 35.62% | 6.73% |
3➔ | abnormal_structure mask | Mass-Test_P_00230_RIGHT_CC_FULL_PRE.png | 5701 x 5701 | 180px | 3.16% | 229px | 4.02% | 0.09% |
4➔ | abnormal_structure mask | Calc-Test_P_00466_LEFT_MLO_FULL_PRE.png | 4121 x 4121 | 225px | 5.46% | 265px | 6.43% | 0.26% |
5➔ | abnormal_structure mask | Calc-Test_P_01253_RIGHT_MLO_FULL_PRE.png | 4845 x 4845 | 601px | 12.4% | 470px | 9.7% | 0.98% |
6➔ | abnormal_structure mask | Calc-Test_P_01318_LEFT_MLO_FULL_PRE.png | 5052 x 5052 | 185px | 3.66% | 129px | 2.55% | 0.07% |
7➔ | abnormal_structure mask | Calc-Test_P_01773_RIGHT_MLO_FULL_PRE.png | 5417 x 5417 | 361px | 6.66% | 393px | 7.25% | 0.32% |
8➔ | abnormal_structure mask | Calc-Test_P_01407_LEFT_MLO_FULL_PRE.png | 4143 x 4143 | 281px | 6.78% | 281px | 6.78% | 0.33% |
9➔ | abnormal_structure mask | Calc-Test_P_01217_RIGHT_MLO_FULL_PRE.png | 4735 x 4735 | 281px | 5.93% | 433px | 9.14% | 0.4% |
10➔ | abnormal_structure mask | Mass-Test_P_00156_RIGHT_MLO_FULL_PRE.png | 4173 x 4173 | 363px | 8.7% | 476px | 11.41% | 0.54% |
License #
Curated Breast Imaging Subset of Digital Database for Screening Mammography is under CC BY 4.0 license.
Citation #
If you make use of the CBIS-DDSM data, please cite the following reference:
Sawyer-Lee, R., Gimenez, F., Hoogi, A., & Rubin, D. (2016). Curated
Breast Imaging Subset of Digital Database for Screening Mammography
(CBIS-DDSM) [Data set]. The Cancer Imaging Archive. https://doi.org/10.
7937/K9/TCIA.2016.7O02S9CY

Lee, R. S., Gimenez, F., Hoogi, A., Miyake, K. K., Gorovoy, M., & Rubin,
D. L. (2017). A curated mammography data set for use in computer-aided
detection and diagnosis research. In Scientific Data (Vol. 4, Issue 1).
Springer Science and Business Media LLC. https://doi.org/10.1038/sdata.
2017.177

Clark, K., Vendt, B., Smith, K., Freymann, J., Kirby, J., Koppel, P.,
Moore, S., Phillips, S., Maffitt, D., Pringle, M., Tarbox, L., & Prior,
F. (2013). The Cancer Imaging Archive (TCIA): Maintaining and Operating a
Public Information Repository. In Journal of Digital Imaging (Vol. 26,
Issue 6, pp. 1045–1057). Springer Science and Business Media LLC. https://
doi.org/10.1007/s10278-013-9622-7
If you are happy with Dataset Ninja and use provided visualizations and tools in your work, please cite us:
@misc{ visualization-tools-for-cbis-ddsm-dataset,
  title = { Visualization Tools for CBIS-DDSM Dataset },
  type = { Computer Vision Tools },
  author = { Dataset Ninja },
  howpublished = { \url{ https://datasetninja.com/cbis-ddsm } },
  url = { https://datasetninja.com/cbis-ddsm },
  journal = { Dataset Ninja },
  publisher = { Dataset Ninja },
  year = { 2026 },
  month = { jul },
  note = { visited on 2026-07-20 },
}
Download #
Dataset CBIS-DDSM can be downloaded in Supervisely format:
As an alternative, it can be downloaded with dataset-tools package:
pip install --upgrade dataset-tools
… using following python code:
import dataset_tools as dtools

dtools.download(dataset='CBIS-DDSM', dst_dir='~/dataset-ninja/')
Make sure not to overlook the python code example available on the Supervisely Developer Portal. It will give you a clear idea of how to effortlessly work with the downloaded dataset.
Disclaimer #
Our gal from the legal dep told us we need to post this:
Dataset Ninja provides visualizations and statistics for some datasets that can be found online and can be downloaded by general audience. Dataset Ninja is not a dataset hosting platform and can only be used for informational purposes. The platform does not claim any rights for the original content, including images, videos, annotations and descriptions. Joint publishing is prohibited.
You take full responsibility when you use datasets presented at Dataset Ninja, as well as other information, including visualizations and statistics we provide. You are in charge of compliance with any dataset license and all other permissions. You are required to navigate datasets homepage and make sure that you can use it. In case of any questions, get in touch with us at hello@datasetninja.com.