

Introduction #
The creators of the CCAgT: Images of Cervical Cells with AgNOR Stain Technique dataset emphasize the significance of cervical cancer, a major health concern for women as the second most prevalent cancer. The dataset comprises 9,339 images with a resolution of 1600×1200 pixels, where each pixel measures 0.111µm x 0.111µm. These images are extracted from 15 different slides stained with the AgNOR (Argyrophilic Nucleolar Organizer Regions) technique and include at least one label per image, totaling over sixty-three thousand annotations.
Early detection methods are imperative to combat this deadly disease. Cytology stands as a promising noninvasive alternative to biopsy for diagnosing malignant lesions, providing essential insights into cell characteristics. The process involves staining slides to visualize cell nuclei for accurate diagnosis. This dataset explores the use of silver-stained slides, specifically employing the AgNOR method, which exhibits substantial potential for diagnosing lesion malignancy. It’s important to note that this method remains underexplored, especially in the context of computational approaches.
Factors contributing to this challenge include inadequate or nonexistent screening measures leading to late-stage detection and limited availability or affordability of standard treatment options. Infection by the Human Papillomavirus (HPV) serves as a primary cause of cervical cancer. Early detection and appropriate treatment can result in a cure; however, early detection remains a formidable task. Biopsy remains the gold standard for cancer and pre-cancerous lesion detection, although its invasive nature limits its use to extreme cases.
The authors note that cancer cells typically exhibit abnormal DNA content, a condition known as aneuploidy, which is associated with tumorigenesis. Increased protein synthesis in aneuploid cells characterizes the transition from normal to malignant cells. Argyrophilic Nucleolar Organizer Regions (AgNORs) can serve as valuable markers for quantifying cell proliferation, differentiation, and malignant transformation. AgNORs offer the advantage of simplicity and cost-effectiveness in detecting cell proliferation. Reports highlight the diagnostic and prognostic potential of AgNORs in cervical cytology. One diagnostic approach involves counting NORs, which are easily identifiable through the AgNOR staining technique. NORs are loops of DNA in cell nuclei containing ribosomal RNA genes, making them identifiable through AgNOR staining due to their interaction with argyrophilic nuclear proteins. While manual evaluation of AgNORs is commonly practised, it is prone to issues like variation in visual perception, varying levels of cytologist expertise, slow processing times, and human errors.
The methodology of gaining the images encompasses several key steps. Initially, fields are generated from whole-slide images, followed by data splitting into training (52%), validation (35%), and test (13%) sets. Note, that splits are not pre-defined. The next step involves training a neural network, and finally, the results are evaluated.
The images were obtained from examinations conducted on women treated at the Gynecology and Colposcopy Outpatient Clinic at the Federal University of Santa Catarina (HU-UFSC). These women had cytological alterations in previous exams, leading to further gynecological exams, colposcopy, and biopsies. For image acquisition, a ZEISS Axio Scanner.Z1 with a Hitachi HV-F202SCL as the imaging device was utilized. Image processing resulted in single image files with dimensions of approximately 232,000 x 169,000 pixels, with pixel dimensions of 0.111μm x 0.111μm. Image fields were generated, and a histogram analysis was performed to eliminate fields corresponding to slide borders.
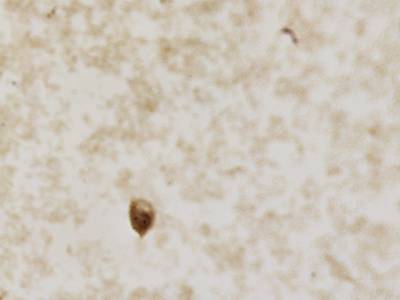
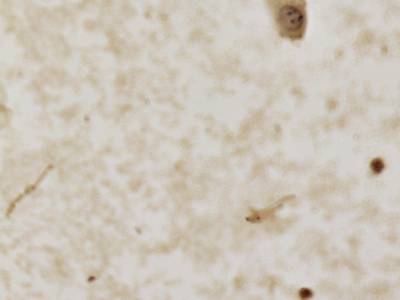
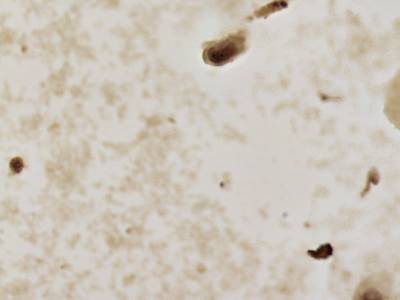
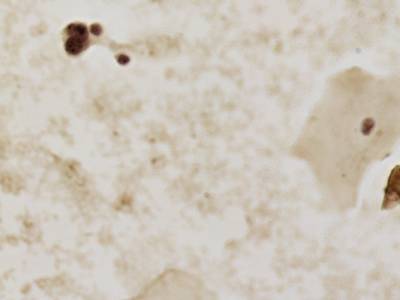
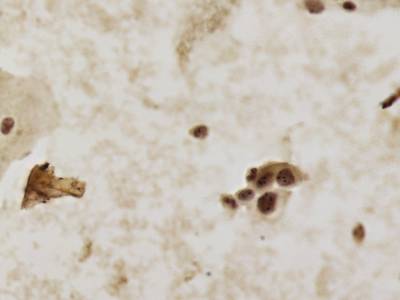
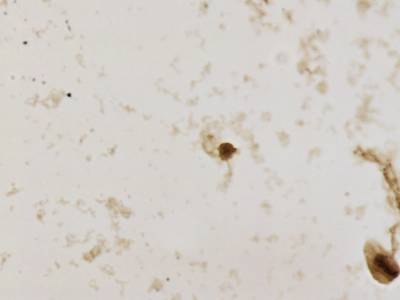
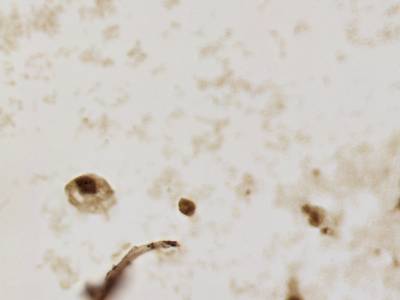
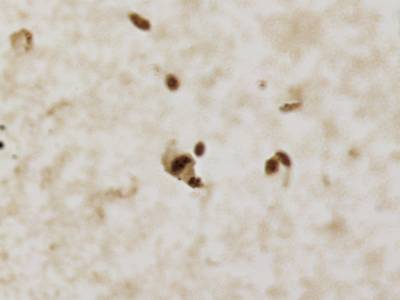
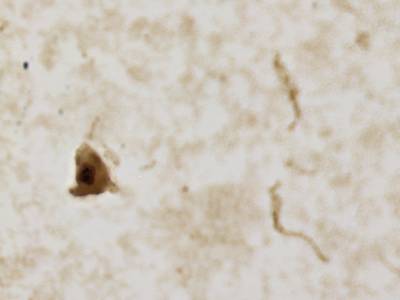
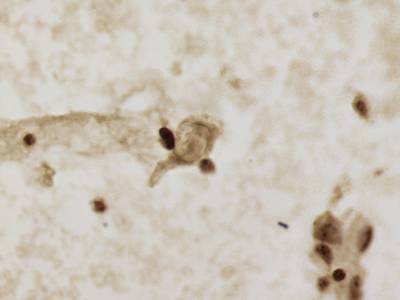
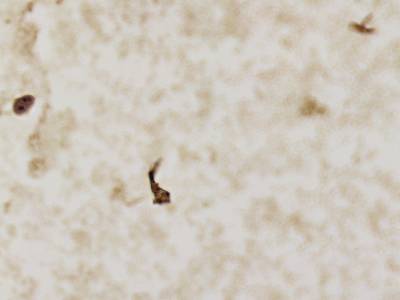
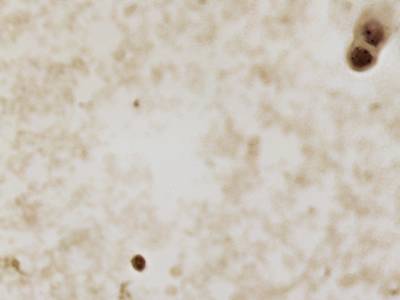
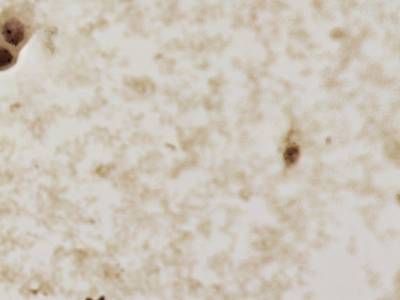
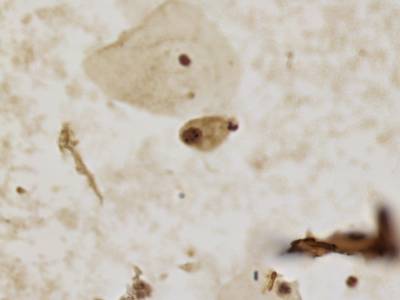
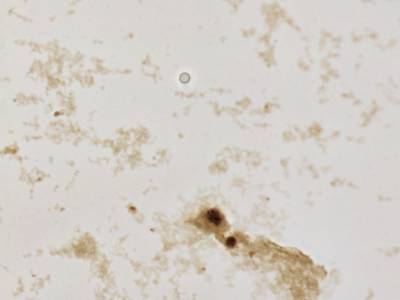
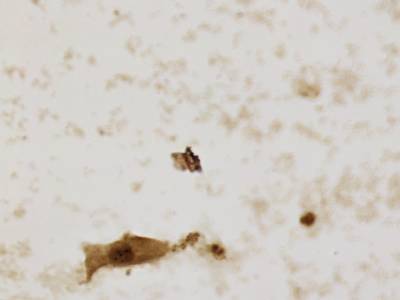
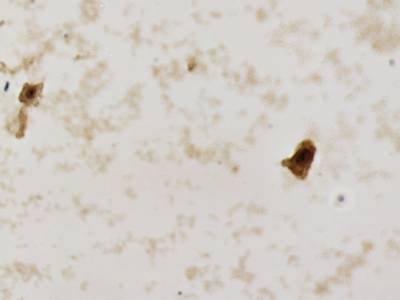
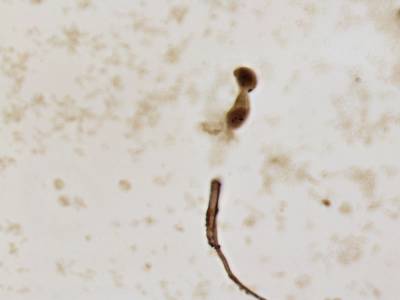
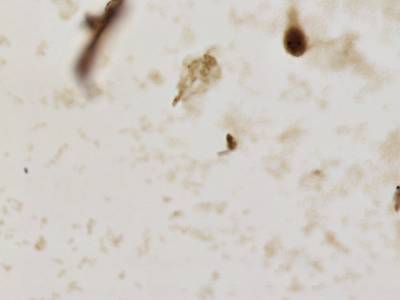
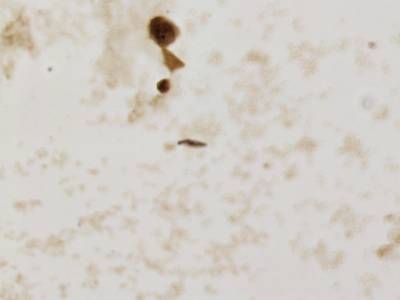
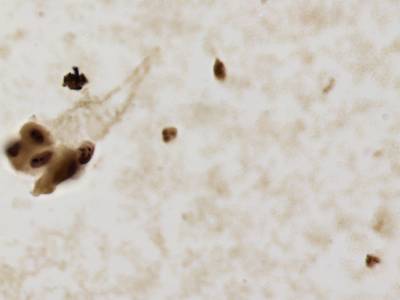
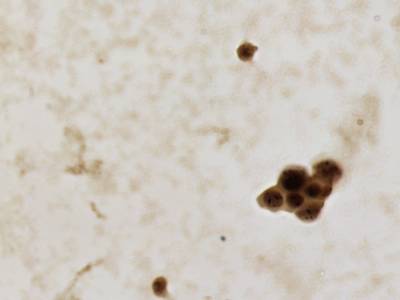
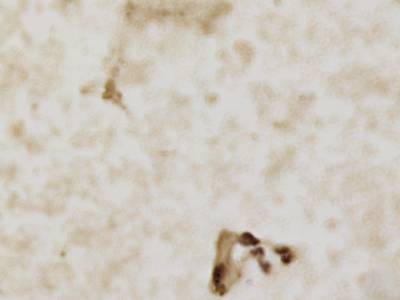
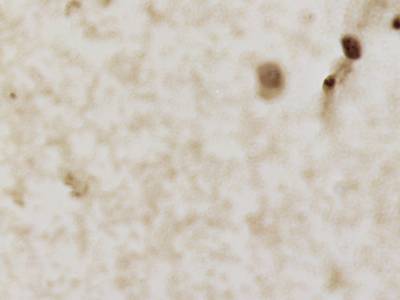
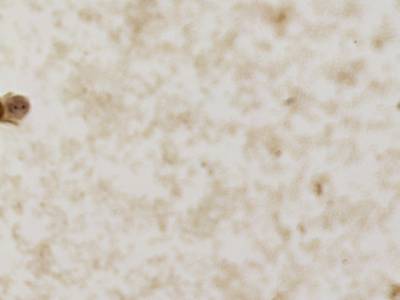
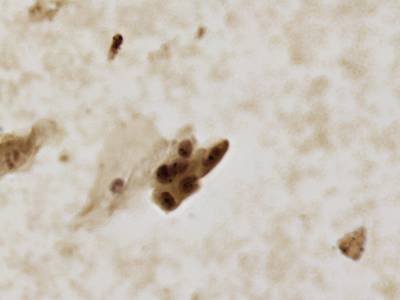
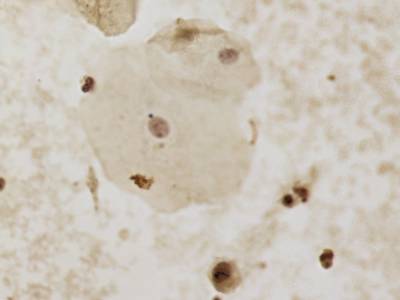
There are three categories labeled with corresponding classes: nucleus, cluster, and satellite
Random AgNOR subimages. Nuclei are labeled with yellow dashes, clusters with green and satellites are denoted by blue dashes. All unlabeled regions were considered to belong to “background class”.
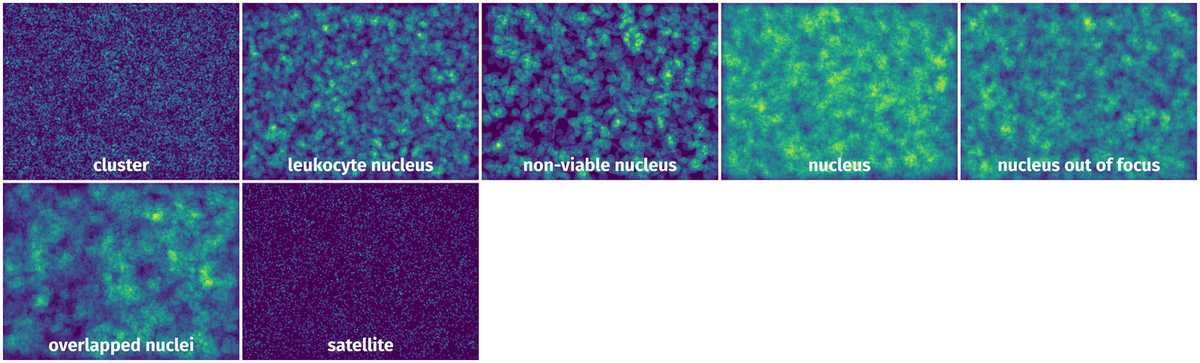
In version 2, there are a total of 7 categories with added distinctions between previous classes: nucleus out of focus, overlapped nuclei, non-viable nucleus, and leukocyte nucleus.
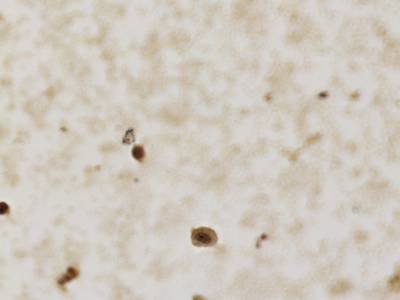
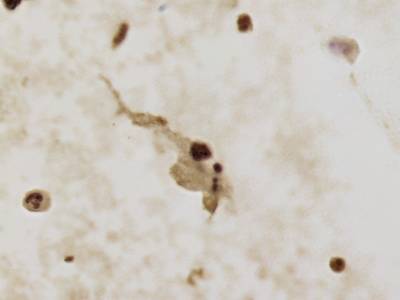
Each slide can have some differences in the stain coloration, it can be seen that an image created from different images of different slides:
The research was approved by the UFSC Research Ethics Committee (CEPSH), protocol number 57423616.3.0000.0121. All patients involved were informed about the objectives of the study, and those who agreed to participate signed an informed consent form.
 Homepage
 Research Paper 1 (main)Research Paper 2
 GitHub
Summary #
CCAgT: Images of Cervical Cells with AgNOR Stain Technique v2.0 is a dataset for instance segmentation, semantic segmentation, and object detection tasks. It is used in the biomedical research.
The dataset consists of 9090 images with 59036 labeled objects belonging to 7 different classes including nucleus, cluster, nucleus out of focus, and other: satellite, leukocyte nucleus, non-viable nucleus, and overlapped nuclei.
Images in the CCAgT dataset have pixel-level instance segmentation annotations. Due to the nature of the instance segmentation task, it can be automatically transformed into a semantic segmentation (only one mask for every class) or object detection (bounding boxes for every object) tasks. All images are labeled (i.e. with annotations). There are no pre-defined train/val/test splits in the dataset. The dataset was released in 2022 by the Universidade Federal de Santa Catarina, Brazil.
Here is the visualized example grid with animated annotations:
Explore #
CCAgT dataset has 9090 images. Click on one of the examples below or open "Explore" tool anytime you need to view dataset images with annotations. This tool has extended visualization capabilities like zoom, translation, objects table, custom filters and more. Hover the mouse over the images to hide or show annotations.


Class balance #
There are 7 annotation classes in the dataset. Find the general statistics and balances for every class in the table below. Click any row to preview images that have labels of the selected class. Sort by column to find the most rare or prevalent classes.

Class ㅤ | Images ㅤ | Objects ㅤ | Count on image average | Area on image average |
|---|---|---|---|---|
nucleus➔ mask | 5466 | 12904 | 2.36 | 0.51% |
cluster➔ mask | 5091 | 24078 | 4.73 | 0.03% |
nucleus out of focus➔ mask | 4417 | 8906 | 2.02 | 0.39% |
satellite➔ mask | 2897 | 6144 | 2.12 | 0.01% |
leukocyte nucleus➔ mask | 2000 | 4424 | 2.21 | 0.2% |
non-viable nucleus➔ mask | 878 | 1331 | 1.52 | 0.25% |
overlapped nuclei➔ mask | 697 | 1249 | 1.79 | 0.86% |
Co-occurrence matrix #
Co-occurrence matrix is an extremely valuable tool that shows you the images for every pair of classes: how many images have objects of both classes at the same time. If you click any cell, you will see those images. We added the tooltip with an explanation for every cell for your convenience, just hover the mouse over a cell to preview the description.
Images #
Explore every single image in the dataset with respect to the number of annotations of each class it has. Click a row to preview selected image. Sort by any column to find anomalies and edge cases. Use horizontal scroll if the table has many columns for a large number of classes in the dataset.
Object distribution #
Interactive heatmap chart for every class with object distribution shows how many images are in the dataset with a certain number of objects of a specific class. Users can click cell and see the list of all corresponding images.
Class sizes #
The table below gives various size properties of objects for every class. Click a row to see the image with annotations of the selected class. Sort columns to find classes with the smallest or largest objects or understand the size differences between classes.
Class | Object count | Avg area | Max area | Min area | Min height | Min height | Max height | Max height | Avg height | Avg height | Min width | Min width | Max width | Max width |
|---|---|---|---|---|---|---|---|---|---|---|---|---|---|---|
cluster mask | 24078 | 0% | 0.08% | 0% | 4px | 0.33% | 67px | 5.58% | 12px | 0.99% | 4px | 0.25% | 57px | 3.56% |
nucleus mask | 12904 | 0.21% | 1.49% | 0% | 1px | 0.08% | 330px | 27.5% | 74px | 6.2% | 1px | 0.06% | 304px | 19% |
nucleus out of focus mask | 8906 | 0.19% | 0.98% | 0.02% | 14px | 1.17% | 196px | 16.33% | 69px | 5.72% | 15px | 0.94% | 190px | 11.88% |
satellite mask | 6144 | 0% | 0.01% | 0% | 8px | 0.67% | 21px | 1.75% | 11px | 0.9% | 9px | 0.56% | 28px | 1.75% |
leukocyte nucleus mask | 4424 | 0.09% | 0.69% | 0.01% | 14px | 1.17% | 143px | 11.92% | 47px | 3.94% | 17px | 1.06% | 149px | 9.31% |
non-viable nucleus mask | 1331 | 0.17% | 0.82% | 0.02% | 17px | 1.42% | 184px | 15.33% | 66px | 5.48% | 23px | 1.44% | 172px | 10.75% |
overlapped nuclei mask | 1249 | 0.48% | 8.21% | 0% | 1px | 0.08% | 1034px | 86.17% | 111px | 9.27% | 1px | 0.06% | 614px | 38.38% |
Spatial Heatmap #
The heatmaps below give the spatial distributions of all objects for every class. These visualizations provide insights into the most probable and rare object locations on the image. It helps analyze objects' placements in a dataset.
Objects #
Table contains all 59036 objects. Click a row to preview an image with annotations, and use search or pagination to navigate. Sort columns to find outliers in the dataset.
Object ID ㅤ | Class ㅤ | Image name click row to open | Image size height x width | Height ㅤ | Height ㅤ | Width ㅤ | Width ㅤ | Area ㅤ |
|---|---|---|---|---|---|---|---|---|
1➔ | nucleus mask | K_1918_-188640_44280.jpg | 1200 x 1600 | 78px | 6.5% | 81px | 5.06% | 0.26% |
2➔ | nucleus mask | K_1918_-188640_44280.jpg | 1200 x 1600 | 71px | 5.92% | 82px | 5.12% | 0.24% |
3➔ | cluster mask | K_1918_-188640_44280.jpg | 1200 x 1600 | 10px | 0.83% | 15px | 0.94% | 0.01% |
4➔ | satellite mask | K_1918_-188640_44280.jpg | 1200 x 1600 | 11px | 0.92% | 11px | 0.69% | 0% |
5➔ | nucleus out of focus mask | K_1918_-188640_44280.jpg | 1200 x 1600 | 61px | 5.08% | 62px | 3.88% | 0.15% |
6➔ | nucleus out of focus mask | K_1918_-188640_44280.jpg | 1200 x 1600 | 67px | 5.58% | 66px | 4.12% | 0.18% |
7➔ | nucleus out of focus mask | E_18831_-200160_156600.jpg | 1200 x 1600 | 60px | 5% | 42px | 2.62% | 0.1% |
8➔ | nucleus mask | H_9377_-259200_88560.jpg | 1200 x 1600 | 77px | 6.42% | 72px | 4.5% | 0.22% |
9➔ | satellite mask | H_9377_-259200_88560.jpg | 1200 x 1600 | 11px | 0.92% | 11px | 0.69% | 0% |
10➔ | satellite mask | H_9377_-259200_88560.jpg | 1200 x 1600 | 11px | 0.92% | 11px | 0.69% | 0% |
License #
CCAgT: Images of Cervical Cells with AgNOR Stain Technique v2.0 is under CC BY-NC 3.0 license.
Citation #
If you make use of the CCAgT data, please cite the following reference:
Atkinson Amorim, João Gustavo; Matias, André; Bottamedi, Tainee; Sanches, Vinícius; Costa, Ane Francyne; Onofre, Fabiana; Onofre, Alexandre; Wangenheim, Aldo (2022),
“CCAgT: Images of Cervical Cells with AgNOR Stain Technique”,
Mendeley Data, V2,
doi: 10.17632/wg4bpm33hj.2
If you are happy with Dataset Ninja and use provided visualizations and tools in your work, please cite us:
@misc{ visualization-tools-for-ccagt-dataset,
  title = { Visualization Tools for CCAgT Dataset },
  type = { Computer Vision Tools },
  author = { Dataset Ninja },
  howpublished = { \url{ https://datasetninja.com/ccagt } },
  url = { https://datasetninja.com/ccagt },
  journal = { Dataset Ninja },
  publisher = { Dataset Ninja },
  year = { 2026 },
  month = { jul },
  note = { visited on 2026-07-23 },
}
Download #
Dataset CCAgT can be downloaded in Supervisely format:
As an alternative, it can be downloaded with dataset-tools package:
pip install --upgrade dataset-tools
… using following python code:
import dataset_tools as dtools

dtools.download(dataset='CCAgT', dst_dir='~/dataset-ninja/')
Make sure not to overlook the python code example available on the Supervisely Developer Portal. It will give you a clear idea of how to effortlessly work with the downloaded dataset.
The data in original format can be downloaded here.
Disclaimer #
Our gal from the legal dep told us we need to post this:
Dataset Ninja provides visualizations and statistics for some datasets that can be found online and can be downloaded by general audience. Dataset Ninja is not a dataset hosting platform and can only be used for informational purposes. The platform does not claim any rights for the original content, including images, videos, annotations and descriptions. Joint publishing is prohibited.
You take full responsibility when you use datasets presented at Dataset Ninja, as well as other information, including visualizations and statistics we provide. You are in charge of compliance with any dataset license and all other permissions. You are required to navigate datasets homepage and make sure that you can use it. In case of any questions, get in touch with us at hello@datasetninja.com.