
Introduction #
Cityscapes is a benchmark suite and large-scale dataset aimed at training and testing approaches for pixel-level and instance-level semantic labeling for complex real-world urban scenes. Cityscapes encompasses a diverse set of stereo video sequences recorded in streets from 50 different cities, with 5000 images having high-quality pixel-level annotations and an additional 20,000 images having coarse annotations to support methods leveraging weakly-labeled data. Notably, the efforts of the authors surpass previous attempts in terms of dataset size, annotation richness, scene variability, and complexity. They also conducted an empirical study that provided an in-depth analysis of the dataset characteristics and evaluated the performance of several state-of-the-art approaches using their benchmark.
The data recording and annotation methodology were meticulously designed by the authors to capture the high variability of outdoor street scenes. They acquired several hundreds of thousands of frames from a moving vehicle over several months, covering different seasons in 50 cities primarily in Germany and neighboring countries. The authors intentionally avoided recording in adverse weather conditions such as heavy rain or snow, as they believed specialized techniques and datasets would be required for such conditions.
The authors used a camera system and post-processing techniques that represented the current state-of-the-art in the automotive domain. The images were recorded using an automotive-grade 22 cm baseline stereo camera equipped with 1/3-inch CMOS 2 MP sensors (OnSemi AR0331) with rolling shutters at a frame rate of 17 Hz. The sensors, mounted behind the windshield, produced high dynamic-range (HDR) images with 16 bits linear color depth. Each 16-bit stereo image pair underwent subsequent debayering and rectification. The authors relied on extrinsic and intrinsic calibration methods from a referenced source to ensure calibration accuracy, re-calibrating on-site before each recording session.
To maintain comparability and compatibility with existing datasets, the authors also provided low dynamic-range (LDR) 8-bit RGB images obtained through logarithmic compression curves. Such tone mappings were common in automotive vision, as they could be computed efficiently and independently for each pixel. For optimal annotation quality, the authors applied a separate tone mapping to each image, resulting in less realistic but visually more pleasing images, which proved easier to annotate. From the 27 cities, the authors manually selected 5000 images for dense pixel-level annotation, aiming for diversity in foreground objects, background, and overall scene layout. Annotations were performed on the 20th frame of a 30-frame video snippet, and the full snippet was provided to offer context information. For the remaining 23 cities, the authors selected a single image every 20 seconds or 20 meters of driving distance, whichever came first, resulting in a total of 20,000 images with coarse annotations.
Within DatasetNinja, the statistics for the 5000 images version were calculated.
 Homepage
 Research Paper
Summary #
Cityscapes (5000 Images) is a dataset for instance segmentation, object detection, and semantic segmentation tasks. It is used in the automotive industry.
The dataset consists of 5000 images with 287540 labeled objects belonging to 40 different classes including ego vehicle, out of roi, static, and other: pole, building, road, vegetation, car, sidewalk, traffic sign, sky, person, license plate, terrain, traffic light, bicycle, rectification border, dynamic, fence, ground, rider, wall, cargroup, parking, bicyclegroup, motorcycle, persongroup, truck, bus, polegroup, bridge, train, rail track, trailer, caravan, tunnel, guard rail, ridergroup, motorcyclegroup, and truckgroup.
Images in the Cityscapes dataset have pixel-level instance segmentation annotations. Due to the nature of the instance segmentation task, it can be automatically transformed into a semantic segmentation (only one mask for every class) or object detection (bounding boxes for every object) tasks. All images are labeled (i.e. with annotations). There are 3 splits in the dataset: train (2975 images), test (1525 images), and val (500 images). Alternatively, the dataset could be split into 27 cities: berlin (544 images), munich (398 images), strasbourg (365 images), bremen (316 images), mainz (298 images), frankfurt (267 images), hamburg (248 images), dusseldorf (221 images), hanover (196 images), stuttgart (196 images), bielefeld (181 images), aachen (174 images), munster (174 images), cologne (154 images), tubingen (144 images), weimar (142 images), zurich (122 images), jena (119 images), erfurt (109 images), krefeld (99 images), bochum (96 images), ulm (95 images), monchengladbach (94 images), darmstadt (85 images), lindau (59 images), leverkusen (58 images), and bonn (46 images). The dataset was released in 2016 by the Daimler AG R&D, Germany, Max Planck Institute for Informatics, Germany, and TU Darmstadt Visual Inference Group, Germany.
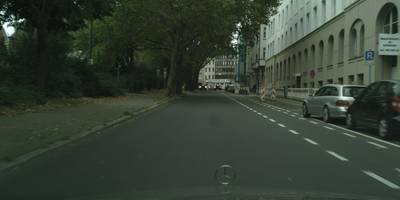
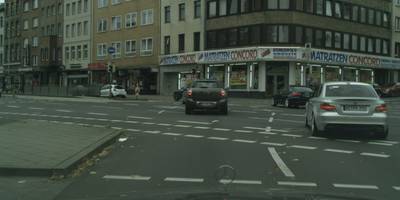
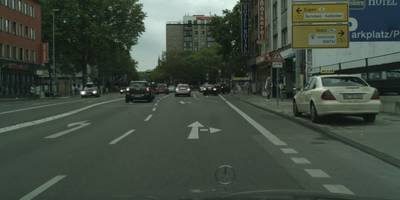
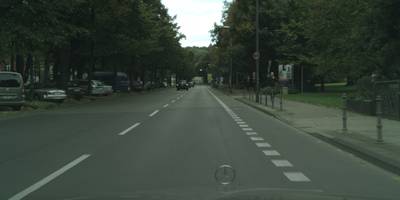
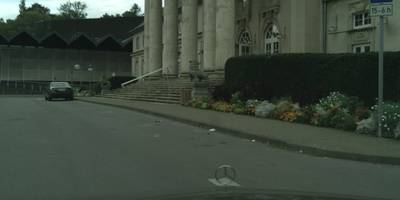
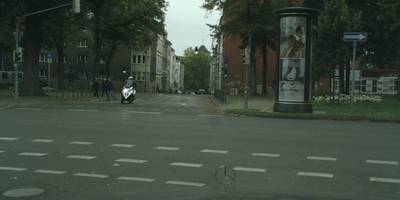
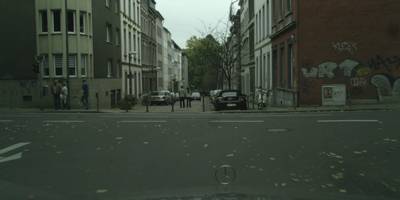
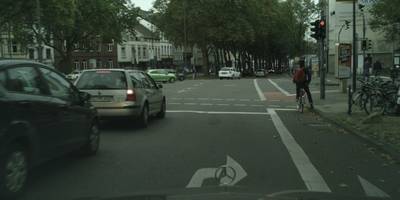
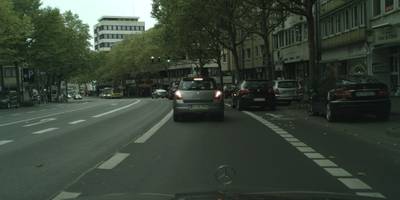
Here is the visualized example grid with animated annotations:
Explore #
Cityscapes dataset has 5000 images. Click on one of the examples below or open "Explore" tool anytime you need to view dataset images with annotations. This tool has extended visualization capabilities like zoom, translation, objects table, custom filters and more. Hover the mouse over the images to hide or show annotations.


Class balance #
There are 40 annotation classes in the dataset. Find the general statistics and balances for every class in the table below. Click any row to preview images that have labels of the selected class. Sort by column to find the most rare or prevalent classes.

Class ㅤ | Images ㅤ | Objects ㅤ | Count on image average | Area on image average |
|---|---|---|---|---|
out of roi➔ polygon | 5000 | 5000 | 1 | 1.31% |
ego vehicle➔ polygon | 5000 | 5000 | 1 | 5.9% |
static➔ polygon | 3445 | 47221 | 13.71 | 2% |
pole➔ polygon | 3441 | 52748 | 15.33 | 1.36% |
building➔ polygon | 3425 | 8305 | 2.42 | 38.01% |
road➔ polygon | 3419 | 3616 | 1.06 | 52.92% |
vegetation➔ polygon | 3377 | 17787 | 5.27 | 17.3% |
car➔ polygon | 3309 | 31824 | 9.62 | 6.74% |
sidewalk➔ polygon | 3286 | 8357 | 2.54 | 9.23% |
traffic sign➔ polygon | 3284 | 24976 | 7.61 | 0.58% |
Images #
Explore every single image in the dataset with respect to the number of annotations of each class it has. Click a row to preview selected image. Sort by any column to find anomalies and edge cases. Use horizontal scroll if the table has many columns for a large number of classes in the dataset.
Object distribution #
Interactive heatmap chart for every class with object distribution shows how many images are in the dataset with a certain number of objects of a specific class. Users can click cell and see the list of all corresponding images.
Class sizes #
The table below gives various size properties of objects for every class. Click a row to see the image with annotations of the selected class. Sort columns to find classes with the smallest or largest objects or understand the size differences between classes.
Class | Object count | Avg area | Max area | Min area | Min height | Min height | Max height | Max height | Avg height | Avg height | Min width | Min width | Max width | Max width |
|---|---|---|---|---|---|---|---|---|---|---|---|---|---|---|
pole polygon | 52748 | 0.08% | 48.59% | 0% | 2px | 0.2% | 944px | 92.19% | 150px | 14.67% | 1px | 0.05% | 2048px | 100% |
static polygon | 47221 | 0.15% | 49.22% | 0% | 2px | 0.2% | 938px | 91.6% | 55px | 5.35% | 2px | 0.1% | 2048px | 100% |
car polygon | 31824 | 0.76% | 26.14% | 0% | 4px | 0.39% | 1024px | 100% | 99px | 9.67% | 2px | 0.1% | 1148px | 56.05% |
traffic sign polygon | 24976 | 0.08% | 24.15% | 0% | 3px | 0.29% | 711px | 69.43% | 37px | 3.57% | 3px | 0.15% | 1591px | 77.69% |
person polygon | 21417 | 0.2% | 10.98% | 0% | 6px | 0.59% | 915px | 89.36% | 105px | 10.3% | 3px | 0.15% | 504px | 24.61% |
vegetation polygon | 17787 | 3.51% | 68.17% | 0% | 2px | 0.2% | 1024px | 100% | 249px | 24.28% | 2px | 0.1% | 2048px | 100% |
traffic light polygon | 11899 | 0.06% | 36.42% | 0% | 5px | 0.49% | 413px | 40.33% | 44px | 4.32% | 3px | 0.15% | 2048px | 100% |
sidewalk polygon | 8357 | 3.62% | 72.12% | 0% | 3px | 0.29% | 907px | 88.57% | 193px | 18.81% | 7px | 0.34% | 2048px | 100% |
building polygon | 8305 | 15.96% | 99.85% | 0% | 6px | 0.59% | 1024px | 100% | 409px | 39.93% | 5px | 0.24% | 2048px | 100% |
rectification border polygon | 7376 | 1.11% | 3.04% | 0.12% | 29px | 2.83% | 515px | 50.29% | 266px | 26.02% | 11px | 0.54% | 1938px | 94.63% |
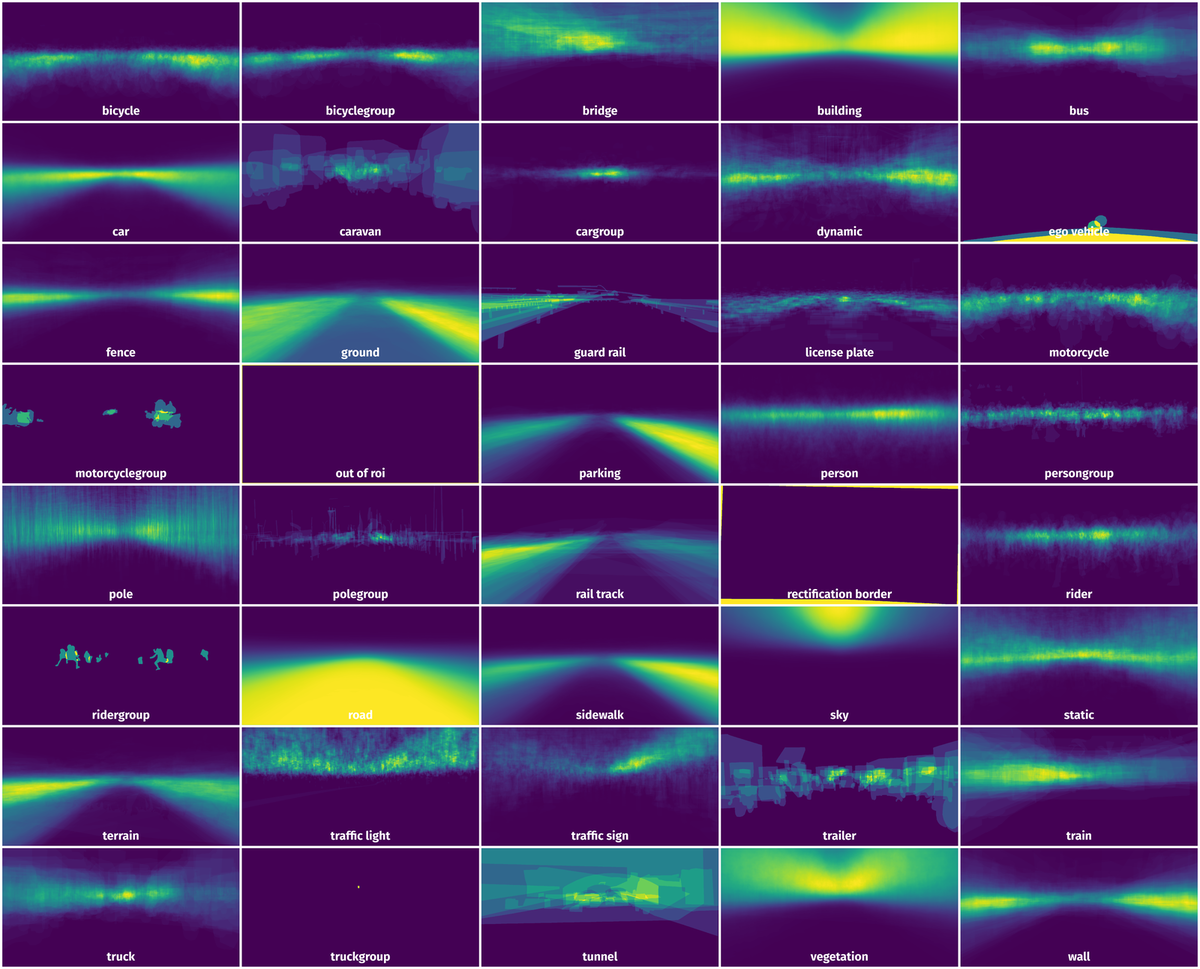
Spatial Heatmap #
The heatmaps below give the spatial distributions of all objects for every class. These visualizations provide insights into the most probable and rare object locations on the image. It helps analyze objects' placements in a dataset.
Objects #
Table contains all 287540 objects. Click a row to preview an image with annotations, and use search or pagination to navigate. Sort columns to find outliers in the dataset.
Object ID ㅤ | Class ㅤ | Image name click row to open | Image size height x width | Height ㅤ | Height ㅤ | Width ㅤ | Width ㅤ | Area ㅤ |
|---|---|---|---|---|---|---|---|---|
1➔ | ego vehicle polygon | munich_000368_000019_leftImg8bit.png | 1024 x 2048 | 180px | 17.58% | 1758px | 85.84% | 4.21% |
2➔ | out of roi polygon | munich_000368_000019_leftImg8bit.png | 1024 x 2048 | 1024px | 100% | 2048px | 100% | 99.85% |
3➔ | ego vehicle polygon | bielefeld_000000_021221_leftImg8bit.png | 1024 x 2048 | 228px | 22.27% | 2024px | 98.83% | 8.54% |
4➔ | rectification border polygon | bielefeld_000000_021221_leftImg8bit.png | 1024 x 2048 | 29px | 2.83% | 1632px | 79.69% | 1.09% |
5➔ | rectification border polygon | bielefeld_000000_021221_leftImg8bit.png | 1024 x 2048 | 515px | 50.29% | 11px | 0.54% | 0.12% |
6➔ | rectification border polygon | bielefeld_000000_021221_leftImg8bit.png | 1024 x 2048 | 475px | 46.39% | 18px | 0.88% | 0.19% |
7➔ | rectification border polygon | bielefeld_000000_021221_leftImg8bit.png | 1024 x 2048 | 47px | 4.59% | 1938px | 94.63% | 3.04% |
8➔ | out of roi polygon | bielefeld_000000_021221_leftImg8bit.png | 1024 x 2048 | 1024px | 100% | 2048px | 100% | 99.85% |
9➔ | ego vehicle polygon | bonn_000022_000019_leftImg8bit.png | 1024 x 2048 | 180px | 17.58% | 1758px | 85.84% | 4.21% |
10➔ | out of roi polygon | bonn_000022_000019_leftImg8bit.png | 1024 x 2048 | 1024px | 100% | 2048px | 100% | 99.85% |
License #
This dataset is made freely available to academic and non-academic entities for non-commercial purposes such as academic research, teaching, scientific publications, or personal experimentation. Permission is granted to use the data given that you agree to the terms of use (above) and:
- That the dataset comes “AS IS”, without express or implied warranty. Although every effort has been made to ensure accuracy, we (Daimler AG, MPI Informatics, TU Darmstadt) do not accept any responsibility for errors or omissions.
- That you include a reference to the Cityscapes Dataset in any work that makes use of the dataset. For research papers, cite our preferred publication as listed on our website; for other media cite our preferred publication as listed on our website or link to the Cityscapes website.
- That you do not distribute this dataset or modified versions. It is permissible to distribute derivative works in as far as they are abstract representations of this dataset (such as models trained on it or additional annotations that do not directly include any of our data) and do not allow to recover the dataset or something similar in character.
- That you may not use the dataset or any derivative work for commercial purposes as, for example, licensing or selling the data, or using the data with a purpose to procure a commercial gain.
- That all rights not expressly granted to you are reserved by us (Daimler AG, MPI Informatics, TU Darmstadt).
Citation #
If you make use of the Cityscapes data, please cite the following reference:
@inproceedings{Cordts2016Cityscapes,
title={The Cityscapes Dataset for Semantic Urban Scene Understanding},
author={Cordts, Marius and Omran, Mohamed and Ramos, Sebastian and Rehfeld, Timo and Enzweiler, Markus and Benenson, Rodrigo and Franke, Uwe and Roth, Stefan and Schiele, Bernt},
booktitle={Proc. of the IEEE Conference on Computer Vision and Pattern Recognition (CVPR)},
year={2016}
}
If you are happy with Dataset Ninja and use provided visualizations and tools in your work, please cite us:
@misc{ visualization-tools-for-cityscapes-dataset,
  title = { Visualization Tools for Cityscapes Dataset },
  type = { Computer Vision Tools },
  author = { Dataset Ninja },
  howpublished = { \url{ https://datasetninja.com/cityscapes } },
  url = { https://datasetninja.com/cityscapes },
  journal = { Dataset Ninja },
  publisher = { Dataset Ninja },
  year = { 2026 },
  month = { jul },
  note = { visited on 2026-07-16 },
}
Download #
Please visit dataset homepage to download the data.
Disclaimer #
Our gal from the legal dep told us we need to post this:
Dataset Ninja provides visualizations and statistics for some datasets that can be found online and can be downloaded by general audience. Dataset Ninja is not a dataset hosting platform and can only be used for informational purposes. The platform does not claim any rights for the original content, including images, videos, annotations and descriptions. Joint publishing is prohibited.
You take full responsibility when you use datasets presented at Dataset Ninja, as well as other information, including visualizations and statistics we provide. You are in charge of compliance with any dataset license and all other permissions. You are required to navigate datasets homepage and make sure that you can use it. In case of any questions, get in touch with us at hello@datasetninja.com.