

Introduction #
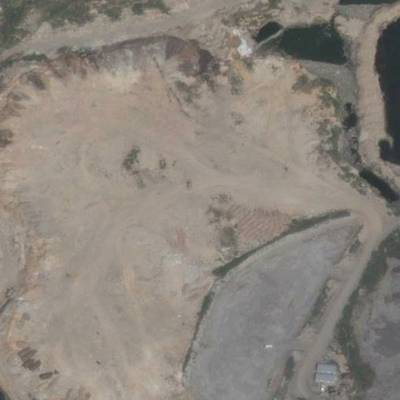
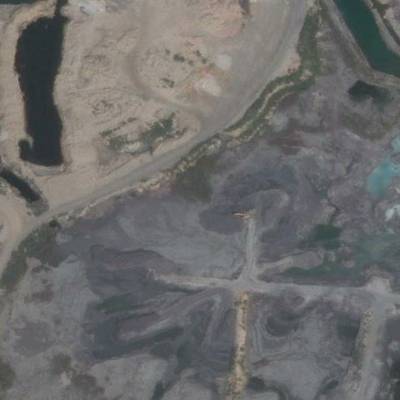
The authors of the CNAM-CD: A Multi-Class Change Detection Dataset dataset recognized the formidable challenges in detecting changes within urban areas, marked by intricate features, rapid alterations, and human-induced interferences from different Chinese new national areas. They observed that the conventional binary change detection (BCD) methods used for urban change detection have limitations as cities become more complex. These BCD techniques often rely on convolutional operations, which struggle to capture comprehensive contextual and semantic information. This is the first version publicly available, where A is the image at the previous time, B is the image at the later time and Label is the corresponding label.
To address these issues, the authors introduced SIGNet, a Siamese graph convolutional network designed to enhance the accuracy of urban multi-class change detection (MCD) tasks. The experimental results demonstrated SIGNet’s superior performance in capturing contextual relationships and semantic correlations, establishing it as a state-of-the-art solution for MCD tasks.
Recognizing the scarcity of pixel-level datasets in the MCD domain, the authors introduced a new dataset named CNAM-CD, which offers extensive labeling for multi-class change detection. CNAM-CD comprises 2508 pairs of high-resolution images and serves as a valuable resource for evaluating models, particularly when compared to traditional BCD approaches.
The authors highlighted the critical importance of accurately identifying changes in land use and land cover (LULC) within cities, as it plays a pivotal role in various fields, including urban expansion, economic development, and sociology.
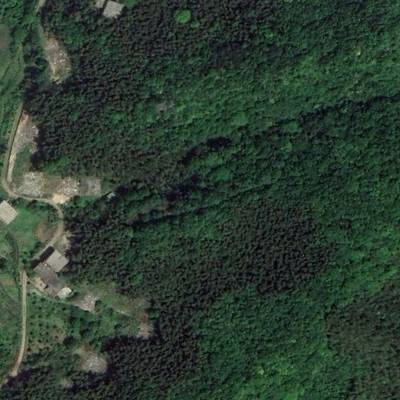
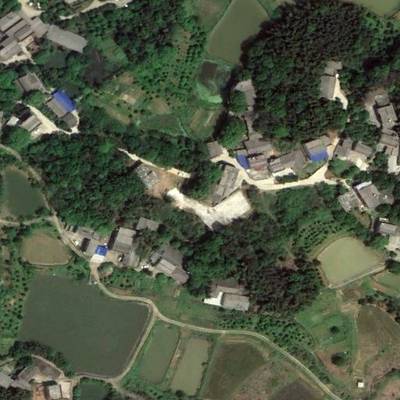
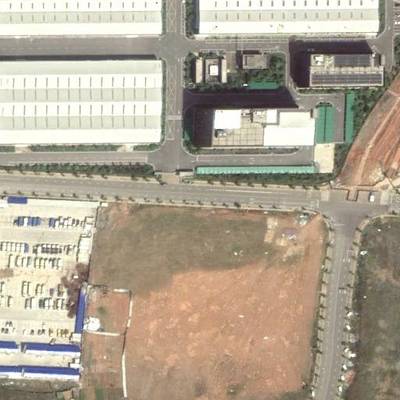
For the CNAM-CD dataset, the authors selected 12 State-level New Areas (SLNAs) in China, regions known for their dynamic and rapid changes in the urban environment. These areas were chosen to ensure balanced categories for constructing the dataset, resulting in 2503 pairs of high-resolution images captured between 2013 and 2022.
The authors explained that the dataset was derived from Google Earth level 19 images, offering high resolution and wide coverage of SLNAs. Due to variations in image appearance, including hue, saturation, contrast, and brightness, between bi-temporal images, the dataset poses a significant challenge for change detection models.
CNAM-CD featured five distinct categories: bare ground, vegetation, water ground, impervious surfaces (including buildings, roads, parking lots, and squares), and other (comprising clouds, hard shadows, and clutter). These categories align with previous urban-related research.
The dataset’s categorical distribution was discussed, highlighting that bare land constituted the largest category of change (34.12% of the change area), while water bodies represented the smallest category (7.83%). To ensure dataset balance, areas with excessive water bodies were excluded from data source selection, and each SLNA selected for the dataset encompassed all categories.
 Homepage
 Research Paper
Summary #
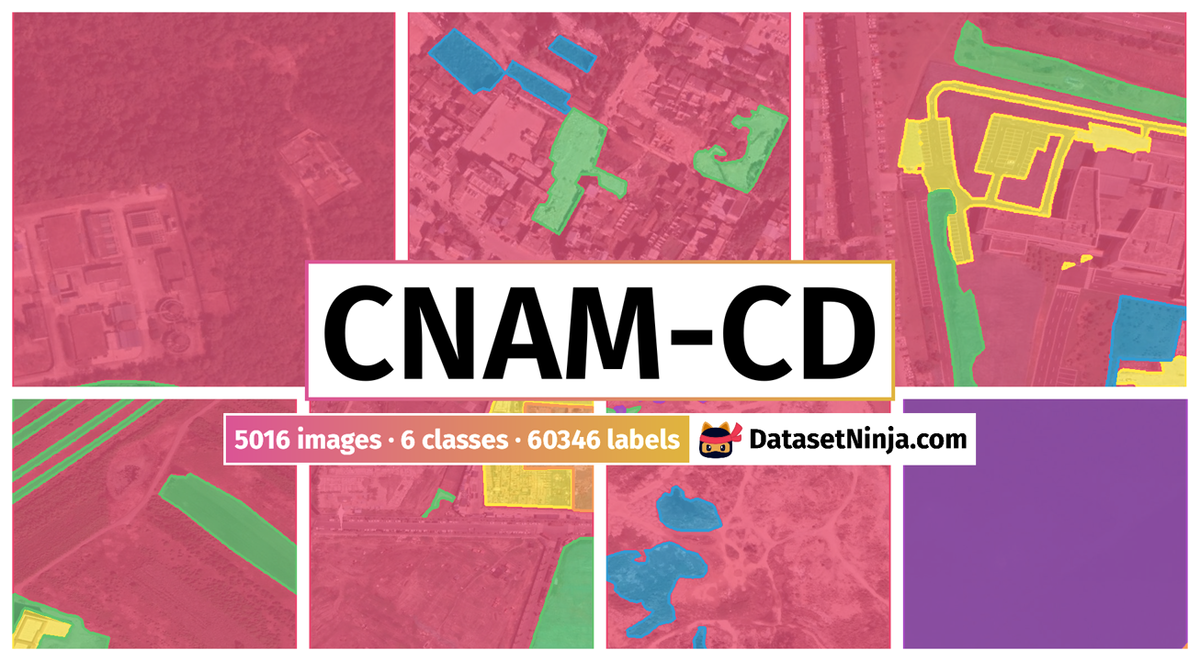
CNAM-CD: A Multi-Class Change Detection Dataset is a dataset for instance segmentation, semantic segmentation, and object detection tasks. It is used in the geospatial domain, and in the urban planning industry.
The dataset consists of 5016 images with 60346 labeled objects belonging to 6 different classes including background, bare ground, impervious surface, and other: vegetation, other, and water bodies.
Images in the CNAM-CD dataset have pixel-level instance segmentation annotations. Due to the nature of the instance segmentation task, it can be automatically transformed into a semantic segmentation (only one mask for every class) or object detection (bounding boxes for every object) tasks. There are 4 (0% of the total) unlabeled images (i.e. without annotations). There are no pre-defined train/val/test splits in the dataset. Alternatively, the dataset could be split into 2512 groups set by img_id. Every group has 2 images: A (before) and B (after). Ground truth masks assigned to B. The dataset was released in 2023 by the Xinjiang University, China.
Explore #
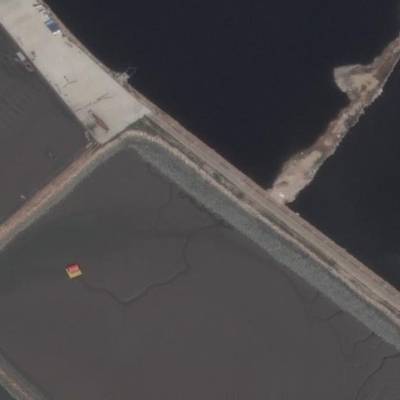
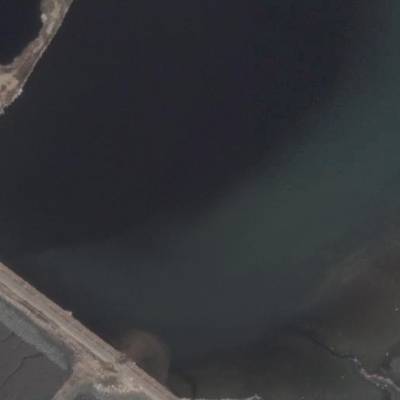
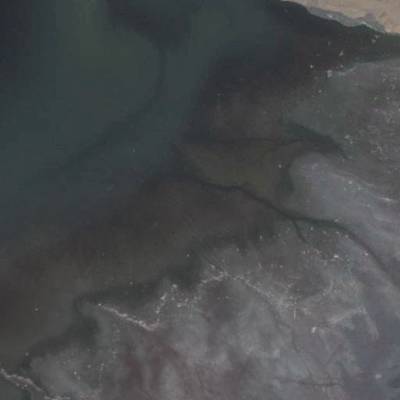
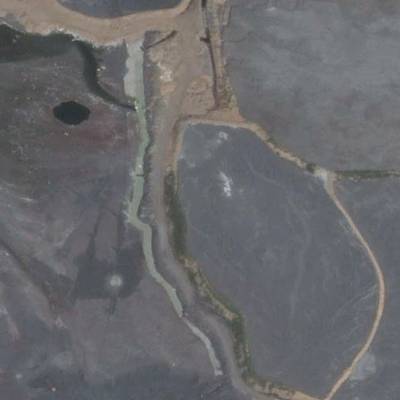
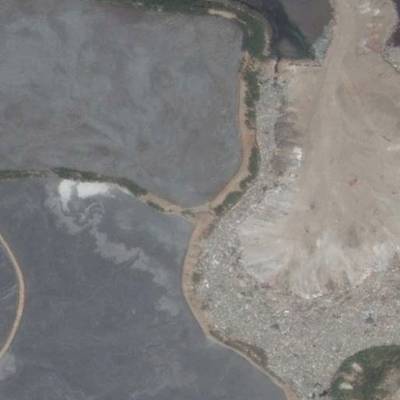
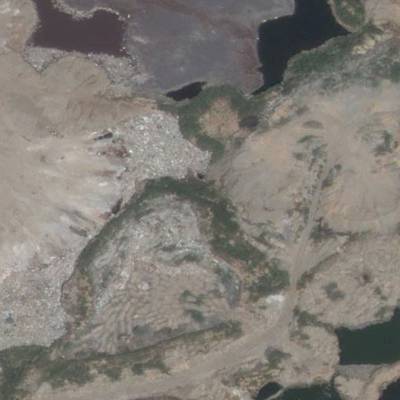
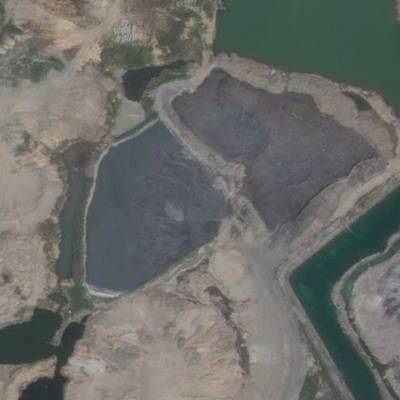
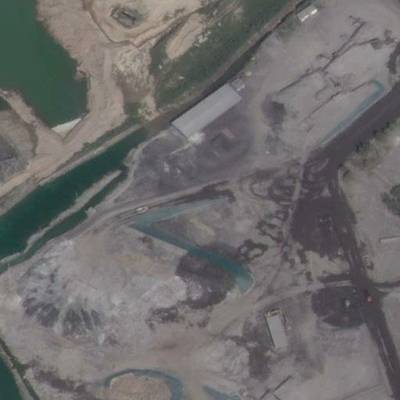
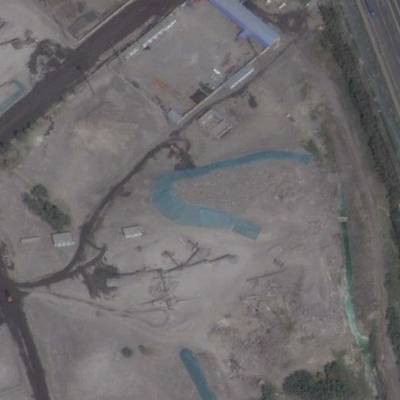
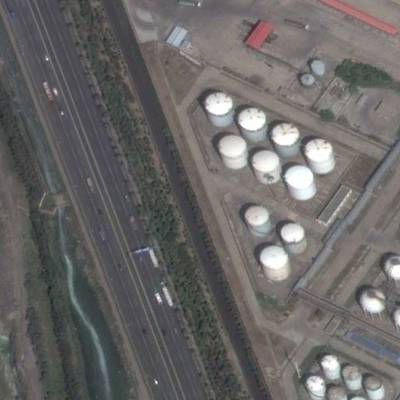
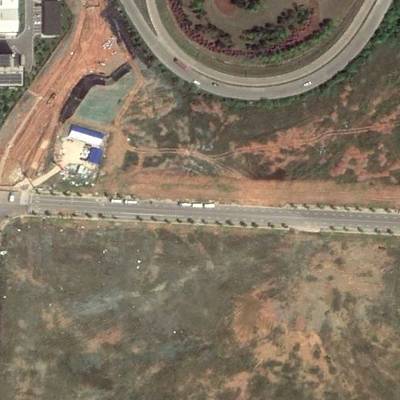
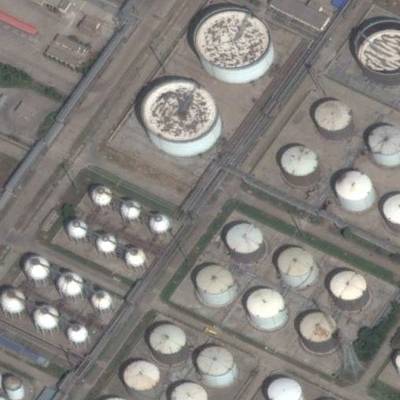
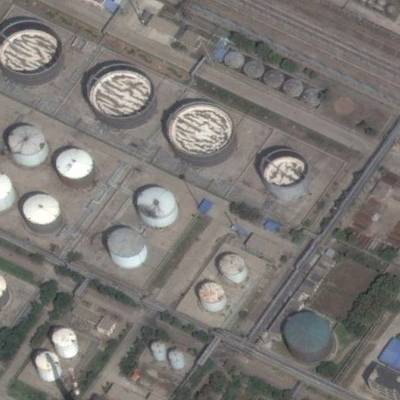
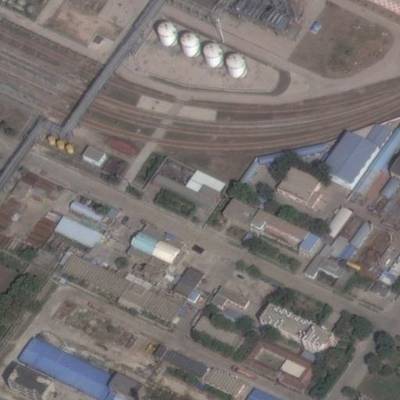
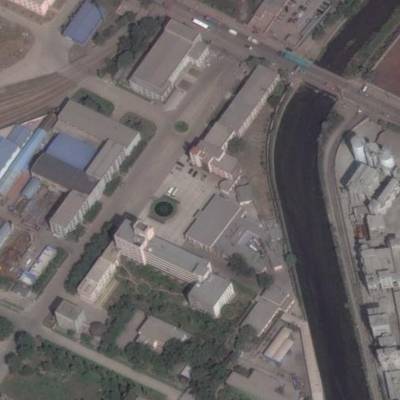
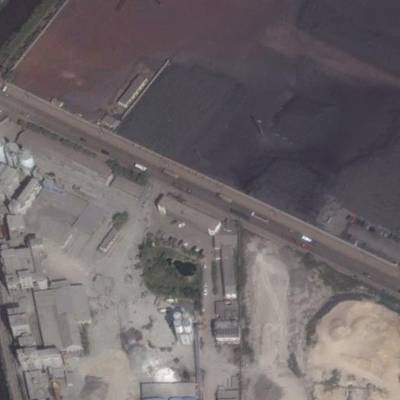
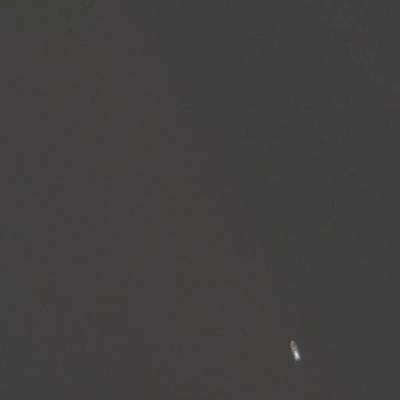
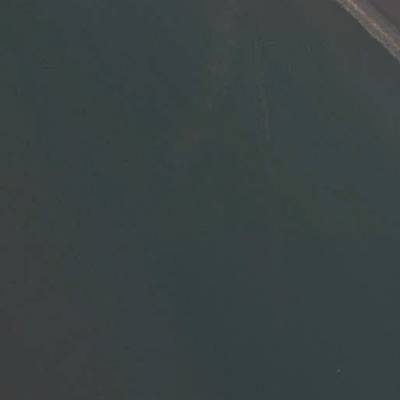
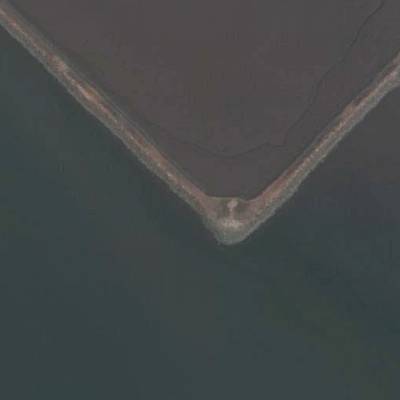
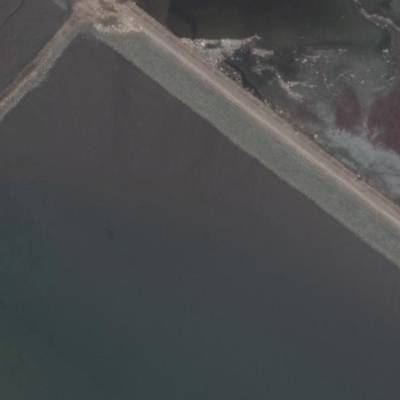
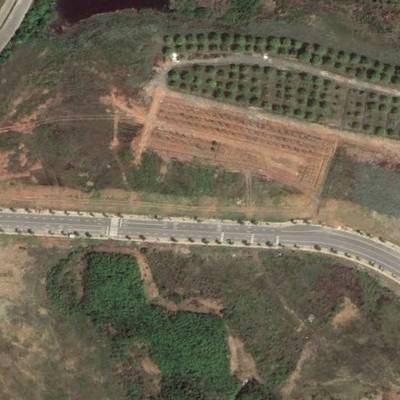
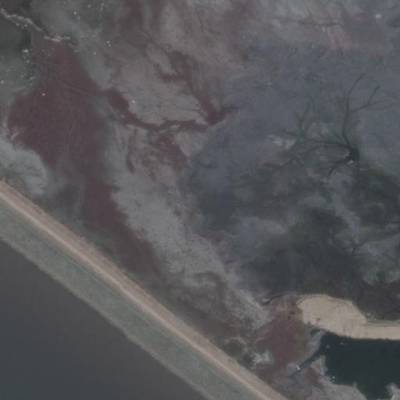
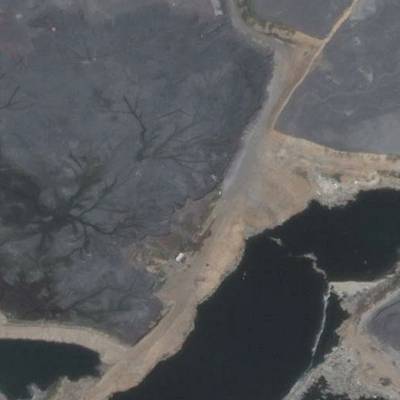
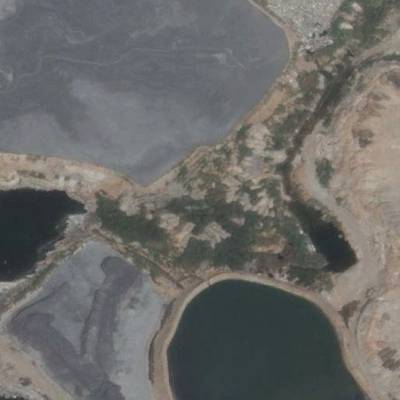
CNAM-CD dataset has 5016 images. Click on one of the examples below or open "Explore" tool anytime you need to view dataset images with annotations. This tool has extended visualization capabilities like zoom, translation, objects table, custom filters and more. Hover the mouse over the images to hide or show annotations.


Class balance #
There are 6 annotation classes in the dataset. Find the general statistics and balances for every class in the table below. Click any row to preview images that have labels of the selected class. Sort by column to find the most rare or prevalent classes.

Class ㅤ | Images ㅤ | Objects ㅤ | Count on image average | Area on image average |
|---|---|---|---|---|
background➔ mask | 4942 | 16913 | 3.42 | 73.18% |
bare ground➔ mask | 3627 | 13700 | 3.78 | 13.58% |
impervious surface➔ mask | 3108 | 9832 | 3.16 | 11.91% |
vegetation➔ mask | 2735 | 10241 | 3.74 | 8.04% |
other➔ mask | 2378 | 7466 | 3.14 | 4.79% |
water bodies➔ mask | 1079 | 2194 | 2.03 | 18.35% |
Co-occurrence matrix #
Co-occurrence matrix is an extremely valuable tool that shows you the images for every pair of classes: how many images have objects of both classes at the same time. If you click any cell, you will see those images. We added the tooltip with an explanation for every cell for your convenience, just hover the mouse over a cell to preview the description.
Images #
Explore every single image in the dataset with respect to the number of annotations of each class it has. Click a row to preview selected image. Sort by any column to find anomalies and edge cases. Use horizontal scroll if the table has many columns for a large number of classes in the dataset.
Object distribution #
Interactive heatmap chart for every class with object distribution shows how many images are in the dataset with a certain number of objects of a specific class. Users can click cell and see the list of all corresponding images.
Class sizes #
The table below gives various size properties of objects for every class. Click a row to see the image with annotations of the selected class. Sort columns to find classes with the smallest or largest objects or understand the size differences between classes.
Class | Object count | Avg area | Max area | Min area | Min height | Min height | Max height | Max height | Avg height | Avg height | Min width | Min width | Max width | Max width |
|---|---|---|---|---|---|---|---|---|---|---|---|---|---|---|
background mask | 16913 | 21.38% | 100% | 0.02% | 1px | 0.2% | 512px | 100% | 191px | 37.23% | 1px | 0.2% | 512px | 100% |
bare ground mask | 13700 | 3.59% | 99.77% | 0.02% | 1px | 0.2% | 512px | 100% | 96px | 18.71% | 1px | 0.2% | 512px | 100% |
vegetation mask | 10241 | 2.15% | 76.28% | 0.02% | 2px | 0.39% | 512px | 100% | 85px | 16.61% | 2px | 0.39% | 512px | 100% |
impervious surface mask | 9832 | 3.76% | 92.81% | 0.02% | 2px | 0.39% | 512px | 100% | 107px | 20.91% | 2px | 0.39% | 512px | 100% |
other mask | 7466 | 1.53% | 82.91% | 0.02% | 2px | 0.39% | 512px | 100% | 67px | 13.15% | 1px | 0.2% | 512px | 100% |
water bodies mask | 2194 | 9.02% | 100% | 0.02% | 2px | 0.39% | 512px | 100% | 130px | 25.48% | 4px | 0.78% | 512px | 100% |
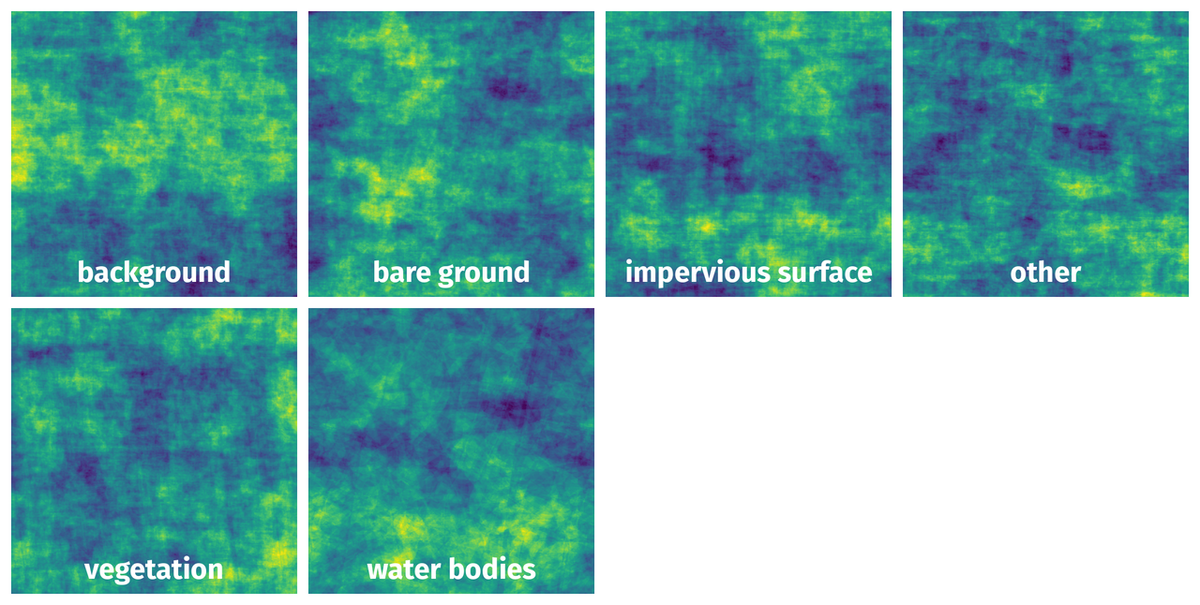
Spatial Heatmap #
The heatmaps below give the spatial distributions of all objects for every class. These visualizations provide insights into the most probable and rare object locations on the image. It helps analyze objects' placements in a dataset.
Objects #
Table contains all 60346 objects. Click a row to preview an image with annotations, and use search or pagination to navigate. Sort columns to find outliers in the dataset.
Object ID ㅤ | Class ㅤ | Image name click row to open | Image size height x width | Height ㅤ | Height ㅤ | Width ㅤ | Width ㅤ | Area ㅤ |
|---|---|---|---|---|---|---|---|---|
1➔ | background mask | B-1383.tif.tiff | 512 x 512 | 512px | 100% | 512px | 100% | 46.17% |
2➔ | background mask | B-1383.tif.tiff | 512 x 512 | 34px | 6.64% | 35px | 6.84% | 0.23% |
3➔ | impervious surface mask | B-1383.tif.tiff | 512 x 512 | 52px | 10.16% | 10px | 1.95% | 0.11% |
4➔ | impervious surface mask | B-1383.tif.tiff | 512 x 512 | 55px | 10.74% | 358px | 69.92% | 6.05% |
5➔ | bare ground mask | B-1383.tif.tiff | 512 x 512 | 64px | 12.5% | 82px | 16.02% | 1.13% |
6➔ | bare ground mask | B-1383.tif.tiff | 512 x 512 | 61px | 11.91% | 194px | 37.89% | 3.99% |
7➔ | bare ground mask | B-1383.tif.tiff | 512 x 512 | 67px | 13.09% | 94px | 18.36% | 1.65% |
8➔ | bare ground mask | B-1383.tif.tiff | 512 x 512 | 24px | 4.69% | 18px | 3.52% | 0.14% |
9➔ | bare ground mask | B-1383.tif.tiff | 512 x 512 | 321px | 62.7% | 105px | 20.51% | 6.72% |
10➔ | bare ground mask | B-1383.tif.tiff | 512 x 512 | 356px | 69.53% | 232px | 45.31% | 7.08% |
License #
CNAM-CD: A Multi-Class Change Detection Dataset is under Apache 2.0 license.
Citation #
If you make use of the CNAM-CD data, please cite the following reference:
@dataset{CNAM-CD,
  author={Zhou, Yanpeng and Wang, Jinjie and Ding, Jianli and Liu, Bohua and Weng, Nan and Xiao, Hongzhi},
  title={CNAM-CD: A Multi-Class Change Detection Dataset},
  year={2023},
  url={https://github.com/Silvestezhou/CNAM-CD}
}
If you are happy with Dataset Ninja and use provided visualizations and tools in your work, please cite us:
@misc{ visualization-tools-for-cnam-cd-dataset,
  title = { Visualization Tools for CNAM-CD Dataset },
  type = { Computer Vision Tools },
  author = { Dataset Ninja },
  howpublished = { \url{ https://datasetninja.com/cnam-cd } },
  url = { https://datasetninja.com/cnam-cd },
  journal = { Dataset Ninja },
  publisher = { Dataset Ninja },
  year = { 2026 },
  month = { jul },
  note = { visited on 2026-07-25 },
}
Download #
Dataset CNAM-CD can be downloaded in Supervisely format:
As an alternative, it can be downloaded with dataset-tools package:
pip install --upgrade dataset-tools
… using following python code:
import dataset_tools as dtools

dtools.download(dataset='CNAM-CD', dst_dir='~/dataset-ninja/')
Make sure not to overlook the python code example available on the Supervisely Developer Portal. It will give you a clear idea of how to effortlessly work with the downloaded dataset.
The data in original format can be downloaded here.
Disclaimer #
Our gal from the legal dep told us we need to post this:
Dataset Ninja provides visualizations and statistics for some datasets that can be found online and can be downloaded by general audience. Dataset Ninja is not a dataset hosting platform and can only be used for informational purposes. The platform does not claim any rights for the original content, including images, videos, annotations and descriptions. Joint publishing is prohibited.
You take full responsibility when you use datasets presented at Dataset Ninja, as well as other information, including visualizations and statistics we provide. You are in charge of compliance with any dataset license and all other permissions. You are required to navigate datasets homepage and make sure that you can use it. In case of any questions, get in touch with us at hello@datasetninja.com.