

Introduction #
The authors of Cocoa Diseases (YOLOv4): Monilia & Phytophthora (Diseases in Cocoa Pods) claim that the total production of Theobroma cacao L cocoa in Colombia for 2018 exceeded 56 thousand tons, making it the second-highest in history despite a 6% reduction compared to 2017. The decrease in production was attributed to factors such as flowering flows, increased incidence of the Monilia disease, and floods caused by heavy rainfall early in the year. In response to the need for reliable inspection procedures to assess crop infections, the authors of the dataset developed a mobile application prototype that utilizes artificial intelligence techniques and image analysis to identify diseased cocoa pods.
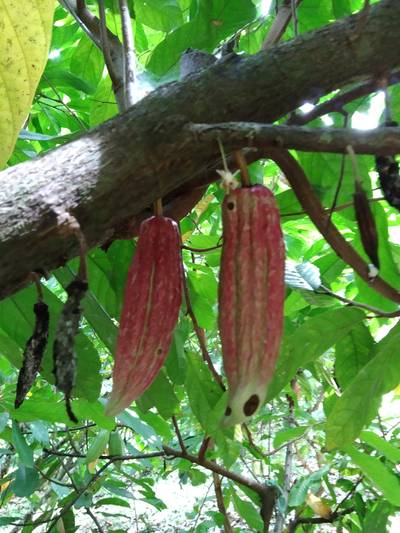
The research collected data to create a dataset containing data on the most concerning diseases affecting cocoa crops, such as Phytophthora and Monilia. The authors employed YOLOv4, a machine learning algorithm, to train a model with a 60% accuracy in detecting cocoa pods. The results show promise for the application’s potential usefulness as a mobile tool for farmers and agricultural researchers. The tool can aid in decision-making processes, providing an accurate evaluation of cocoa pod infections without the need for an expert trained in cocoa crop phytosanitary management.
To consolidate and standardize the database for calibration, training, and development activities, the authors conducted a data collection survey that involved capturing step images of the cocoa pods. They collaborated with SENA (National Service of Learning) and visited the agricultural sector’s attention center in Playón, Santander. The images were captured following standardized procedures, including setting specific camera characteristics such as focal point, exposure time, ISO speed, lens compensation exposure, focal length, maximum aperture, metering mode, and flash mode. The images were then labeled and coded using the LabelImg tool to distinguish between diseased and healthy cocoa pods. The set of images containing diseased and healthy cocoa pods was consolidated for later use in training the machine learning model.
 Homepage
 Research Paper
Summary #
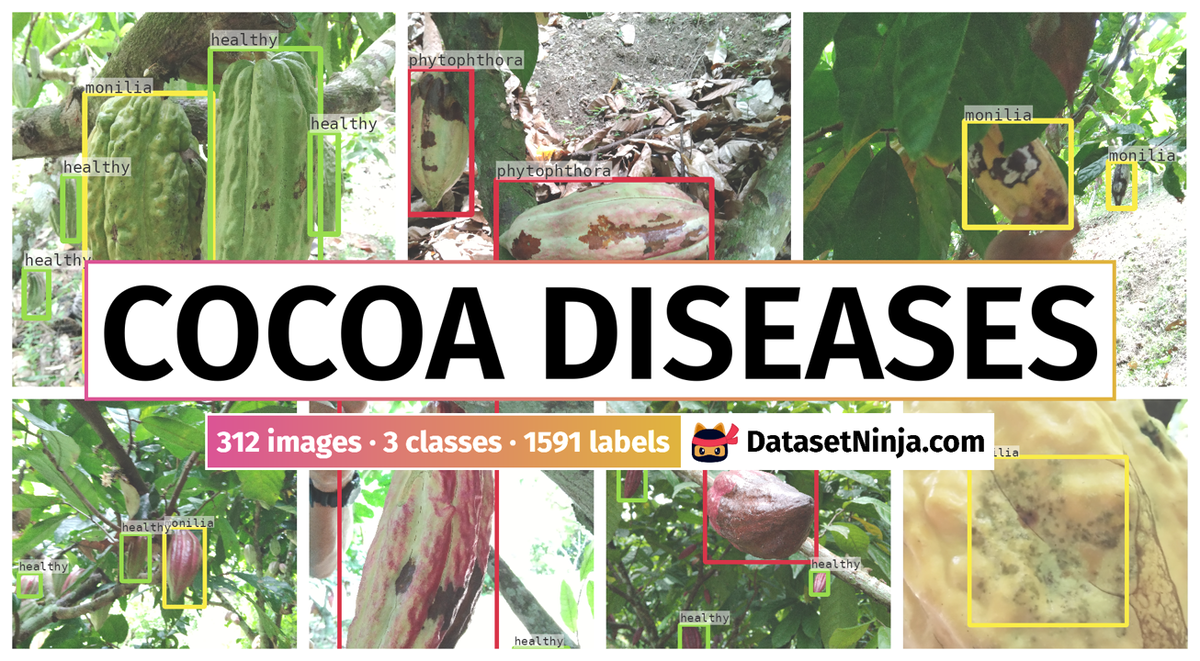
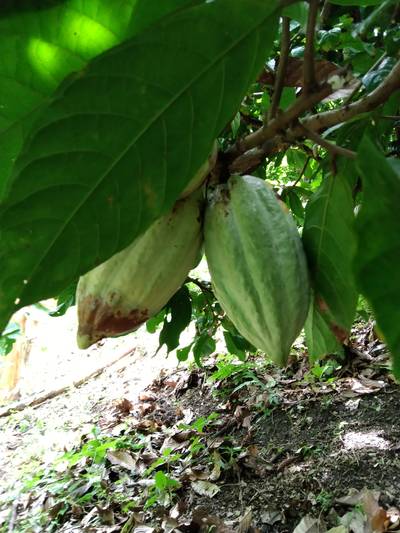
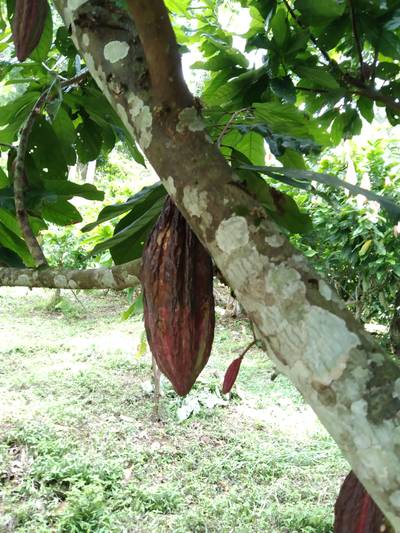
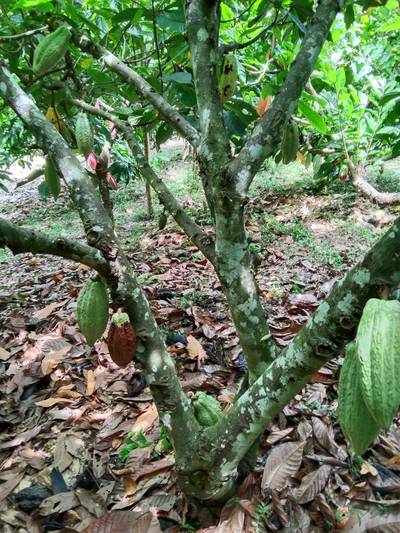
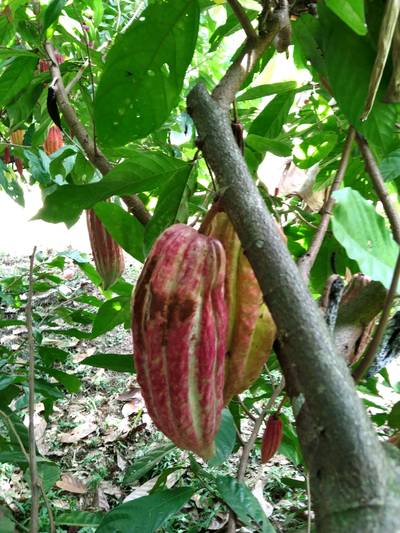
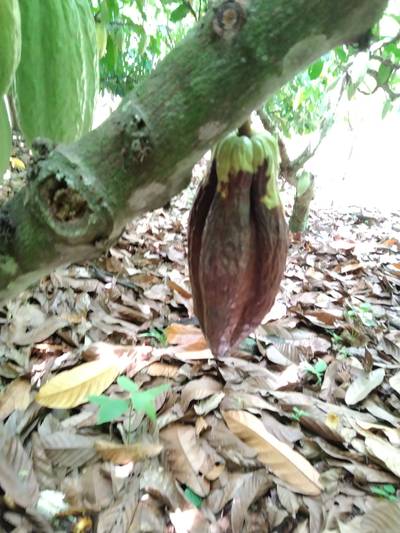
Cocoa Diseases (YOLOv4): Monilia & Phytophthora (Diseases in Cocoa Pods) is a dataset for an object detection task. It is used in the agricultural industry, and in the agricultural research.
The dataset consists of 312 images with 1591 labeled objects belonging to 3 different classes including healthy, phytophthora, and monilia.
Images in the Cocoa Diseases dataset have bounding box annotations. All images are labeled (i.e. with annotations). There is 1 split in the dataset: all (312 images). The dataset was released in 2020 by the Autonomous University of Bucaramanga, Colombia.
Explore #
Cocoa Diseases dataset has 312 images. Click on one of the examples below or open "Explore" tool anytime you need to view dataset images with annotations. This tool has extended visualization capabilities like zoom, translation, objects table, custom filters and more. Hover the mouse over the images to hide or show annotations.


Class balance #
There are 3 annotation classes in the dataset. Find the general statistics and balances for every class in the table below. Click any row to preview images that have labels of the selected class. Sort by column to find the most rare or prevalent classes.

Class ㅤ | Images ㅤ | Objects ㅤ | Count on image average | Area on image average |
|---|---|---|---|---|
healthy➔ rectangle | 257 | 1219 | 4.74 | 9.9% |
phytophthora➔ rectangle | 164 | 227 | 1.38 | 9.38% |
monilia➔ rectangle | 123 | 145 | 1.18 | 11.92% |
Co-occurrence matrix #
Co-occurrence matrix is an extremely valuable tool that shows you the images for every pair of classes: how many images have objects of both classes at the same time. If you click any cell, you will see those images. We added the tooltip with an explanation for every cell for your convenience, just hover the mouse over a cell to preview the description.
Images #
Explore every single image in the dataset with respect to the number of annotations of each class it has. Click a row to preview selected image. Sort by any column to find anomalies and edge cases. Use horizontal scroll if the table has many columns for a large number of classes in the dataset.
Object distribution #
Interactive heatmap chart for every class with object distribution shows how many images are in the dataset with a certain number of objects of a specific class. Users can click cell and see the list of all corresponding images.
Class sizes #
The table below gives various size properties of objects for every class. Click a row to see the image with annotations of the selected class. Sort columns to find classes with the smallest or largest objects or understand the size differences between classes.
Class | Object count | Avg area | Max area | Min area | Min height | Min height | Max height | Max height | Avg height | Avg height | Min width | Min width | Max width | Max width |
|---|---|---|---|---|---|---|---|---|---|---|---|---|---|---|
healthy rectangle | 1219 | 2.18% | 25.77% | 0.01% | 34px | 0.82% | 3141px | 75.5% | 599px | 14.41% | 20px | 0.64% | 1529px | 49.01% |
phytophthora rectangle | 227 | 6.84% | 46.76% | 0.04% | 100px | 2.4% | 3510px | 84.38% | 1153px | 27.73% | 46px | 1.47% | 2064px | 66.15% |
monilia rectangle | 145 | 10.11% | 53.52% | 0.11% | 178px | 4.28% | 3720px | 89.42% | 1427px | 34.62% | 56px | 1.79% | 2464px | 78.97% |
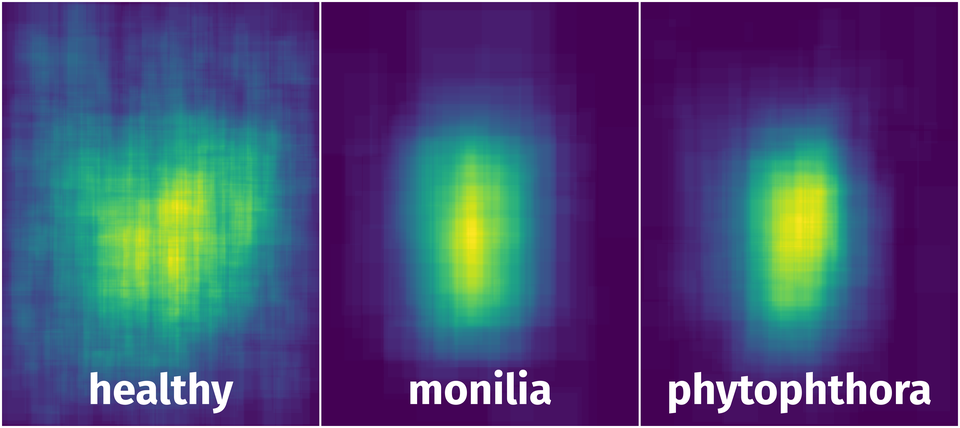
Spatial Heatmap #
The heatmaps below give the spatial distributions of all objects for every class. These visualizations provide insights into the most probable and rare object locations on the image. It helps analyze objects' placements in a dataset.
Objects #
Table contains all 1591 objects. Click a row to preview an image with annotations, and use search or pagination to navigate. Sort columns to find outliers in the dataset.
Object ID ㅤ | Class ㅤ | Image name click row to open | Image size height x width | Height ㅤ | Height ㅤ | Width ㅤ | Width ㅤ | Area ㅤ |
|---|---|---|---|---|---|---|---|---|
1➔ | monilia rectangle | Monilia98.jpg | 4160 x 3120 | 2809px | 67.52% | 1042px | 33.4% | 22.55% |
2➔ | healthy rectangle | Monilia98.jpg | 4160 x 3120 | 1847px | 44.4% | 701px | 22.47% | 9.98% |
3➔ | healthy rectangle | Monilia98.jpg | 4160 x 3120 | 546px | 13.12% | 647px | 20.74% | 2.72% |
4➔ | monilia rectangle | Monilia27.jpg | 3120 x 4160 | 348px | 11.15% | 895px | 21.51% | 2.4% |
5➔ | phytophthora rectangle | Monilia27.jpg | 3120 x 4160 | 615px | 19.71% | 934px | 22.45% | 4.43% |
6➔ | healthy rectangle | Sana73.jpg | 4160 x 3120 | 683px | 16.42% | 309px | 9.9% | 1.63% |
7➔ | healthy rectangle | Sana73.jpg | 4160 x 3120 | 719px | 17.28% | 374px | 11.99% | 2.07% |
8➔ | healthy rectangle | Sana73.jpg | 4160 x 3120 | 534px | 12.84% | 174px | 5.58% | 0.72% |
9➔ | healthy rectangle | Sana73.jpg | 4160 x 3120 | 728px | 17.5% | 311px | 9.97% | 1.74% |
10➔ | healthy rectangle | Sana73.jpg | 4160 x 3120 | 446px | 10.72% | 242px | 7.76% | 0.83% |
License #
Citation #
If you make use of the Cocoa Diseases data, please cite the following reference:
@misc{20.500.12749_13367,
      author = {Serrano Arenas Juan Sebastián and Torres Villamizar Camilo Andrés},
      title = {Prototipo de aplicación móvil para la identificación de mazorcas de cacao enfermas haciendo uso de visión por computadora y aprendizaje de máquina},
      year = {2020},
      abstract = {Según fuentes de Fedecacao, para el 2018 se determinó que la producción total de cacao Theobroma cacao L en Colombia superó las 56 mil toneladas, la segunda más alta en toda la historia puesto que hubo una reducción de la producción del 6% en comparación al 2017, al pasar de 60 mil a 56 mil toneladas (Fedecacao, 2018). La reducción se dio debido a los flujos de floración, al incremento de la enfermedad llamada Monilia y a las inundaciones causadas por las precipitaciones de comienzos de año. Teniendo en cuenta que la inspección semanal es un procedimiento confiable para evaluar el grado de infección en los cultivos, el presente proyecto desarrolla un prototipo de aplicación móvil que permita identificar mediante técnicas de inteligencia artificial y análisis de imágenes las mazorcas de cacao enfermas. Mediante el levantamiento de datos esta investigación realiza la consolidación de un conjunto de datos que contiene las enfermedades más preocupantes como son la Fitóftora y la Monilia. Para mejorar el procedimiento de inspección se entrena una máquina de aprendizaje con YOLOv4 obteniendo un 60% de precisión en la detección de mazorcas de cacao. Los resultados prometen una herramienta móvil útil a los agricultores e investigadores agrícolas para la toma de decisiones, permitiendo evaluar y realizar con precisión el proceso de inspección de las mazorcas sin la necesidad de un experto capacitado en el manejo fitosanitario en los cultivos de cacao.},
      url = {http://hdl.handle.net/20.500.12749/13367}
      }
If you are happy with Dataset Ninja and use provided visualizations and tools in your work, please cite us:
@misc{ visualization-tools-for-cocoa-diseases-dataset,
  title = { Visualization Tools for Cocoa Diseases Dataset },
  type = { Computer Vision Tools },
  author = { Dataset Ninja },
  howpublished = { \url{ https://datasetninja.com/cocoa-diseases } },
  url = { https://datasetninja.com/cocoa-diseases },
  journal = { Dataset Ninja },
  publisher = { Dataset Ninja },
  year = { 2026 },
  month = { jul },
  note = { visited on 2026-07-17 },
}
Download #
Dataset Cocoa Diseases can be downloaded in Supervisely format:
As an alternative, it can be downloaded with dataset-tools package:
pip install --upgrade dataset-tools
… using following python code:
import dataset_tools as dtools

dtools.download(dataset='Cocoa Diseases', dst_dir='~/dataset-ninja/')
Make sure not to overlook the python code example available on the Supervisely Developer Portal. It will give you a clear idea of how to effortlessly work with the downloaded dataset.
The data in original format can be downloaded here.
Disclaimer #
Our gal from the legal dep told us we need to post this:
Dataset Ninja provides visualizations and statistics for some datasets that can be found online and can be downloaded by general audience. Dataset Ninja is not a dataset hosting platform and can only be used for informational purposes. The platform does not claim any rights for the original content, including images, videos, annotations and descriptions. Joint publishing is prohibited.
You take full responsibility when you use datasets presented at Dataset Ninja, as well as other information, including visualizations and statistics we provide. You are in charge of compliance with any dataset license and all other permissions. You are required to navigate datasets homepage and make sure that you can use it. In case of any questions, get in touch with us at hello@datasetninja.com.