Introduction #
The CODEBRIM: COncrete DEfect BRidge IMage Dataset is designed for multi-target classification of five commonly occurring concrete defects. The dataset aims to facilitate the development of robust computer vision techniques tailored to real-world scenarios. In the pursuit of recognizing defects in concrete infrastructure, particularly in bridges, the authors of the dataset acknowledge the inherent challenges in this critical initial step for assessing structural integrity. Concrete materials exhibit significant variations in appearance, influenced by factors such as lighting conditions, weather, and diverse surface characteristics. Additionally, concrete defects often overlap, compounding the complexity of the task.
Recognizing the importance of accurately identifying various defect types concurrently, the authors emphasize the severity of overlapping defects with structural safety assessment. Concrete surfaces’ visual properties, including reflectance, roughness, and colour, vary significantly. Addressing these variations necessitates the development of computer vision methods capable of handling such complex visual environments.
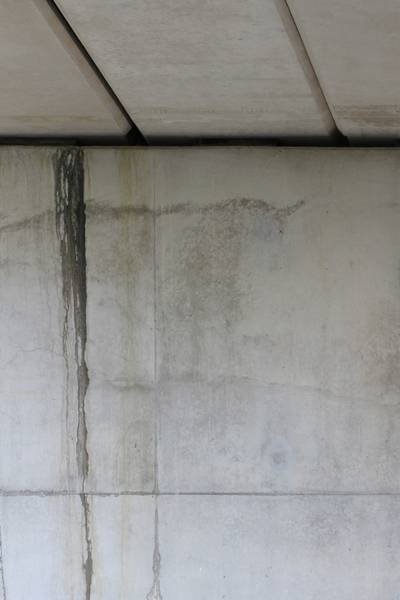
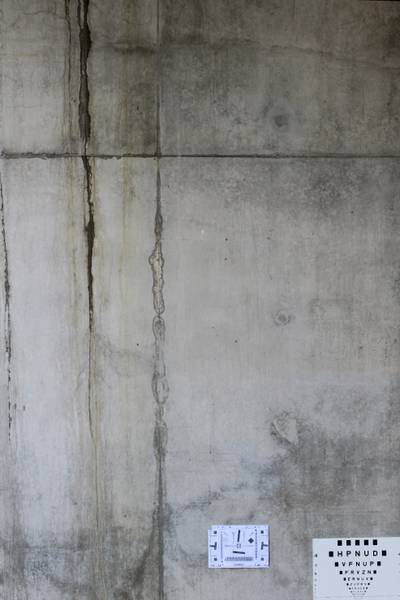
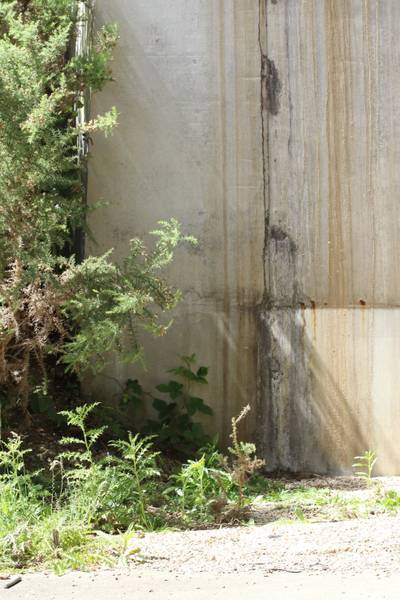
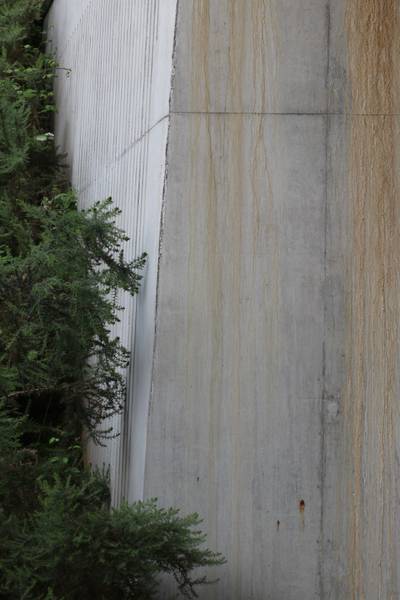
The authors’ work focuses on two pivotal aspects of concrete defect recognition: the creation of a labeled multi-target dataset with overlapping defect categories and the design of specialized deep neural networks for multi-class multi-target defect classification. The CODEBRIM dataset encompasses six mutually exclusive classes: crack, spallation, exposed reinforcement bar, efflorescence (calcium leaching), corrosion stains, and non-defective background. The dataset comprises high-resolution images captured under varying environmental conditions, including wet or stained surfaces, and features diverse bridges with different deterioration levels and surface appearances.
(a) Top row from left to right: 1) exposed bars, spallation, cracks (hard to see); 2) hairline crack with efflorescence; 3) efflorescence; 4) defect-free concrete. Bottom row from left to right: 1) large spalled area with exposed bars and corrosion; 2) crack with graffiti; 3) corrosion stain, minor onset efflorescence; 4) defect-free concrete with dirt and markings.
(b) From left to right: 1) spalled area with exposed bar, advanced corrosion and efflorescence; 2) exposed corroded bar; 3) larger crack; 4) partially exposed corroded bars, cracks; 5) hairline crack; 6) heavy spallation, exposed bars, corrosion; 7) wet/damp crack with efflorescence on the top; 8) efflorescence; 9) spalled area; 10) hairline crack with efflorescence.
The acquisition of the CODEBRIM dataset stemmed from the necessity for a more comprehensive representation of overlapping defect classes, extending beyond previous research primarily focused on cracks. The authors meticulously curated and annotated the dataset, resulting in a rich resource for training and evaluating computer vision models.
The dataset encompasses:
- 1590 high-resolution images depicting defects within the context of 30 distinct bridges,
- 5354 annotated defect bounding boxes, often exhibiting overlapping defects, alongside 2506 generated non-overlapping background bounding boxes,
- Varied defect counts for distinct classes: crack (2507), spallation (1898), efflorescence (833), exposed bars (1507), and corrosion stain (1559).
Note, that the number of objects in DatasetNinja may differ in comparison with the original dataset due to the conversion effects.
The multi-target nature of the dataset adds complexity compared to single-class recognition benchmarks, as many instances exhibit more than one class simultaneously. Moreover, the task presents challenges related to variations in aspect ratio, scale, and resolution across different defects and their bounding boxes. These intricacies are crucial for developing effective defect recognition algorithms, as they mirror real-world scenarios in concrete infrastructure assessment. Further details and comprehensive distributions are available in the supplementary material in the Research Paper.
Summary #
CODEBRIM: COncrete DEfect BRidge IMage Dataset is a dataset for an object detection task. It is used in the construction industry.
The dataset consists of 1590 images with 8323 labeled objects belonging to 6 different classes including crack, corrosion stain, spallation, and other: exposed bars, efflorescence, and background.
Images in the CODEBRIM dataset have bounding box annotations. There are 567 (36% of the total) unlabeled images (i.e. without annotations). There are no pre-defined train/val/test splits in the dataset. Additionally, bounding boxes with 2 or more classes are marked as duplicate bbox. Run dataset in supervisely to explore. The dataset was released in 2019 by the Goethe University, Germany and Egnatia Odos A. E., Greece.
Here are the visualized examples for the classes:
Explore #
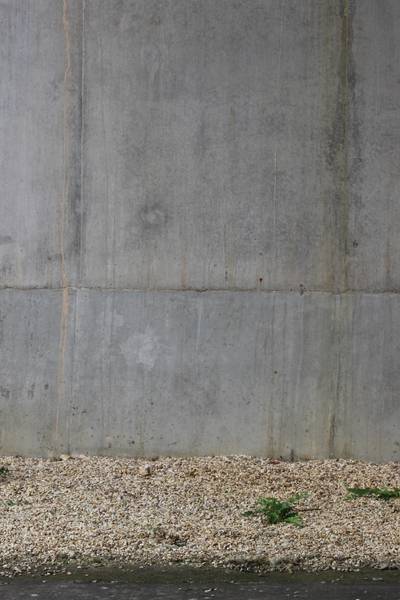
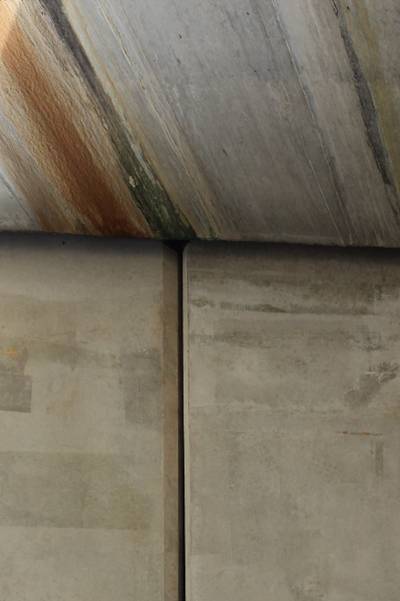
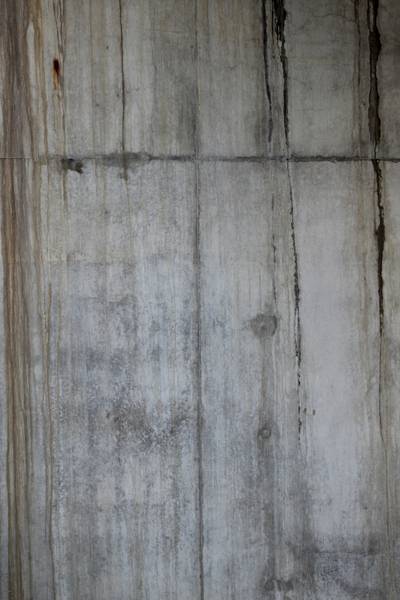
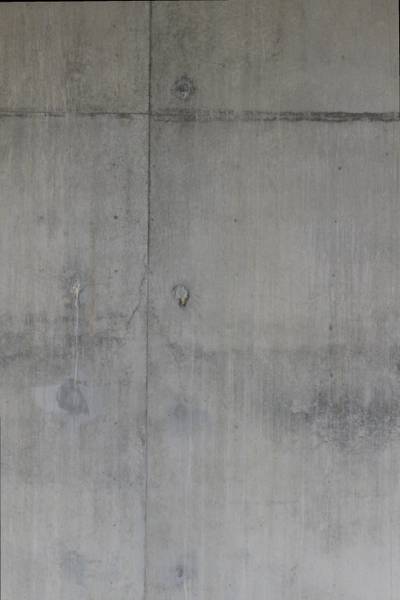
CODEBRIM dataset has 1590 images. Click on one of the examples below or open "Explore" tool anytime you need to view dataset images with annotations. This tool has extended visualization capabilities like zoom, translation, objects table, custom filters and more. Hover the mouse over the images to hide or show annotations.













Class balance #
There are 6 annotation classes in the dataset. Find the general statistics and balances for every class in the table below. Click any row to preview images that have labels of the selected class. Sort by column to find the most rare or prevalent classes.
Class ㅤ | Images ㅤ | Objects ㅤ | Count on image average | Area on image average |
|---|---|---|---|---|
crack➔ rectangle | 629 | 2502 | 3.98 | 15.39% |
corrosion stain➔ rectangle | 573 | 1550 | 2.71 | 23.13% |
spallation➔ rectangle | 563 | 1892 | 3.36 | 28.44% |
exposed bars➔ rectangle | 446 | 1502 | 3.37 | 29.27% |
efflorescence➔ rectangle | 320 | 828 | 2.59 | 18.83% |
background➔ rectangle | 40 | 49 | 1.23 | 10.19% |
Co-occurrence matrix #
Co-occurrence matrix is an extremely valuable tool that shows you the images for every pair of classes: how many images have objects of both classes at the same time. If you click any cell, you will see those images. We added the tooltip with an explanation for every cell for your convenience, just hover the mouse over a cell to preview the description.
Images #
Explore every single image in the dataset with respect to the number of annotations of each class it has. Click a row to preview selected image. Sort by any column to find anomalies and edge cases. Use horizontal scroll if the table has many columns for a large number of classes in the dataset.
Object distribution #
Interactive heatmap chart for every class with object distribution shows how many images are in the dataset with a certain number of objects of a specific class. Users can click cell and see the list of all corresponding images.
Class sizes #
The table below gives various size properties of objects for every class. Click a row to see the image with annotations of the selected class. Sort columns to find classes with the smallest or largest objects or understand the size differences between classes.
Class | Object count | Avg area | Max area | Min area | Min height | Min height | Max height | Max height | Avg height | Avg height | Min width | Min width | Max width | Max width |
|---|---|---|---|---|---|---|---|---|---|---|---|---|---|---|
crack rectangle | 2502 | 4.07% | 99.95% | 0.03% | 23px | 1.42% | 3994px | 99.97% | 608px | 19.53% | 34px | 1% | 5424px | 99.98% |
spallation rectangle | 1892 | 10.47% | 99.95% | 0.02% | 32px | 1.56% | 3999px | 99.97% | 990px | 30.29% | 40px | 0.87% | 5424px | 99.98% |
corrosion stain rectangle | 1550 | 9.63% | 99.94% | 0.02% | 31px | 1.56% | 3999px | 99.97% | 964px | 30.49% | 34px | 0.87% | 5998px | 99.98% |
exposed bars rectangle | 1502 | 10.8% | 99.94% | 0.02% | 31px | 1.56% | 3999px | 99.97% | 994px | 30.49% | 37px | 0.87% | 4692px | 99.98% |
efflorescence rectangle | 828 | 7.65% | 99.91% | 0.05% | 46px | 1.39% | 3999px | 99.97% | 838px | 28.08% | 48px | 1.75% | 5424px | 99.93% |
background rectangle | 49 | 8.33% | 53.92% | 0.07% | 76px | 2.25% | 3185px | 92.16% | 1050px | 30.4% | 129px | 2.8% | 4607px | 99.98% |
Spatial Heatmap #
The heatmaps below give the spatial distributions of all objects for every class. These visualizations provide insights into the most probable and rare object locations on the image. It helps analyze objects' placements in a dataset.

Objects #
Table contains all 8323 objects. Click a row to preview an image with annotations, and use search or pagination to navigate. Sort columns to find outliers in the dataset.
Object ID ㅤ | Class ㅤ | Image name click row to open | Image size height x width | Height ㅤ | Height ㅤ | Width ㅤ | Width ㅤ | Area ㅤ |
|---|---|---|---|---|---|---|---|---|
1➔ | crack rectangle | image_0001467.jpg | 3456 x 4608 | 730px | 21.12% | 193px | 4.19% | 0.88% |
2➔ | crack rectangle | image_0001467.jpg | 3456 x 4608 | 719px | 20.8% | 340px | 7.38% | 1.54% |
3➔ | crack rectangle | image_0001467.jpg | 3456 x 4608 | 1272px | 36.81% | 266px | 5.77% | 2.12% |
4➔ | crack rectangle | image_0001467.jpg | 3456 x 4608 | 622px | 18% | 231px | 5.01% | 0.9% |
5➔ | exposed bars rectangle | image_0001467.jpg | 3456 x 4608 | 688px | 19.91% | 314px | 6.81% | 1.36% |
6➔ | crack rectangle | image_0001467.jpg | 3456 x 4608 | 1075px | 31.11% | 267px | 5.79% | 1.8% |
7➔ | crack rectangle | image_0001467.jpg | 3456 x 4608 | 816px | 23.61% | 437px | 9.48% | 2.24% |
8➔ | efflorescence rectangle | image_0001467.jpg | 3456 x 4608 | 419px | 12.12% | 728px | 15.8% | 1.92% |
9➔ | crack rectangle | image_0001467.jpg | 3456 x 4608 | 560px | 16.2% | 331px | 7.18% | 1.16% |
10➔ | spallation rectangle | image_0000671.jpg | 1704 x 2272 | 585px | 34.33% | 743px | 32.7% | 11.23% |
License #
CODEBRIM license statement
The researcher has requested permission to use the CODEBRIM database at Goethe University (GU), Frankfurt Institute for Advanced Studies (FIAS), Center for Advanced Aerospace Technologies (CATEC) and Egnatia Odos A.E. (EOAE). In exchange for such permission the researcher agrees and is bound by the following terms and conditions:
- The CODEBRIM database comes “AS IS”. While we (GU, FIAS, CATEC, EOAE) have made every effort to ensure accuracy, no representations or warranties regarding the database are made. This includes but is not limited to warranties of non-infringement or fitness for a particular purpose and no responsibility is accepted for errors or omissions.
- The researcher shall use the database for non-commercial research and educational purposes only. If the researcher is employed by a for-profit, commercial entitity, the researcher’s employer shall also be bound by these terms and conditions and the researcher hereby represents full authorization to enter this agreement on behalf of such employer.
- The researcher may not use modified versions of the dataset or any derivative works (such as additional annotations, trained models or anything that directly includes any of the data) to procure a commercial gain.
- The researcher shall not distribute the database or modified versions thereof. Access to the database to fellow research associates and colleagues may be granted provided that they first agree to be bound by these terms and conditions.
- Derivative works such as additional annotations or trained models that do not directly include any of the data are permissible to be shared under the same license agreement for non-commercial and educational purposes.
- The researcher shall include a reference to the CODEBRIM database and its corresponding publication: “Meta-learning Convolutional Neural Architectures for Multi-target Concrete Defect Classification with the COncrete DEfect BRidge IMage Dataset; Martin Mundt, Sagnik Majumder, Sreenivas Murali, Panagiotis Panetsos and Visvanathan Ramesh; Conference on Computer Vision and Pattern Recognition, 2019” in any work that makes use of the database.
- All rights not expressly granted to the researcher are reserved by us. They reserve the right to terminate the researcher’s access to the database at any time.
Citation #
If you make use of the CODEBRIM data, please cite the following reference:
@dataset{martin_mundt_2019_2620293,
  author       = {Martin Mundt and
                  Sagnik Majumder and
                  Sreenivas Murali and
                  Panagiotis Panetsos and
                  Visvanathan Ramesh},
  title        = {CODEBRIM: COncrete DEfect BRidge IMage Dataset},
  month        = apr,
  year         = 2019,
  publisher    = {Zenodo},
  version      = {1.0},
  doi          = {10.5281/zenodo.2620293},
  url          = {https://doi.org/10.5281/zenodo.2620293}
}
If you are happy with Dataset Ninja and use provided visualizations and tools in your work, please cite us:
@misc{ visualization-tools-for-codebrim-dataset,
  title = { Visualization Tools for CODEBRIM Dataset },
  type = { Computer Vision Tools },
  author = { Dataset Ninja },
  howpublished = { \url{ https://datasetninja.com/codebrim } },
  url = { https://datasetninja.com/codebrim },
  journal = { Dataset Ninja },
  publisher = { Dataset Ninja },
  year = { 2026 },
  month = { feb },
  note = { visited on 2026-02-09 },
}
Download #
Please visit dataset homepage to download the data.
Disclaimer #
Our gal from the legal dep told us we need to post this:
Dataset Ninja provides visualizations and statistics for some datasets that can be found online and can be downloaded by general audience. Dataset Ninja is not a dataset hosting platform and can only be used for informational purposes. The platform does not claim any rights for the original content, including images, videos, annotations and descriptions. Joint publishing is prohibited.
You take full responsibility when you use datasets presented at Dataset Ninja, as well as other information, including visualizations and statistics we provide. You are in charge of compliance with any dataset license and all other permissions. You are required to navigate datasets homepage and make sure that you can use it. In case of any questions, get in touch with us at hello@datasetninja.com.


