

Introduction #
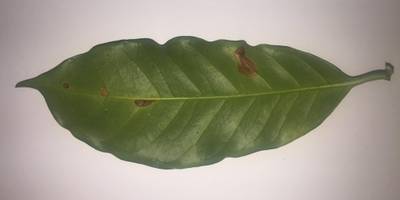
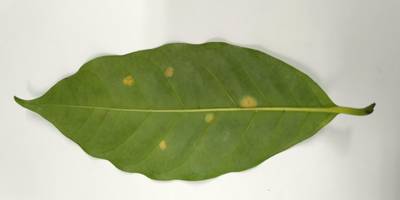
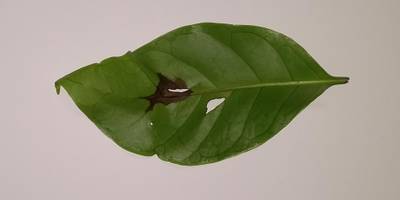
The Coffee Leaf Biotic Stress dataset asserts that biotic stress involves plant damage inflicted by living organisms. Effectively managing biotic agents, such as pests and pathogens (viruses, fungi, bacteria, etc.), is intricately linked to the concept of agricultural sustainability. Agricultural sustainability advocates for the development of new technologies to minimize environmental impacts, enhance accessibility for farmers, and consequently, boost productivity. Leveraging computer vision with deep learning methods enables the timely and accurate identification of stress-inducing agents. Thus, corrective measures can be promptly implemented to mitigate the issue. The goal of this initiative is to devise an efficient and practical system capable of identifying and assessing the severity of stress caused by biotic agents on coffee leaves.
 Homepage
 Research Paper
Summary #
Deep Learning for Classification and Severity Estimation of Coffee Leaf Biotic Stress is a dataset for instance segmentation, semantic segmentation, and object detection tasks. It is used in the agricultural industry, and in the biological research.
The dataset consists of 500 images with 2977 labeled objects belonging to 2 different classes including leaf and symptom.
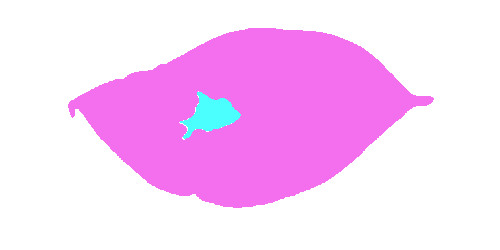
Images in the Coffee Leaf Biotic Stress dataset have pixel-level instance segmentation annotations. Due to the nature of the instance segmentation task, it can be automatically transformed into a semantic segmentation (only one mask for every class) or object detection (bounding boxes for every object) tasks. All images are labeled (i.e. with annotations). There are 3 splits in the dataset: Train (400 images), Test (50 images), and Val (50 images). The dataset was released in 2019 by the Federal University of Espírito Santo, Brazil.
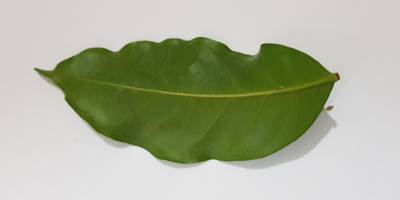
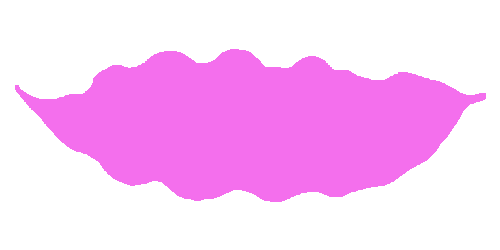
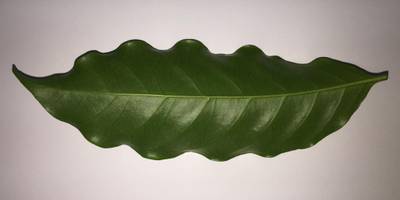
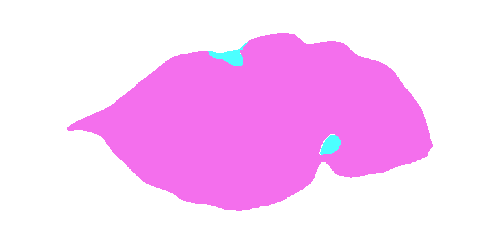
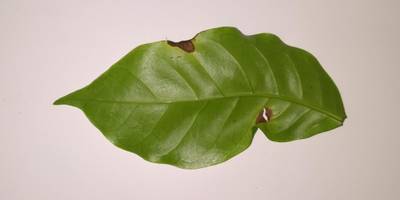
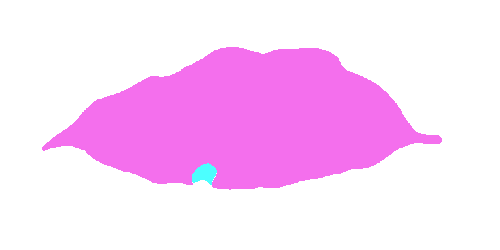
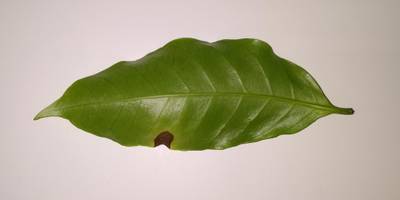
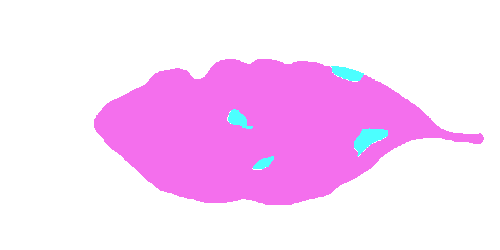
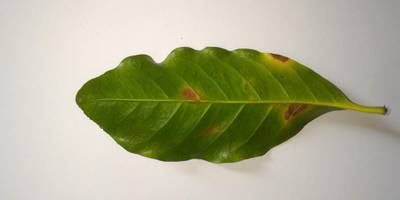
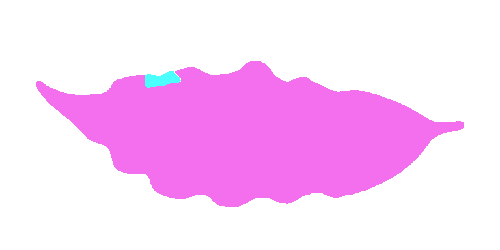
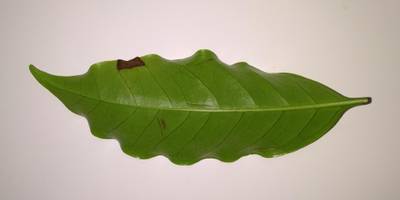
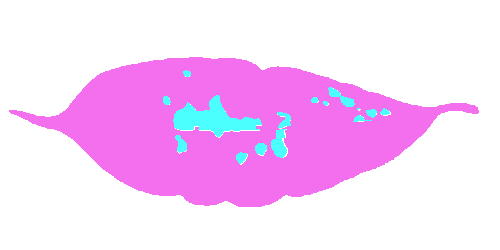
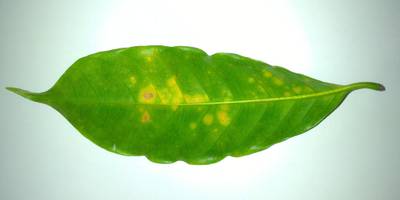
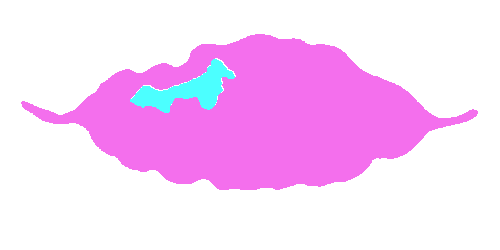
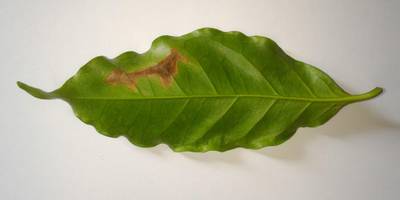
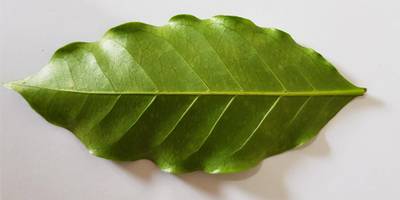
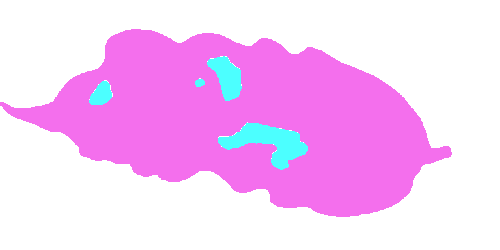
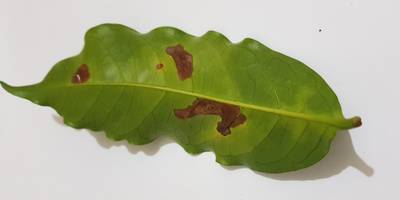
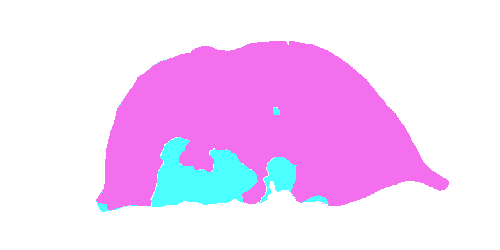
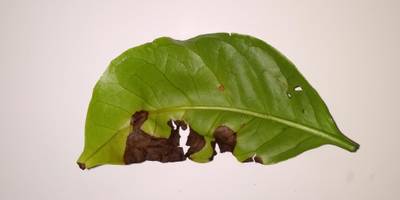
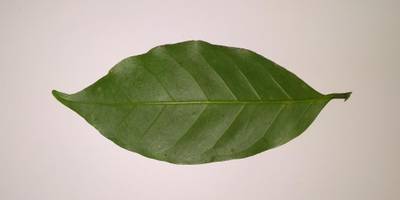
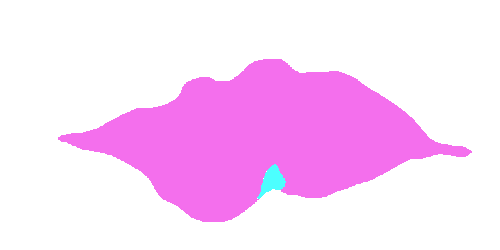
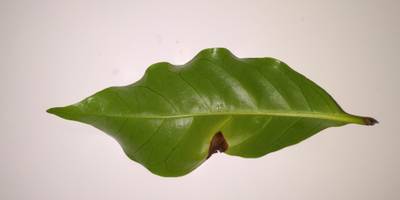
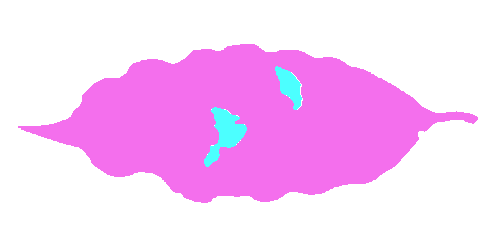
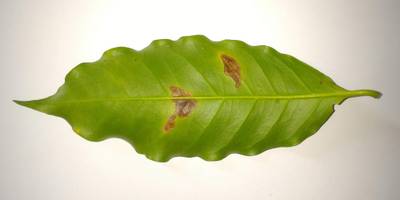
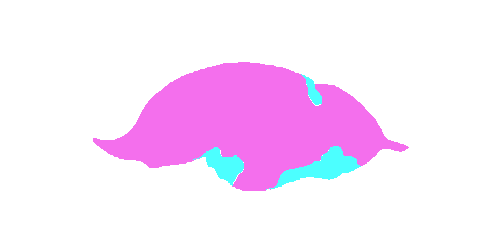
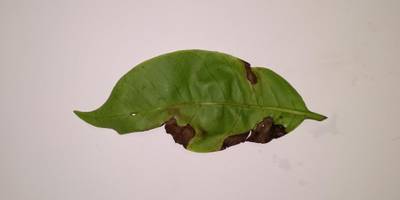
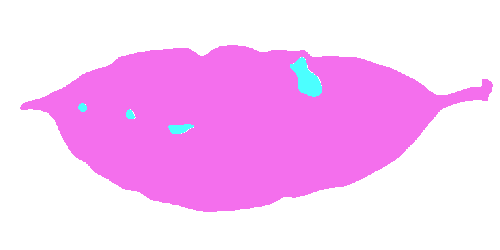
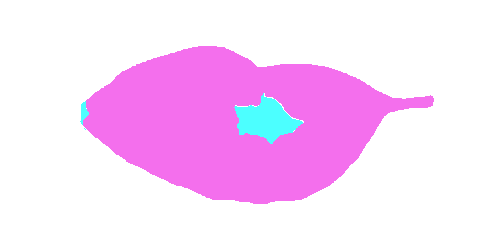
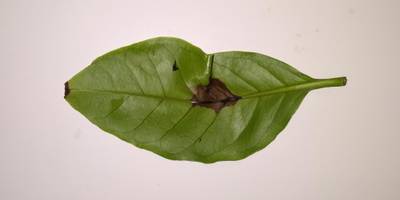
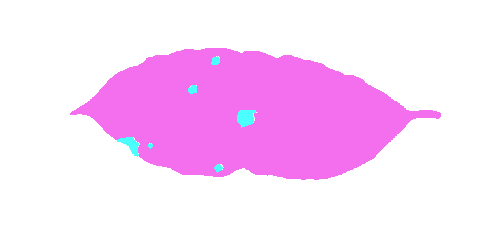
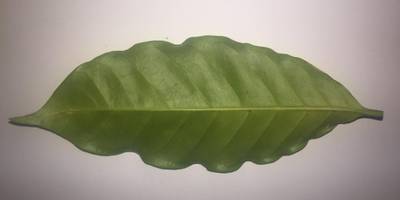
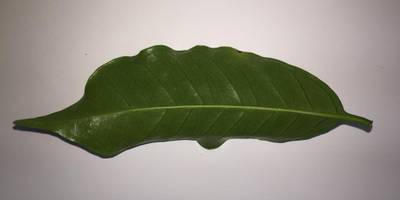
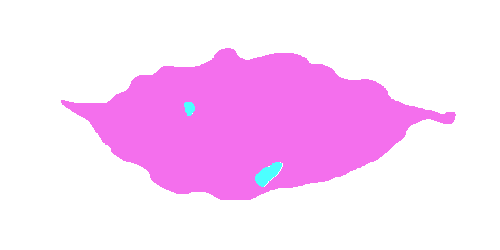
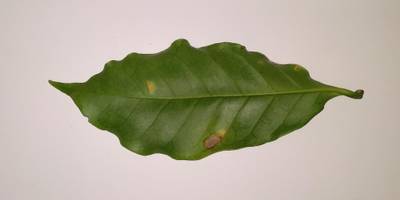
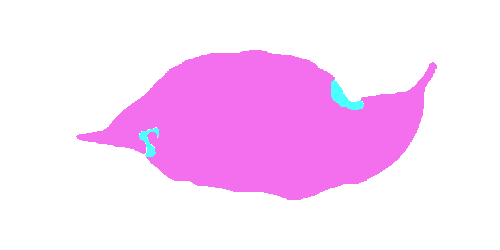
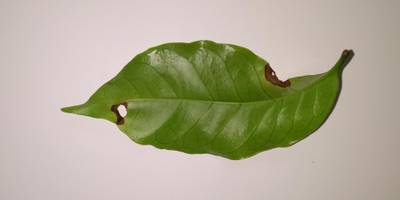
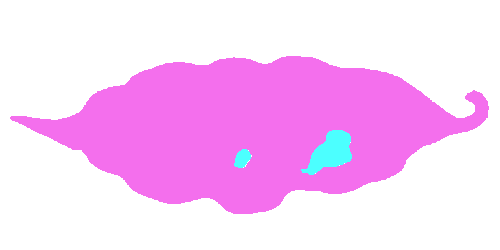
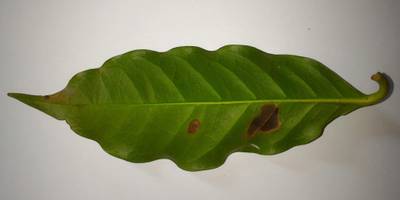
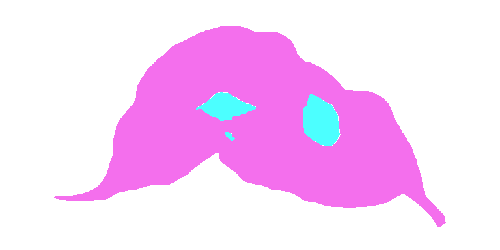
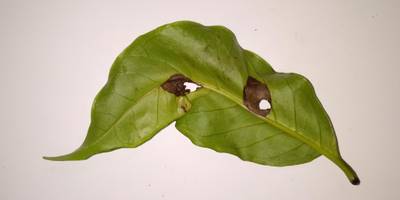
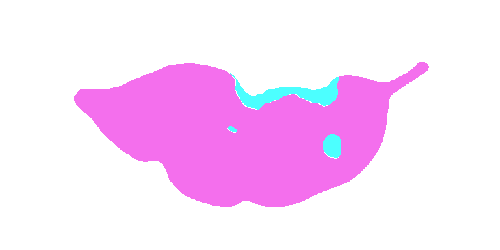
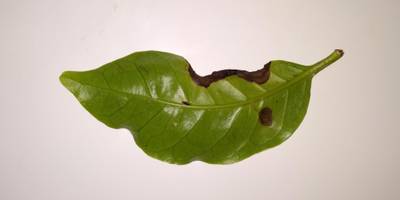
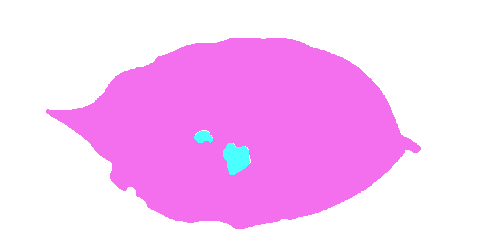
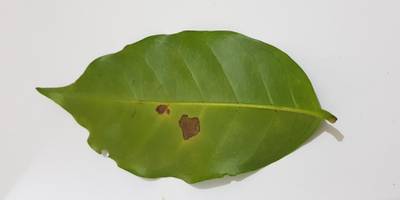
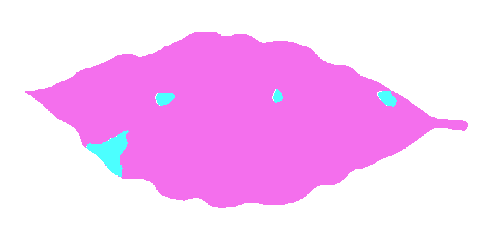
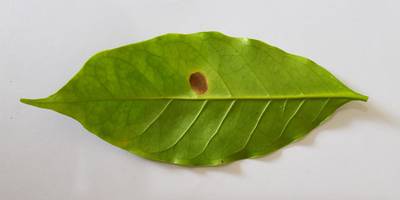
Here is the visualized example grid with animated annotations:
Explore #
Coffee Leaf Biotic Stress dataset has 500 images. Click on one of the examples below or open "Explore" tool anytime you need to view dataset images with annotations. This tool has extended visualization capabilities like zoom, translation, objects table, custom filters and more. Hover the mouse over the images to hide or show annotations.


Class balance #
There are 2 annotation classes in the dataset. Find the general statistics and balances for every class in the table below. Click any row to preview images that have labels of the selected class. Sort by column to find the most rare or prevalent classes.

Class ㅤ | Images ㅤ | Objects ㅤ | Count on image average | Area on image average |
|---|---|---|---|---|
leaf➔ mask | 500 | 500 | 1 | 31.63% |
symptom➔ mask | 400 | 2477 | 6.19 | 1.61% |
Co-occurrence matrix #
Co-occurrence matrix is an extremely valuable tool that shows you the images for every pair of classes: how many images have objects of both classes at the same time. If you click any cell, you will see those images. We added the tooltip with an explanation for every cell for your convenience, just hover the mouse over a cell to preview the description.
Images #
Explore every single image in the dataset with respect to the number of annotations of each class it has. Click a row to preview selected image. Sort by any column to find anomalies and edge cases. Use horizontal scroll if the table has many columns for a large number of classes in the dataset.
Object distribution #
Interactive heatmap chart for every class with object distribution shows how many images are in the dataset with a certain number of objects of a specific class. Users can click cell and see the list of all corresponding images.
Class sizes #
The table below gives various size properties of objects for every class. Click a row to see the image with annotations of the selected class. Sort columns to find classes with the smallest or largest objects or understand the size differences between classes.
Class | Object count | Avg area | Max area | Min area | Min height | Min height | Max height | Max height | Avg height | Avg height | Min width | Min width | Max width | Max width |
|---|---|---|---|---|---|---|---|---|---|---|---|---|---|---|
symptom mask | 2477 | 0.26% | 5.69% | 0% | 1px | 0.1% | 565px | 55.18% | 70px | 6.88% | 1px | 0.05% | 1078px | 52.64% |
leaf mask | 500 | 31.63% | 47.45% | 17.18% | 448px | 43.75% | 1024px | 100% | 666px | 65.01% | 1293px | 63.13% | 2048px | 100% |
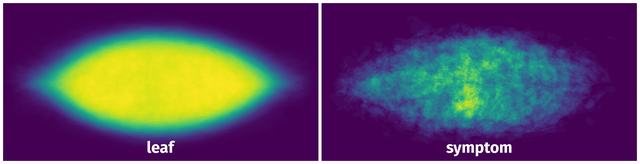
Spatial Heatmap #
The heatmaps below give the spatial distributions of all objects for every class. These visualizations provide insights into the most probable and rare object locations on the image. It helps analyze objects' placements in a dataset.
Objects #
Table contains all 2977 objects. Click a row to preview an image with annotations, and use search or pagination to navigate. Sort columns to find outliers in the dataset.
Object ID ㅤ | Class ㅤ | Image name click row to open | Image size height x width | Height ㅤ | Height ㅤ | Width ㅤ | Width ㅤ | Area ㅤ |
|---|---|---|---|---|---|---|---|---|
1➔ | leaf mask | 926.jpg | 1024 x 2048 | 776px | 75.78% | 1690px | 82.52% | 35.55% |
2➔ | symptom mask | 926.jpg | 1024 x 2048 | 144px | 14.06% | 200px | 9.77% | 0.66% |
3➔ | symptom mask | 926.jpg | 1024 x 2048 | 24px | 2.34% | 27px | 1.32% | 0.02% |
4➔ | symptom mask | 926.jpg | 1024 x 2048 | 290px | 28.32% | 213px | 10.4% | 1.55% |
5➔ | leaf mask | 608.jpg | 1024 x 2048 | 677px | 66.11% | 1558px | 76.07% | 33.03% |
6➔ | symptom mask | 608.jpg | 1024 x 2048 | 64px | 6.25% | 48px | 2.34% | 0.12% |
7➔ | leaf mask | 855.jpg | 1024 x 2048 | 675px | 65.92% | 1642px | 80.18% | 32.64% |
8➔ | symptom mask | 855.jpg | 1024 x 2048 | 16px | 1.56% | 27px | 1.32% | 0.02% |
9➔ | symptom mask | 855.jpg | 1024 x 2048 | 168px | 16.41% | 104px | 5.08% | 0.54% |
10➔ | symptom mask | 855.jpg | 1024 x 2048 | 130px | 12.7% | 248px | 12.11% | 1% |
License #
Citation #
If you make use of the Coffee Leaf Biotic Stress data, please cite the following reference:
@dataset{Coffee Leaf Biotic Stress,
	author={Guilherme Esgario and Pedro Biasutti},
	title={Deep Learning for Classification and Severity Estimation of Coffee Leaf Biotic Stress},
	year={2019},
	url={https://github.com/esgario/lara2018/}
}
If you are happy with Dataset Ninja and use provided visualizations and tools in your work, please cite us:
@misc{ visualization-tools-for-coffee-leaf-biotic-stress-dataset,
  title = { Visualization Tools for Coffee Leaf Biotic Stress Dataset },
  type = { Computer Vision Tools },
  author = { Dataset Ninja },
  howpublished = { \url{ https://datasetninja.com/coffee-leaf-biotic-stress } },
  url = { https://datasetninja.com/coffee-leaf-biotic-stress },
  journal = { Dataset Ninja },
  publisher = { Dataset Ninja },
  year = { 2026 },
  month = { jul },
  note = { visited on 2026-07-20 },
}
Download #
Dataset Coffee Leaf Biotic Stress can be downloaded in Supervisely format:
As an alternative, it can be downloaded with dataset-tools package:
pip install --upgrade dataset-tools
… using following python code:
import dataset_tools as dtools

dtools.download(dataset='Coffee Leaf Biotic Stress', dst_dir='~/dataset-ninja/')
Make sure not to overlook the python code example available on the Supervisely Developer Portal. It will give you a clear idea of how to effortlessly work with the downloaded dataset.
The data in original format can be downloaded here.
Disclaimer #
Our gal from the legal dep told us we need to post this:
Dataset Ninja provides visualizations and statistics for some datasets that can be found online and can be downloaded by general audience. Dataset Ninja is not a dataset hosting platform and can only be used for informational purposes. The platform does not claim any rights for the original content, including images, videos, annotations and descriptions. Joint publishing is prohibited.
You take full responsibility when you use datasets presented at Dataset Ninja, as well as other information, including visualizations and statistics we provide. You are in charge of compliance with any dataset license and all other permissions. You are required to navigate datasets homepage and make sure that you can use it. In case of any questions, get in touch with us at hello@datasetninja.com.