Introduction #
The authors created a new CORE50: Continuous Object Recognition Dataset, specifically designed for continuous object recognition, and introduce baseline approaches for different continuous learning scenarios. The dataset has been collected in 11 distinct sessions (8 indoor and 3 outdoor) characterized by different backgrounds and lighting. For each session and for each class object, a 15 seconds video (at 20 fps) has been recorded with a Kinect 2.0 sensor delivering 300 RGB-D frames.
Motivation
Datasets like ImageNet and Pascal VOC offer a robust platform for classification and detection methodologies. However, they primarily adhere to “static” evaluation protocols, dividing the dataset into just two parts: a training set for initial learning and a separate test set for accuracy assessment. For continuous learning approaches, which are currently a focal point of research interest, splitting the training set into multiple batches is crucial. Unfortunately, many existing datasets lack a crucial component for this purpose: multiple, unconstrained views of the same objects captured across different sessions, each with varying backgrounds, lighting conditions, poses, occlusions, and so forth. In the realm of Object Recognition, the authors examine three continuous learning scenarios:
- New Instances (NI): new training patterns of the same classes become available in subsequent batches with new poses and conditions (illumination, background, occlusion, etc.). A good model is expected to incrementally consolidate its knowledge about the known classes without compromising what it has learned before.
- New Classes (NC): new training patterns belonging to different classes become available in subsequent batches. In this case the model should be able to deal with the new classes without losing accuracy on the previous ones.
- New Instances and Classes (NIC): new training patterns belonging both to known and new classes become available in subsequent training batches. A good model is expected to consolidate its knowledge about the known classes and to learn the new ones.
It’s evident that addressing such intricate scenarios necessitates datasets and benchmarks explicitly tailored for continuous learning, facilitating the evaluation and comparison of emerging methodologies. An ideal dataset should encompass a large number of classes that can be incrementally added in subsequent batches. More importantly, it should feature a multitude of views for each class acquired across different sessions. The inclusion of temporally coherent sessions, such as videos where objects move smoothly in front of the camera, is crucial. Temporal consistency can simplify object detection, enhance classification accuracy, and address unsupervised scenarios effectively. In the context of real-world continuous learning, assuming the utilization of all past data at each training step (i.e., a cumulative approach) not only diverges significantly from biological learning but is also impractical for engineering applications. This approach would entail storing all previous data streams and retraining the model on the entire dataset each time new data becomes available. Updating a pre-trained model solely with new data is a more viable option, considering computational and memory constraints.
Recent advancements in transfer learning and fine-tuning with deep neural networks have demonstrated the utility of leveraging previously acquired knowledge for tackling new tasks. However, there remains a notable gap in the context of continuous learning, where a single model is tasked with addressing new tasks while maintaining proficiency on previous ones. Preserving previously acquired knowledge without revisiting old patterns poses a significant challenge, often leading to catastrophic forgetting—a phenomenon wherein previously learned information is severely compromised.
Dataset description
CORe50, specifically designed for ©ontinuous (O)bject (Re)cognition, is a collection of 50 domestic objects belonging to 10 categories: plug adapter, mobile phone, scissor, light bulb, can, glasse, ball, marker, cup and remote control.
Example images of the 50 objects in CORe50. Each column denotes one of the 10 categories.
Classification tasks can be conducted either at the object level, involving 50 distinct classes, or at the category level, with 10 broader classes. The former, considered the default task, is notably more demanding due to the inherent challenge of distinguishing between objects within the same category, particularly under varying poses. The dataset was gathered across 11 separate sessions, comprising 8 indoor and 3 outdoor environments, each characterized by diverse backgrounds and lighting conditions. In each session, a 15-second video was recorded using a Kinect 2.0 sensor, capturing 300 RGB-D frames. The operator manually holds the objects while the camera adopts the operator’s point-of-view, providing a subjective, grab-distance perspective ideal for numerous robotic applications. Throughout the sessions, the grabbing hand alternates between left and right, often leading to occlusions of relevant objects caused by the hand itself. The raw data consists of 1024 × 575 RGB frames and 512 × 424 Depth frames, with depth information calibrated to match RGB coordinates. An acquisition interface specifies a central region for object placement, facilitating an initial fixed cropping process that reduces the frame size to 350 × 350 pixels.
Example of 1 second recording (at 20 fps) of object #26 in session #4 (outdoor). Note the smooth movement, pose change and partial occlusion. The 128 × 128 frames here shown have been automatically cropped from 350 × 350 images based on a fully automated tracker.
Given that domestic objects typically span less than 100 × 100 pixels at arm’s length, only a small portion of the frame captures the object of interest. To address this, the authors utilized temporal information to crop a 128 × 128 box around the object from each 350 × 350 frame. They implemented a motion-based tracker, operating solely on RGB data, allowing for a similar approach even in the absence of depth information. While the majority of objects are fully contained within the crop window, some may extend beyond its borders, particularly if the object is too close to the camera or if the tracker momentarily loses track due to rapid movement. No manual correction was applied, as the authors believe that tracking imperfections are inevitable and should be addressed in later processing stages. The final dataset comprises 164,866 128 × 128 RGB-D images, encompassing 11 sessions with 50 objects each, and approximately 300 frames per session. Three of the eleven sessions were earmarked for testing, while the remaining eight sessions were allocated for training. The authors endeavored to balance the difficulty levels of training and test sessions, considering factors such as indoor/outdoor settings, the hand used for holding (left or right), and background complexity.
One frame of the same object throughout the 11 acquisition sessions. Note the variability in terms of background, illumination, blurring, occlusion, pose and scale.
Summary #
CORE50: Continuous Object Recognition Dataset is a dataset for object detection, identification, monocular depth estimation, semi supervised learning, unsupervised learning, and classification tasks. It is used in the robotics industry.
The dataset consists of 329738 images with 329737 labeled objects belonging to 10 different classes including glass, can, marker, and other: cup, ball, scissor, plug adapter, mobile phone, light bulb, and remote control.
Images in the CORE50 dataset have bounding box annotations. There is 1 unlabeled image (i.e. without annotations). There are 2 splits in the dataset: train (239838 images) and test (89900 images). Additionally, every image marked with its session, im id and object id tags. The dataset was released in 2017 by the University of Bologna, Italy.

Explore #
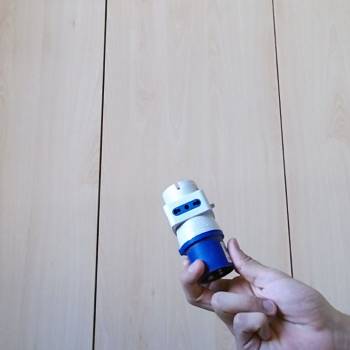
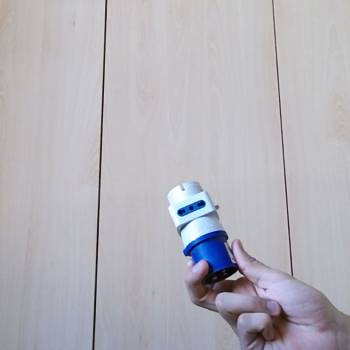
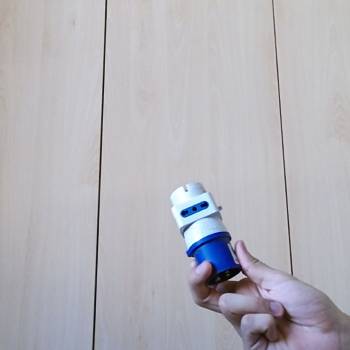
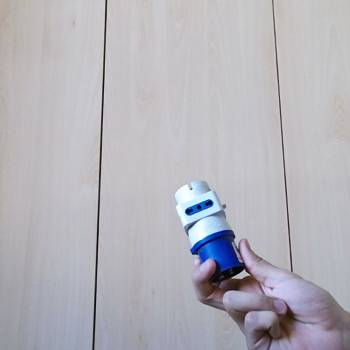
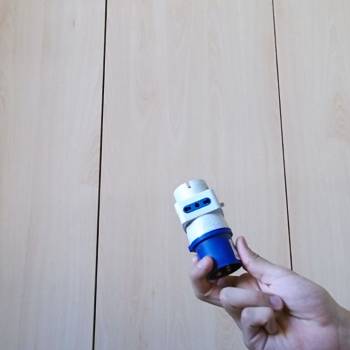
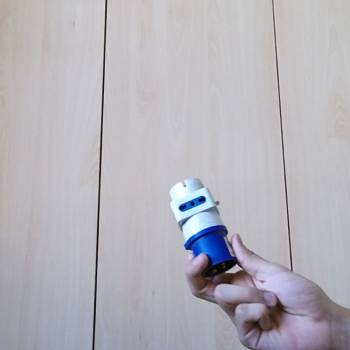
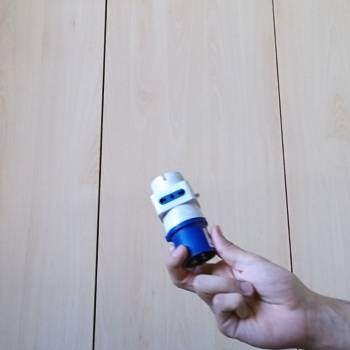
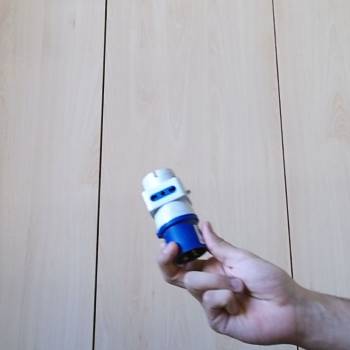
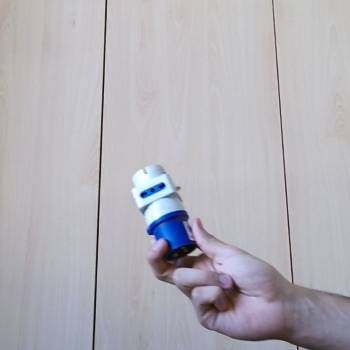
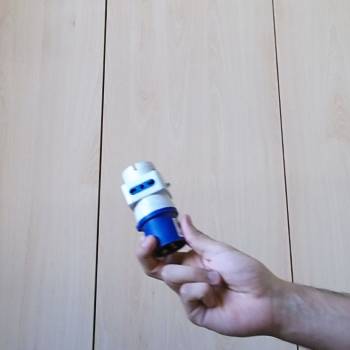
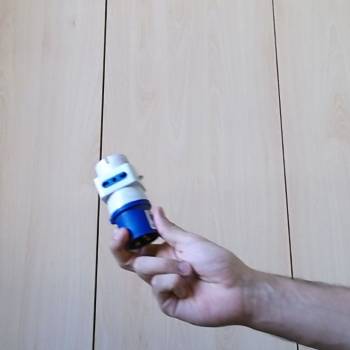
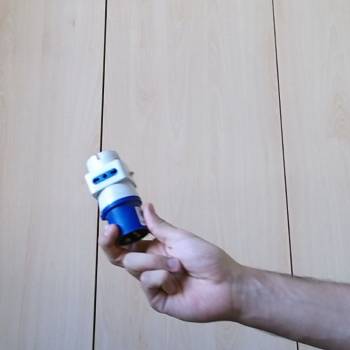
CORE50 dataset has 329738 images. Click on one of the examples below or open "Explore" tool anytime you need to view dataset images with annotations. This tool has extended visualization capabilities like zoom, translation, objects table, custom filters and more. Hover the mouse over the images to hide or show annotations.

























Class balance #
There are 10 annotation classes in the dataset. Find the general statistics and balances for every class in the table below. Click any row to preview images that have labels of the selected class. Sort by column to find the most rare or prevalent classes.
Class ㅤ | Images ㅤ | Objects ㅤ | Count on image average | Area on image average |
|---|---|---|---|---|
glass➔ rectangle | 32985 | 32985 | 1 | 13.37% |
can➔ rectangle | 32979 | 32979 | 1 | 13.37% |
marker➔ rectangle | 32977 | 32977 | 1 | 13.37% |
cup➔ rectangle | 32976 | 32976 | 1 | 13.37% |
ball➔ rectangle | 32974 | 32974 | 1 | 13.37% |
scissor➔ rectangle | 32972 | 32972 | 1 | 13.37% |
plug adapter➔ rectangle | 32970 | 32970 | 1 | 13.37% |
mobile phone➔ rectangle | 32969 | 32969 | 1 | 13.37% |
remote control➔ rectangle | 32968 | 32968 | 1 | 13.37% |
light bulb➔ rectangle | 32968 | 32968 | 1 | 13.37% |
Co-occurrence matrix #
Co-occurrence matrix is an extremely valuable tool that shows you the images for every pair of classes: how many images have objects of both classes at the same time. If you click any cell, you will see those images. We added the tooltip with an explanation for every cell for your convenience, just hover the mouse over a cell to preview the description.
Images #
Explore every single image in the dataset with respect to the number of annotations of each class it has. Click a row to preview selected image. Sort by any column to find anomalies and edge cases. Use horizontal scroll if the table has many columns for a large number of classes in the dataset.
Object distribution #
Interactive heatmap chart for every class with object distribution shows how many images are in the dataset with a certain number of objects of a specific class. Users can click cell and see the list of all corresponding images.
Class sizes #
The table below gives various size properties of objects for every class. Click a row to see the image with annotations of the selected class. Sort columns to find classes with the smallest or largest objects or understand the size differences between classes.
Class | Object count | Avg area | Max area | Min area | Min height | Min height | Max height | Max height | Avg height | Avg height | Min width | Min width | Max width | Max width |
|---|---|---|---|---|---|---|---|---|---|---|---|---|---|---|
glass rectangle | 32985 | 13.37% | 13.37% | 13.17% | 127px | 36.29% | 128px | 36.57% | 128px | 36.57% | 127px | 36.29% | 128px | 36.57% |
can rectangle | 32979 | 13.37% | 13.37% | 13.17% | 127px | 36.29% | 128px | 36.57% | 128px | 36.57% | 127px | 36.29% | 128px | 36.57% |
marker rectangle | 32977 | 13.37% | 13.37% | 13.17% | 127px | 36.29% | 128px | 36.57% | 128px | 36.57% | 127px | 36.29% | 128px | 36.57% |
cup rectangle | 32976 | 13.37% | 13.37% | 13.17% | 127px | 36.29% | 128px | 36.57% | 128px | 36.57% | 127px | 36.29% | 128px | 36.57% |
ball rectangle | 32974 | 13.37% | 13.37% | 13.17% | 127px | 36.29% | 128px | 36.57% | 128px | 36.57% | 127px | 36.29% | 128px | 36.57% |
scissor rectangle | 32972 | 13.37% | 13.37% | 13.17% | 127px | 36.29% | 128px | 36.57% | 128px | 36.57% | 127px | 36.29% | 128px | 36.57% |
plug adapter rectangle | 32970 | 13.37% | 13.37% | 13.17% | 127px | 36.29% | 128px | 36.57% | 128px | 36.57% | 127px | 36.29% | 128px | 36.57% |
mobile phone rectangle | 32969 | 13.37% | 13.37% | 13.17% | 127px | 36.29% | 128px | 36.57% | 128px | 36.57% | 127px | 36.29% | 128px | 36.57% |
remote control rectangle | 32968 | 13.37% | 13.37% | 13.17% | 127px | 36.29% | 128px | 36.57% | 128px | 36.57% | 127px | 36.29% | 128px | 36.57% |
light bulb rectangle | 32968 | 13.37% | 13.37% | 13.17% | 127px | 36.29% | 128px | 36.57% | 128px | 36.57% | 127px | 36.29% | 128px | 36.57% |
Spatial Heatmap #
The heatmaps below give the spatial distributions of all objects for every class. These visualizations provide insights into the most probable and rare object locations on the image. It helps analyze objects' placements in a dataset.

Objects #
Table contains all 99854 objects. Click a row to preview an image with annotations, and use search or pagination to navigate. Sort columns to find outliers in the dataset.
Object ID ㅤ | Class ㅤ | Image name click row to open | Image size height x width | Height ㅤ | Height ㅤ | Width ㅤ | Width ㅤ | Area ㅤ |
|---|---|---|---|---|---|---|---|---|
1➔ | remote control rectangle | C_08_50_188.png | 350 x 350 | 128px | 36.57% | 128px | 36.57% | 13.37% |
2➔ | scissor rectangle | D_09_15_046.png | 350 x 350 | 128px | 36.57% | 128px | 36.57% | 13.37% |
3➔ | light bulb rectangle | D_05_18_140.png | 350 x 350 | 128px | 36.57% | 128px | 36.57% | 13.37% |
4➔ | cup rectangle | C_04_45_128.png | 350 x 350 | 128px | 36.57% | 128px | 36.57% | 13.37% |
5➔ | light bulb rectangle | D_11_19_135.png | 350 x 350 | 128px | 36.57% | 128px | 36.57% | 13.37% |
6➔ | light bulb rectangle | D_09_16_172.png | 350 x 350 | 128px | 36.57% | 128px | 36.57% | 13.37% |
7➔ | plug adapter rectangle | C_05_05_009.png | 350 x 350 | 128px | 36.57% | 128px | 36.57% | 13.37% |
8➔ | light bulb rectangle | D_02_20_068.png | 350 x 350 | 128px | 36.57% | 128px | 36.57% | 13.37% |
9➔ | cup rectangle | C_06_43_001.png | 350 x 350 | 128px | 36.57% | 128px | 36.57% | 13.37% |
10➔ | glass rectangle | C_09_30_235.png | 350 x 350 | 128px | 36.57% | 128px | 36.57% | 13.37% |
License #
CORE50: Continuous Object Recognition Dataset is under CC BY-SA 4.0 license.
Citation #
If you make use of the CORE50 data, please cite the following reference:
@InProceedings{lomonaco2017core50,
  title = {CORe50: a New Dataset and Benchmark for Continuous Object Recognition},
  author = {Vincenzo Lomonaco and Davide Maltoni},
  booktitle = {Proceedings of the 1st Annual Conference on Robot Learning},
  pages = {17--26},
  year = {2017},
  volume = {78}
}
If you are happy with Dataset Ninja and use provided visualizations and tools in your work, please cite us:
@misc{ visualization-tools-for-core50-dataset,
  title = { Visualization Tools for CORE50 Dataset },
  type = { Computer Vision Tools },
  author = { Dataset Ninja },
  howpublished = { \url{ https://datasetninja.com/core50 } },
  url = { https://datasetninja.com/core50 },
  journal = { Dataset Ninja },
  publisher = { Dataset Ninja },
  year = { 2026 },
  month = { feb },
  note = { visited on 2026-02-11 },
}
Download #
Dataset CORE50 can be downloaded in Supervisely format:
As an alternative, it can be downloaded with dataset-tools package:
pip install --upgrade dataset-tools
… using following python code:
import dataset_tools as dtools

dtools.download(dataset='CORE50', dst_dir='~/dataset-ninja/')
Make sure not to overlook the python code example available on the Supervisely Developer Portal. It will give you a clear idea of how to effortlessly work with the downloaded dataset.
The data in original format can be downloaded here:
Disclaimer #
Our gal from the legal dep told us we need to post this:
Dataset Ninja provides visualizations and statistics for some datasets that can be found online and can be downloaded by general audience. Dataset Ninja is not a dataset hosting platform and can only be used for informational purposes. The platform does not claim any rights for the original content, including images, videos, annotations and descriptions. Joint publishing is prohibited.
You take full responsibility when you use datasets presented at Dataset Ninja, as well as other information, including visualizations and statistics we provide. You are in charge of compliance with any dataset license and all other permissions. You are required to navigate datasets homepage and make sure that you can use it. In case of any questions, get in touch with us at hello@datasetninja.com.


