
Introduction #
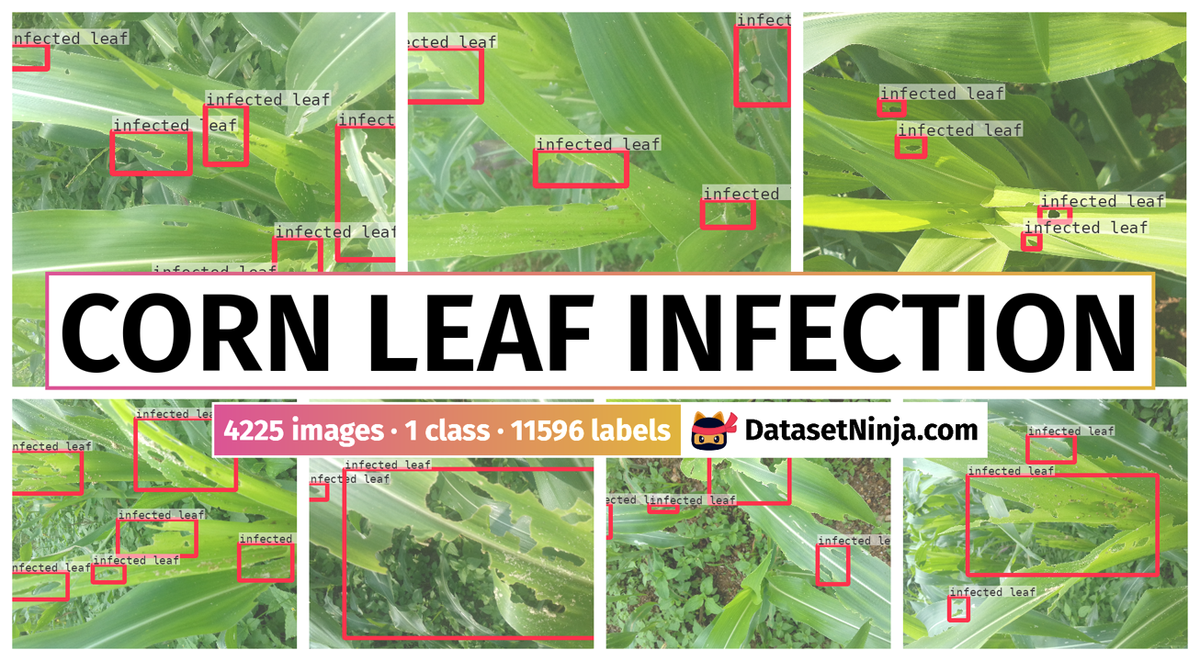
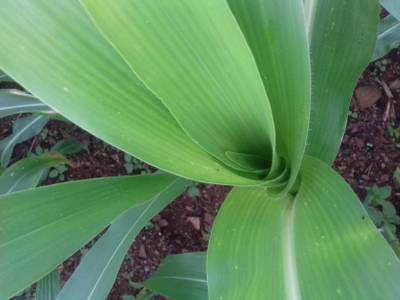
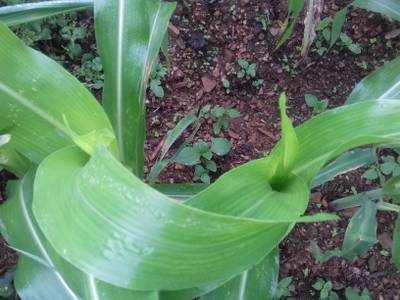
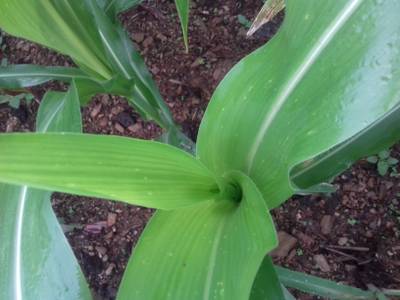
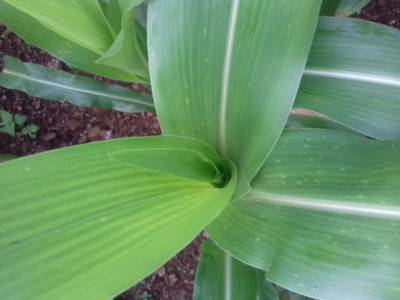
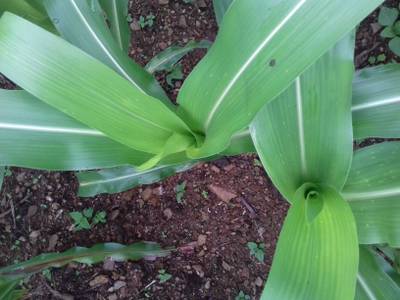
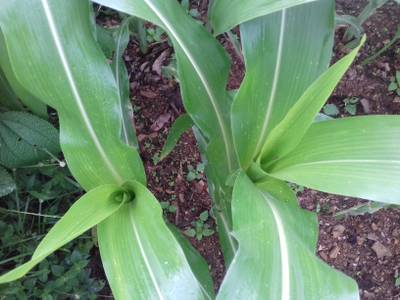
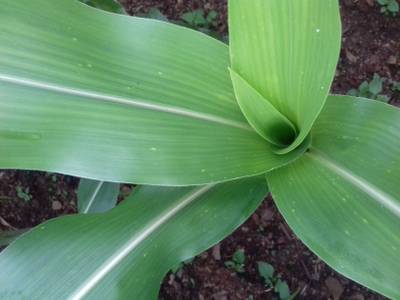
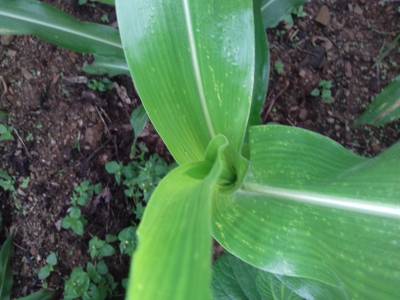
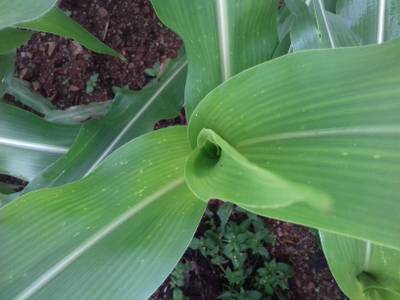
The Corn Leaf Infection Dataset is compiled from cornfields and contains images of corn leaves that have been partially affected by pests such as the Fall Armyworm. These images were captured from ground level using Samsung Galaxy J2 and Samsung Galaxy A30 smartphones, with an average image size of 3000 by 3500 pixels. The dataset comprises over 4,000 images of both infected and non-infected leaves.
 Homepage
 Blog Post
 GitHub
Summary #
Corn Leaf Infection Dataset is a dataset for object detection and classification tasks. Possible applications of the dataset could be in the agricultural industry.
The dataset consists of 4225 images with 11596 labeled objects belonging to 1 single class (infected leaf).
Images in the Corn Leaf Infection dataset have bounding box annotations. There are 2000 (47% of the total) unlabeled images (i.e. without annotations). There are no pre-defined train/val/test splits in the dataset. Alternatively, the dataset could be split into 2 classification sets: infected (2225 images) and healthy (2000 images). The dataset was released in 2020.
Explore #
Corn Leaf Infection dataset has 4225 images. Click on one of the examples below or open "Explore" tool anytime you need to view dataset images with annotations. This tool has extended visualization capabilities like zoom, translation, objects table, custom filters and more. Hover the mouse over the images to hide or show annotations.


Class balance #
There are 1 annotation classes in the dataset. Find the general statistics and balances for every class in the table below. Click any row to preview images that have labels of the selected class. Sort by column to find the most rare or prevalent classes.

Class ㅤ | Images ㅤ | Objects ㅤ | Count on image average | Area on image average |
|---|---|---|---|---|
infected leaf➔ rectangle | 2225 | 11596 | 5.21 | 14.6% |
Images #
Explore every single image in the dataset with respect to the number of annotations of each class it has. Click a row to preview selected image. Sort by any column to find anomalies and edge cases. Use horizontal scroll if the table has many columns for a large number of classes in the dataset.
Object distribution #
Interactive heatmap chart for every class with object distribution shows how many images are in the dataset with a certain number of objects of a specific class. Users can click cell and see the list of all corresponding images.
Class sizes #
The table below gives various size properties of objects for every class. Click a row to see the image with annotations of the selected class. Sort columns to find classes with the smallest or largest objects or understand the size differences between classes.
Class | Object count | Avg area | Max area | Min area | Min height | Min height | Max height | Max height | Avg height | Avg height | Min width | Min width | Max width | Max width |
|---|---|---|---|---|---|---|---|---|---|---|---|---|---|---|
infected leaf rectangle | 11596 | 2.81% | 81.85% | 0% | 1px | 0.03% | 3393px | 99.55% | 394px | 15.71% | 1px | 0.02% | 3278px | 100% |
Spatial Heatmap #
The heatmaps below give the spatial distributions of all objects for every class. These visualizations provide insights into the most probable and rare object locations on the image. It helps analyze objects' placements in a dataset.

Objects #
Table contains all 11596 objects. Click a row to preview an image with annotations, and use search or pagination to navigate. Sort columns to find outliers in the dataset.
Object ID ㅤ | Class ㅤ | Image name click row to open | Image size height x width | Height ㅤ | Height ㅤ | Width ㅤ | Width ㅤ | Area ㅤ |
|---|---|---|---|---|---|---|---|---|
1➔ | infected leaf rectangle | infected_20200701_085039.jpg | 2448 x 3264 | 155px | 6.33% | 366px | 11.21% | 0.71% |
2➔ | infected leaf rectangle | infected_20200701_085039.jpg | 2448 x 3264 | 312px | 12.75% | 340px | 10.42% | 1.33% |
3➔ | infected leaf rectangle | infected_20200701_085039.jpg | 2448 x 3264 | 264px | 10.78% | 846px | 25.92% | 2.8% |
4➔ | infected leaf rectangle | infected_20200701_085039.jpg | 2448 x 3264 | 271px | 11.07% | 485px | 14.86% | 1.64% |
5➔ | infected leaf rectangle | infected_20200701_085039.jpg | 2448 x 3264 | 264px | 10.78% | 460px | 14.09% | 1.52% |
6➔ | infected leaf rectangle | infected_20200701_085039.jpg | 2448 x 3264 | 185px | 7.56% | 362px | 11.09% | 0.84% |
7➔ | infected leaf rectangle | infected_20200701_085039.jpg | 2448 x 3264 | 249px | 10.17% | 568px | 17.4% | 1.77% |
8➔ | infected leaf rectangle | infected_20200701_085039.jpg | 2448 x 3264 | 155px | 6.33% | 482px | 14.77% | 0.94% |
9➔ | infected leaf rectangle | infected_20200701_085039.jpg | 2448 x 3264 | 342px | 13.97% | 212px | 6.5% | 0.91% |
10➔ | infected leaf rectangle | infected_20200701_090953.jpg | 2448 x 3264 | 297px | 12.13% | 418px | 12.81% | 1.55% |
License #
License is unknown for the Corn Leaf Infection Dataset dataset.
Citation #
If you make use of the Corn Leaf Infection data, please cite the following reference:
Acharya, R. (October 2020)
Corn Leaf Infection Dataset, Version 1.
Retrieved October 2020 from https://www.kaggle.com/qramkrishna/corn-leaf-infection-dataset
If you are happy with Dataset Ninja and use provided visualizations and tools in your work, please cite us:
@misc{ visualization-tools-for-corn-leaf-infection-dataset-dataset,
  title = { Visualization Tools for Corn Leaf Infection Dataset },
  type = { Computer Vision Tools },
  author = { Dataset Ninja },
  howpublished = { \url{ https://datasetninja.com/corn-leaf-infection-dataset } },
  url = { https://datasetninja.com/corn-leaf-infection-dataset },
  journal = { Dataset Ninja },
  publisher = { Dataset Ninja },
  year = { 2026 },
  month = { jul },
  note = { visited on 2026-07-15 },
}
Download #
Please visit dataset homepage to download the data.
Disclaimer #
Our gal from the legal dep told us we need to post this:
Dataset Ninja provides visualizations and statistics for some datasets that can be found online and can be downloaded by general audience. Dataset Ninja is not a dataset hosting platform and can only be used for informational purposes. The platform does not claim any rights for the original content, including images, videos, annotations and descriptions. Joint publishing is prohibited.
You take full responsibility when you use datasets presented at Dataset Ninja, as well as other information, including visualizations and statistics we provide. You are in charge of compliance with any dataset license and all other permissions. You are required to navigate datasets homepage and make sure that you can use it. In case of any questions, get in touch with us at hello@datasetninja.com.