

Introduction #
The CosegPP: Cosegmentation for Plant Phenotyping is a subset of a comprehensive dataset acquired from the LemnaTec Scanalyzer system at the University of Nebraska-Lincoln, a 3D plant phenotyping system. This extensive dataset encompasses a wide range of plant species, imaging techniques, time points, and experimental samples. The LemnaTec system comprises four imaging chambers, each equipped with distinct camera types designed to capture various perspectives, including visible light, infrared, fluorescent, and near-infrared. The flexibility of chamber lifters allows for versatile imaging, resulting in a diverse and rich dataset.
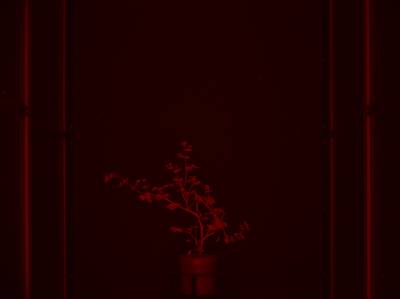
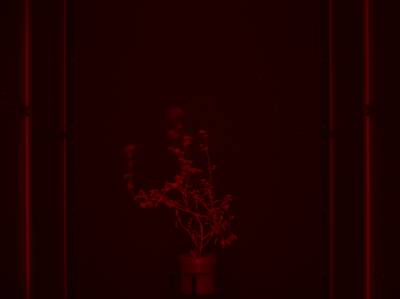
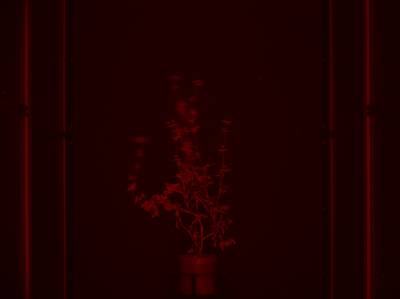
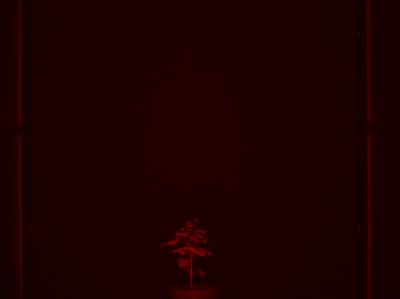
Cosegmentation, an emerging technique in computer vision, focuses on the simultaneous segmentation of objects from their backgrounds in multiple images. Traditional plant phenotyping heavily relies on threshold-based segmentation methods, whereas machine learning approaches often require specific features extracted from training datasets. In the case of CosegPP, this dataset includes images of Buckwheat and Sunflower plants under different experimental conditions, harnessing high-throughput phenotyping technologies.
In the original research paper, the authors assess the CosegPP dataset using various cosegmentation algorithms alongside a conventional plant phenotyping method. Their goal is to establish a benchmark for segmentation accuracy and to facilitate ongoing improvements in segmentation methodologies. This dataset plays a pivotal role in advancing the field of plant phenotyping.
CosegPP has buckwheat-C-1, buckwheat D-1, sunflower-C-1, and sunflower-D-1 as datasets. The dataset name starts with the name of the plant. C indicates control, D indicates drought, and 1 represents the plant ID number. Each dataset has 12 groups that are labeled with combinations of the three modality (fluorescence, IR, Vis), perspectives (SV), and degree angle (0, 72, 144, 216) the photo was taken. Some example groups are: Fluo_SV_0, IR_SV_72, and Vis_SV_144. Each group has a range of PNG images named after timestamps.
Ground truth images were generated using Photoshop2020’s Action feature, which involved Quick Selection, Masking, Mode Conversion, Thresholding, and Inversion steps. Following the creation of a binary mask, two computer scientists assessed and refined each mask for quality by adding or removing pixels. This process resulted in a binary mask for each timestamp, modality, and perspective. Previous studies have also employed Photoshop, either fully or partially, for manual techniques in producing binary masks.
 Homepage
 Research Paper
Summary #
CosegPP: Cosegmentation for Plant Phenotyping is a dataset for semantic segmentation and instance segmentation tasks. It is used in the agricultural industry, and in the agricultural research.
The dataset consists of 496 images with 496 labeled objects belonging to 4 different classes including sunflower-C-1, sunflower-D-1, buckwheat-C-1, and other: buckwheat-D-1.
Images in the CosegPP dataset have pixel-level instance segmentation annotations. Due to the nature of the instance segmentation task, it can be automatically transformed into an object detection (bounding boxes for every object) task. All images are labeled (i.e. with annotations). There are 4 splits in the dataset: sunflower-C-1 (164 images), sunflower-D-1 (164 images), buckwheat-C-1 (84 images), and buckwheat-D-1 (84 images). For the sake of improving the experience when working with this dataset, we have decided to group the images by date. This way, you can work simultaneously with every image of a plant in every modality and angle. This grouping is only visible in advanced labeling toolbox… The dataset was released in 2021 by the University of Nebraska-Lincoln.
Explore #
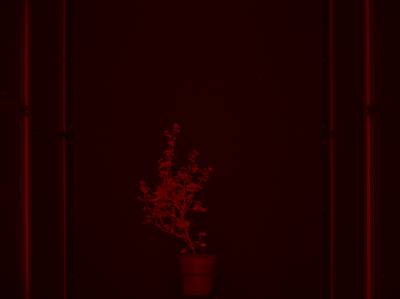
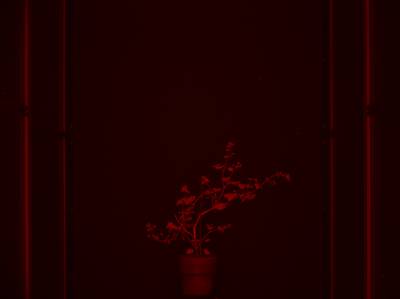
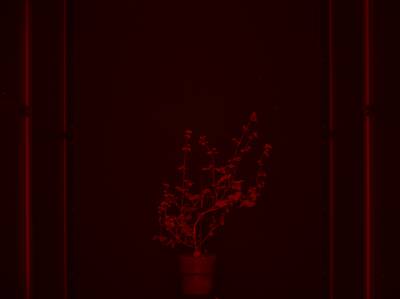
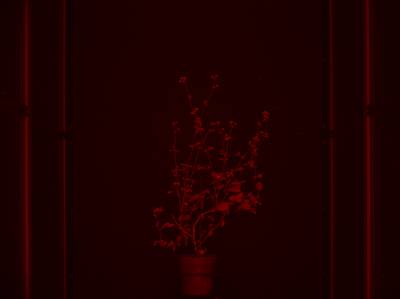
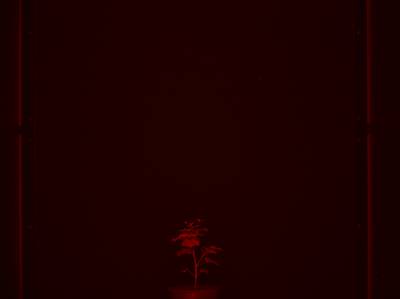
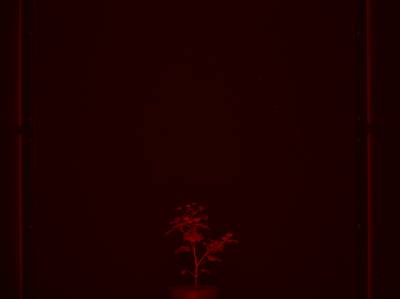
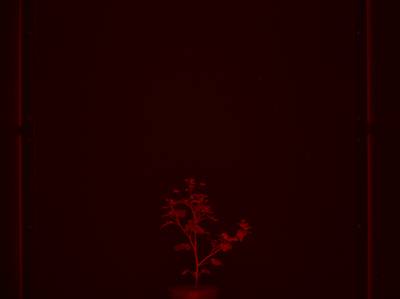
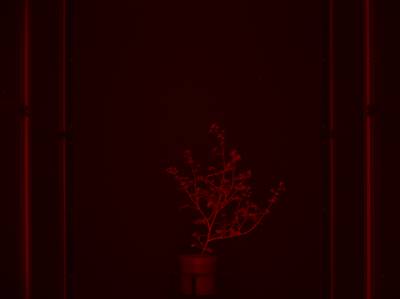
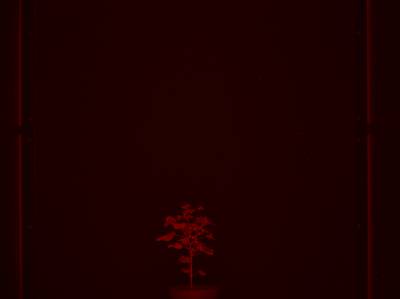
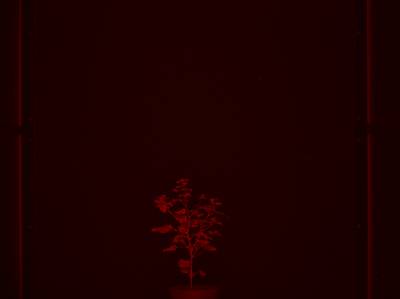
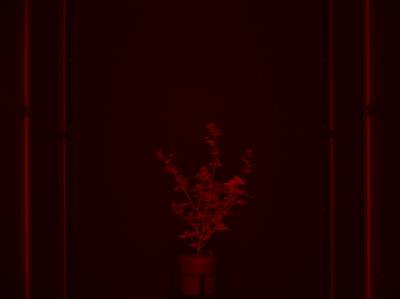
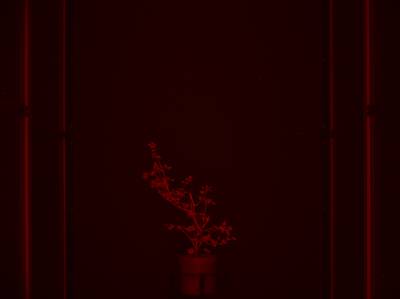
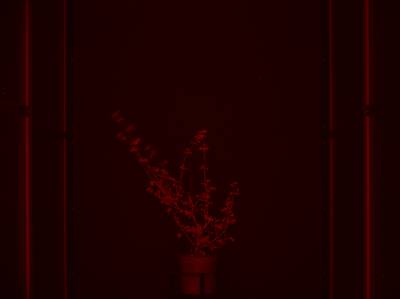
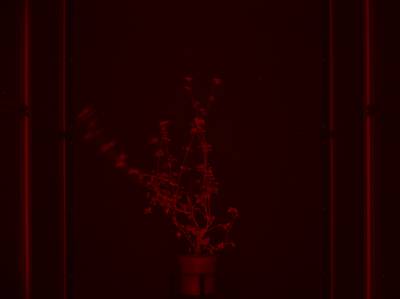
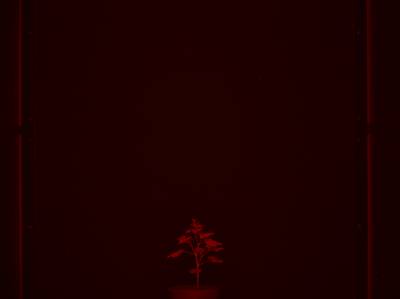
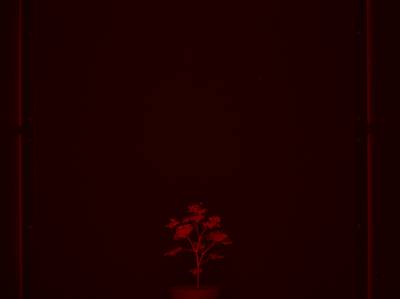
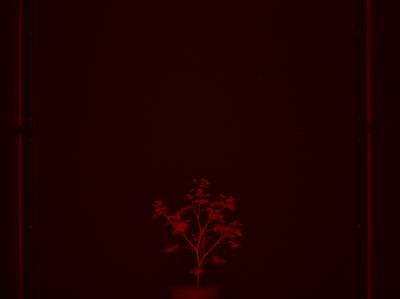
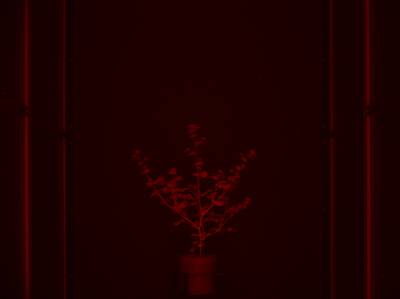
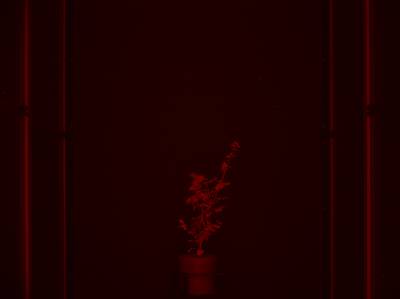
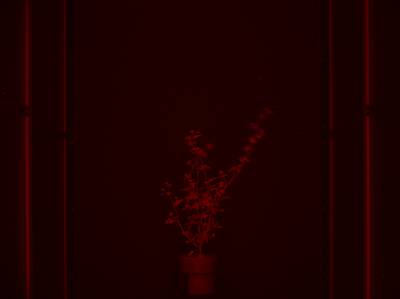
CosegPP dataset has 496 images. Click on one of the examples below or open "Explore" tool anytime you need to view dataset images with annotations. This tool has extended visualization capabilities like zoom, translation, objects table, custom filters and more. Hover the mouse over the images to hide or show annotations.


Class balance #
There are 4 annotation classes in the dataset. Find the general statistics and balances for every class in the table below. Click any row to preview images that have labels of the selected class. Sort by column to find the most rare or prevalent classes.

Class ㅤ | Images ㅤ | Objects ㅤ | Count on image average | Area on image average |
|---|---|---|---|---|
sunflower-D-1➔ mask | 164 | 164 | 1 | 1.59% |
sunflower-C-1➔ mask | 164 | 164 | 1 | 4.41% |
buckwheat-D-1➔ mask | 84 | 84 | 1 | 2.76% |
buckwheat-C-1➔ mask | 84 | 84 | 1 | 1.71% |
Co-occurrence matrix #
Co-occurrence matrix is an extremely valuable tool that shows you the images for every pair of classes: how many images have objects of both classes at the same time. If you click any cell, you will see those images. We added the tooltip with an explanation for every cell for your convenience, just hover the mouse over a cell to preview the description.
Images #
Explore every single image in the dataset with respect to the number of annotations of each class it has. Click a row to preview selected image. Sort by any column to find anomalies and edge cases. Use horizontal scroll if the table has many columns for a large number of classes in the dataset.
Object distribution #
Interactive heatmap chart for every class with object distribution shows how many images are in the dataset with a certain number of objects of a specific class. Users can click cell and see the list of all corresponding images.
Class sizes #
The table below gives various size properties of objects for every class. Click a row to see the image with annotations of the selected class. Sort columns to find classes with the smallest or largest objects or understand the size differences between classes.
Class | Object count | Avg area | Max area | Min area | Min height | Min height | Max height | Max height | Avg height | Avg height | Min width | Min width | Max width | Max width |
|---|---|---|---|---|---|---|---|---|---|---|---|---|---|---|
sunflower-D-1 mask | 164 | 1.59% | 4.49% | 0.19% | 30px | 4.69% | 765px | 26.72% | 242px | 17.07% | 66px | 9.93% | 586px | 38.96% |
sunflower-C-1 mask | 164 | 4.41% | 12.52% | 0.6% | 56px | 8.75% | 1603px | 100% | 488px | 35.45% | 113px | 15.97% | 802px | 77.08% |
buckwheat-D-1 mask | 84 | 2.76% | 8.84% | 0.63% | 88px | 13.75% | 1211px | 65.51% | 522px | 41.69% | 66px | 12.66% | 787px | 55% |
buckwheat-C-1 mask | 84 | 1.71% | 5.42% | 0.39% | 102px | 15.94% | 1136px | 62.66% | 426px | 35.03% | 60px | 11.37% | 973px | 67.5% |
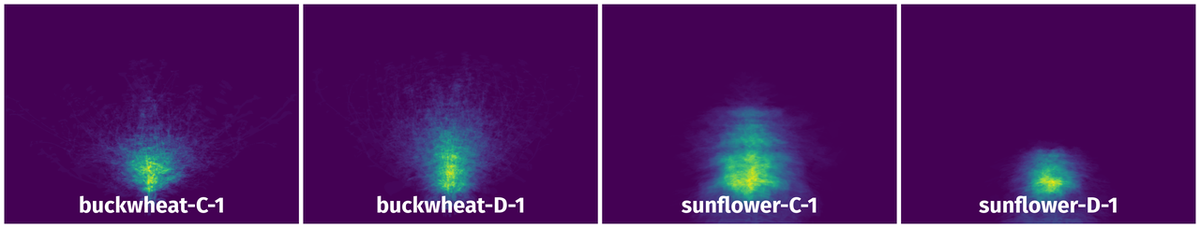
Spatial Heatmap #
The heatmaps below give the spatial distributions of all objects for every class. These visualizations provide insights into the most probable and rare object locations on the image. It helps analyze objects' placements in a dataset.
Objects #
Table contains all 496 objects. Click a row to preview an image with annotations, and use search or pagination to navigate. Sort columns to find outliers in the dataset.
Object ID ㅤ | Class ㅤ | Image name click row to open | Image size height x width | Height ㅤ | Height ㅤ | Width ㅤ | Width ㅤ | Area ㅤ |
|---|---|---|---|---|---|---|---|---|
1➔ | Buckwheat-C-1 Unknown | 2019-07-07_17-23-13.596_276100.png_Fluo_SV_0_Buckwheat-C-1.png | 1038 x 1390 | 382px | 36.8% | 263px | 18.92% | 1.48% |
2➔ | Buckwheat-C-1 Unknown | 2019-07-17_13-28-23.582_680900.png_IR_SV_144_Buckwheat-C-1.png | 640 x 480 | 224px | 35% | 308px | 64.17% | 1.64% |
3➔ | Buckwheat-C-1 Unknown | 2019-07-17_13-28-23.582_680900.png_Fluo_SV_216_Buckwheat-C-1.png | 1038 x 1390 | 410px | 39.5% | 330px | 23.74% | 1.58% |
4➔ | Buckwheat-C-1 Unknown | 2019-07-21_13-27-55.188_913300.png_Fluo_SV_72_Buckwheat-C-1.png | 1038 x 1390 | 523px | 50.39% | 399px | 28.71% | 1.17% |
5➔ | Buckwheat-C-1 Unknown | 2019-07-14_09-27-08.302_514000.png_Vis_SV_72_Buckwheat-C-1.png | 3288 x 2192 | 772px | 23.48% | 747px | 34.08% | 1.18% |
6➔ | Buckwheat-C-1 Unknown | 2019-07-07_17-23-13.596_276100.png_Fluo_SV_72_Buckwheat-C-1.png | 1038 x 1390 | 384px | 36.99% | 317px | 22.81% | 1.62% |
7➔ | Buckwheat-C-1 Unknown | 2019-07-14_09-27-08.302_514000.png_Fluo_SV_216_Buckwheat-C-1.png | 1038 x 1390 | 484px | 46.63% | 338px | 24.32% | 2.35% |
8➔ | Buckwheat-C-1 Unknown | 2019-07-14_09-27-08.302_514000.png_Vis_SV_144_Buckwheat-C-1.png | 3288 x 2192 | 791px | 24.06% | 741px | 33.8% | 0.94% |
9➔ | Buckwheat-C-1 Unknown | 2019-07-05_17-24-27.566_208900.png_IR_SV_72_Buckwheat-C-1.png | 640 x 480 | 132px | 20.62% | 104px | 21.67% | 1.13% |
10➔ | Buckwheat-C-1 Unknown | 2019-07-03_17-37-18.072_141700.png_Vis_SV_0_Buckwheat-C-1.png | 1028 x 1227 | 238px | 23.15% | 175px | 14.26% | 0.88% |
License #
Citation #
If you make use of the CosegPP data, please cite the following reference:
@dataset{quinones_rubi_2021_5117176,
  author       = {Quiñones, Rubi and
                  Munoz Arriola, Francisco and
                  Das Choudhury, Sruti and
                  Samal. Ashok},
  title        = {{Cosegmentation for Plant Phenotyping (CosegPP)
                   Data Repository Collected Via a High-Throughput
                   Imaging System}},
  month        = aug,
  year         = 2021,
  note         = {{This material is based upon work supported by the
                   National Science Foundation under Grant No.
                   DGE-1735362. Any opinions, findings, and
                   conclusions or recommendations expressed in this
                   material are those of the author(s) and do not
                   necessarily reflect the views of the National
                   Science Foundation. Also, the authors acknowledge
                   the support provided by the Agriculture and Food
                   Research Initiative Grant number NEB-21-176 and
                   NEB-21-166 from the USDA National Institute of
                   Food and Agriculture, Plant Health and Production
                   and Plant Products: Plant Breeding for
                   Agricultural Production.}},
  publisher    = {Zenodo},
  doi          = {10.5281/zenodo.5117176},
  url          = {https://doi.org/10.5281/zenodo.5117176}
}
If you are happy with Dataset Ninja and use provided visualizations and tools in your work, please cite us:
@misc{ visualization-tools-for-cosegpp-dataset,
  title = { Visualization Tools for CosegPP Dataset },
  type = { Computer Vision Tools },
  author = { Dataset Ninja },
  howpublished = { \url{ https://datasetninja.com/cosegpp } },
  url = { https://datasetninja.com/cosegpp },
  journal = { Dataset Ninja },
  publisher = { Dataset Ninja },
  year = { 2026 },
  month = { jul },
  note = { visited on 2026-07-26 },
}
Download #
Dataset CosegPP can be downloaded in Supervisely format:
As an alternative, it can be downloaded with dataset-tools package:
pip install --upgrade dataset-tools
… using following python code:
import dataset_tools as dtools

dtools.download(dataset='CosegPP', dst_dir='~/dataset-ninja/')
Make sure not to overlook the python code example available on the Supervisely Developer Portal. It will give you a clear idea of how to effortlessly work with the downloaded dataset.
The data in original format can be downloaded here:
Disclaimer #
Our gal from the legal dep told us we need to post this:
Dataset Ninja provides visualizations and statistics for some datasets that can be found online and can be downloaded by general audience. Dataset Ninja is not a dataset hosting platform and can only be used for informational purposes. The platform does not claim any rights for the original content, including images, videos, annotations and descriptions. Joint publishing is prohibited.
You take full responsibility when you use datasets presented at Dataset Ninja, as well as other information, including visualizations and statistics we provide. You are in charge of compliance with any dataset license and all other permissions. You are required to navigate datasets homepage and make sure that you can use it. In case of any questions, get in touch with us at hello@datasetninja.com.