Introduction #
The authors of the CottonWeedDet3: A 3-Class Weed Detection Dataset for Cotton Cropping Systems delve into the application of alternative non-chemical or chemical-reduced methods for weed control, emphasizing their significance, particularly in addressing herbicide-resistant weeds. With a focus on machine vision technology, specifically weed detection and localization, the authors aim to facilitate site-and species-specific treatments for individual weed plants. However, the complexities of unstructured field circumstances and the biological variability of weeds pose challenges for achieving robust and accurate weed detection.
Weeds pose a substantial threat to crop yield, competing with crops for vital resources such as water, nutrients, light, and space. This competition impedes crop growth and development, resulting in estimated global crop yield losses of 43%. Current strategies, primarily herbicide application, while widely adopted, face challenges such as increased herbicide-resistant weeds, negative environmental impacts, and rising management costs.
Detecting weeds robustly and accurately in natural field conditions remains a challenging task due to various factors. These factors include intra- and inter-species variability in weed appearance characteristics, the similarity of weeds with crops, and variations in field light conditions and soil backgrounds.
Image Acquisition
Weed detection pipeline.
RGB images of weeds in cotton fields were acquired using either a smartphone camera or a handheld digital camera. The average dimension of the captured images was 4442 × 4335 pixels, saved in .jpeg format. To ensure data diversity, images were captured from different view angles under natural field light conditions across the U.S. cotton belt states, primarily in North Carolina and Mississippi, during the growth seasons of 2020 and 2021. A total of 5187 images of fifteen common weed species were collected during this period.
Data Pre-processing
Acquired images were meticulously annotated for weed plants using the SuperAnnotate platform, allowing the definition of weed instances through bounding boxes. The annotations were exported in the COCO dataset format and converted to the VIA annotation format, a popular and free annotation tool. The resultant annotation files include information about the source image file name, bounding box coordinates, and associated weed class.
Efforts were made to ensure data quality through the removal of low-quality annotations. Annotations that were too small, out-of-focus, or mislabeled were discarded. The maximum number of bounding boxes in a single image was limited to 10 to maintain data standardization. The cleaned dataset includes 848 images and 1532 bounding boxes.
There is no predefined splitting: the dataset was randomly divided into train, validation, and test sets in a ratio of 60%: 20%: 20%, ensuring stratified partitioning to maintain similar class proportions in each split.
In the study, a suite of 11 augmentations were used, including horizontal flip, random brightness contrast, random hue saturation value (HSV), random snow, random rain, fancy PCA, random blur, random Gaussian noise, random RGB shift, random shadow, and random rotate90 (rotation by 90 degrees).
Summary #
CottonWeedDet3: A 3-Class Weed Detection Dataset for Cotton Cropping Systems is a dataset for an object detection task. It is used in the agricultural industry.
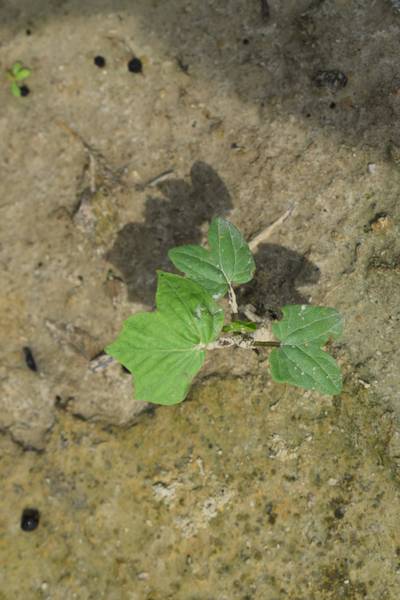
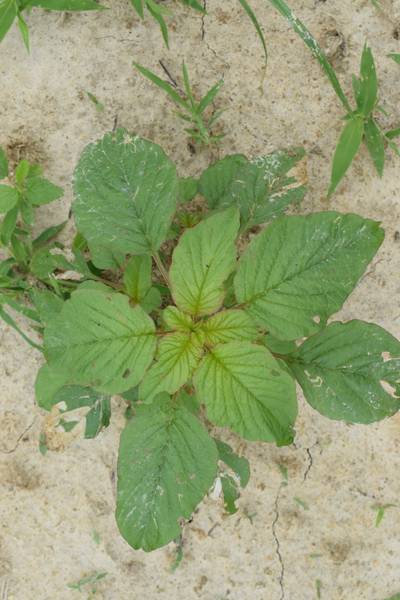
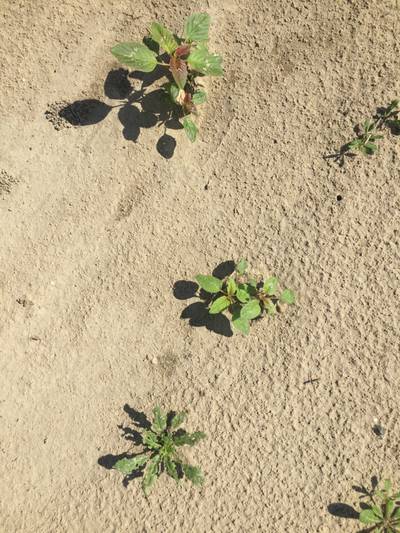
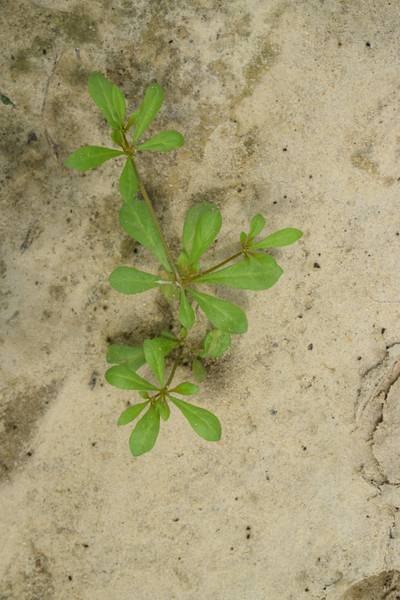
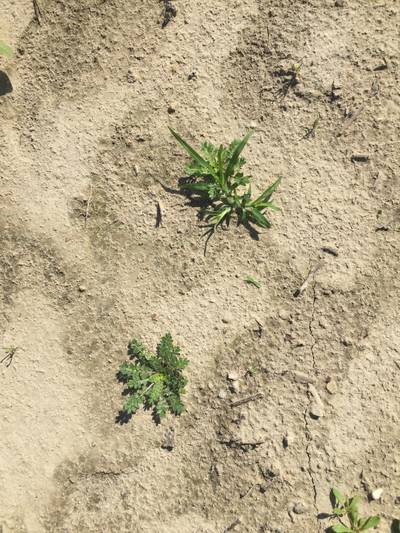
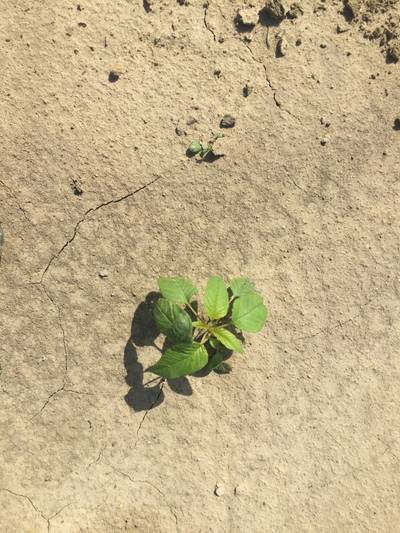
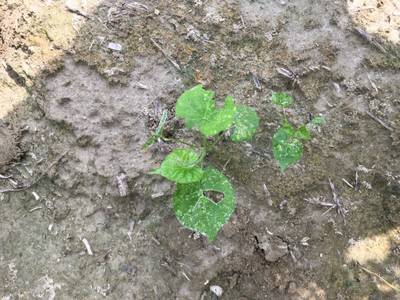
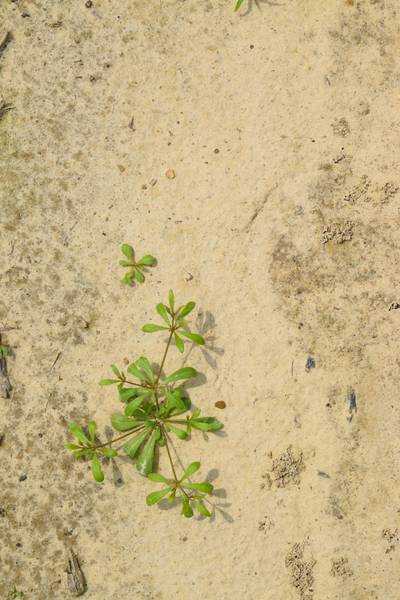
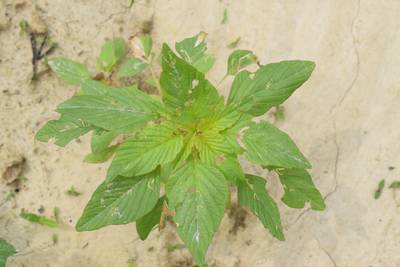
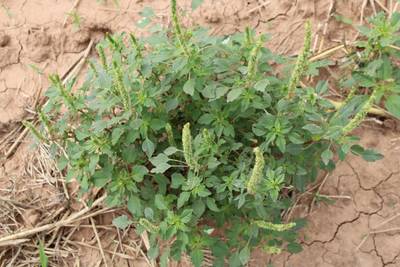
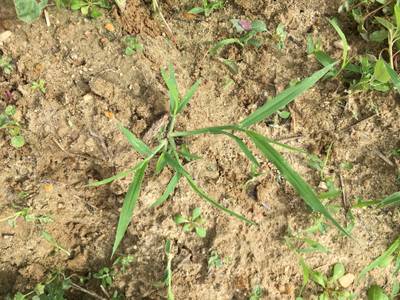
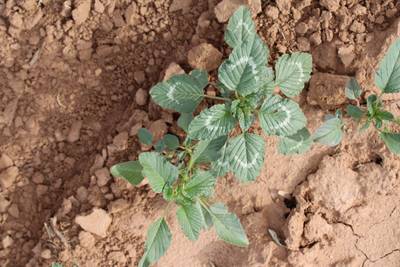
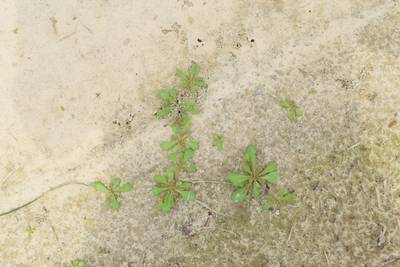
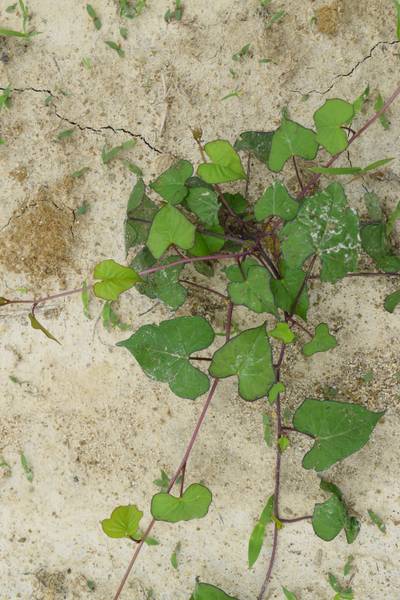
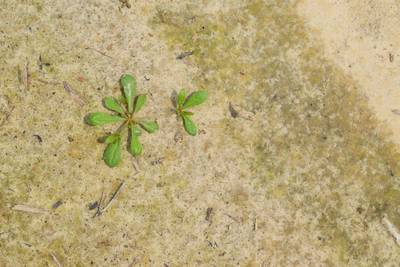
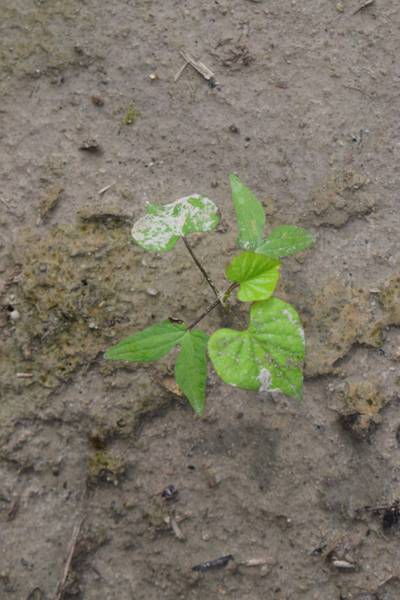
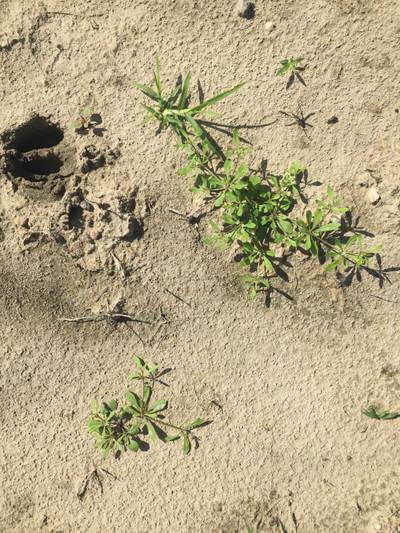
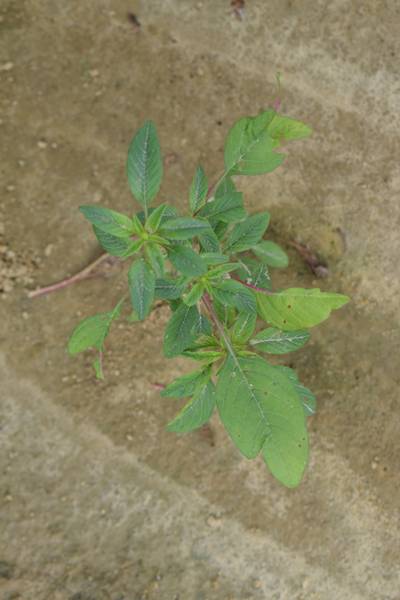
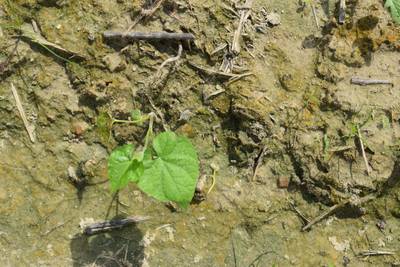
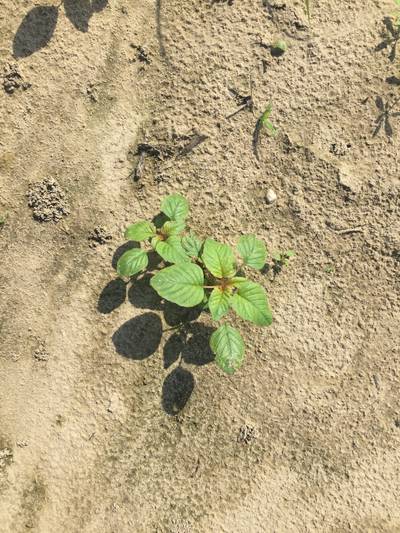
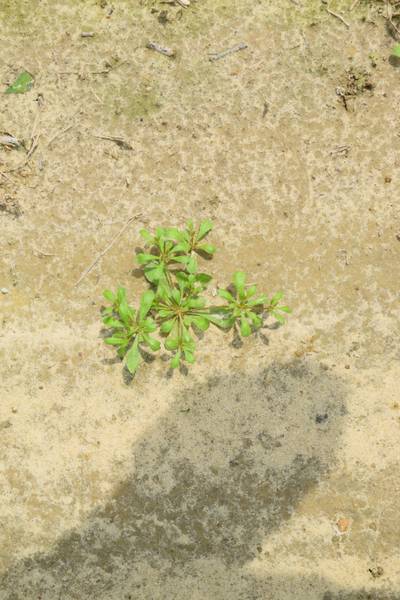
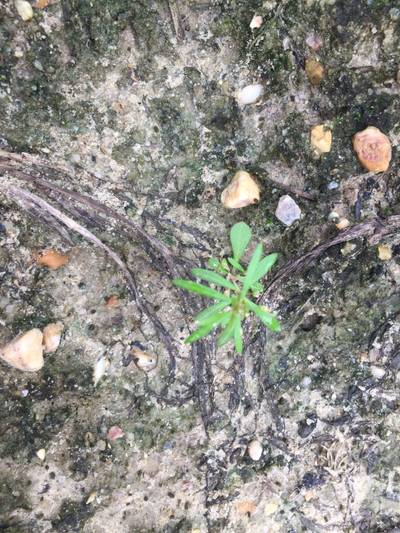
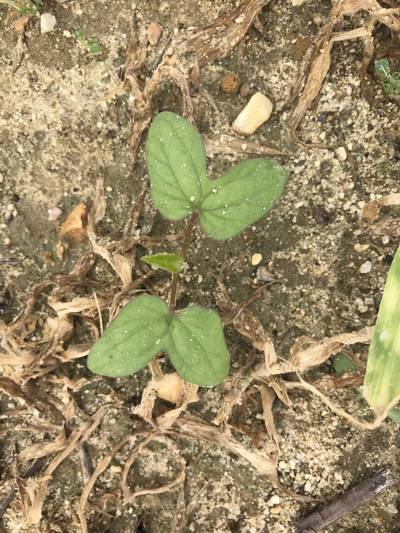
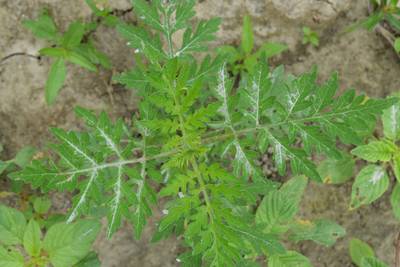
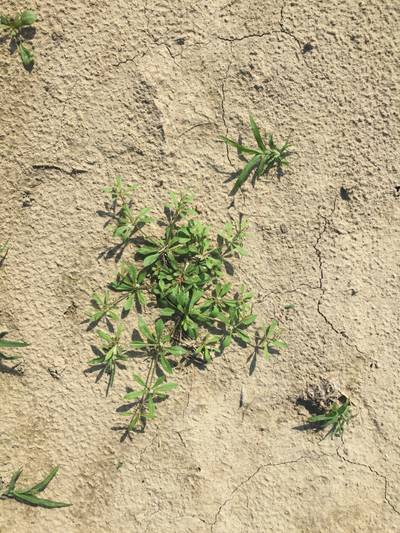
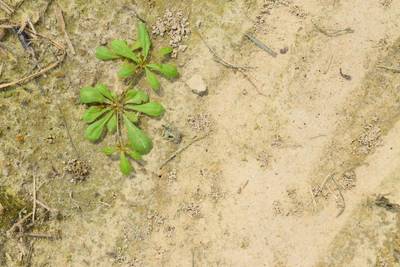
The dataset consists of 848 images with 1532 labeled objects belonging to 3 different classes including morningglory, carpetweed, and palmer amaranth.
Images in the CottonWeedDet3 dataset have bounding box annotations. All images are labeled (i.e. with annotations). There are no pre-defined train/val/test splits in the dataset. The dataset was released in 2022 by the Mississippi State University, USA.

Explore #
CottonWeedDet3 dataset has 848 images. Click on one of the examples below or open "Explore" tool anytime you need to view dataset images with annotations. This tool has extended visualization capabilities like zoom, translation, objects table, custom filters and more. Hover the mouse over the images to hide or show annotations.





























Class balance #
There are 3 annotation classes in the dataset. Find the general statistics and balances for every class in the table below. Click any row to preview images that have labels of the selected class. Sort by column to find the most rare or prevalent classes.
Class ㅤ | Images ㅤ | Objects ㅤ | Count on image average | Area on image average |
|---|---|---|---|---|
morningglory➔ rectangle | 376 | 486 | 1.29 | 34.57% |
carpetweed➔ rectangle | 284 | 602 | 2.12 | 20.62% |
palmer amaranth➔ rectangle | 263 | 444 | 1.69 | 39.5% |
Co-occurrence matrix #
Co-occurrence matrix is an extremely valuable tool that shows you the images for every pair of classes: how many images have objects of both classes at the same time. If you click any cell, you will see those images. We added the tooltip with an explanation for every cell for your convenience, just hover the mouse over a cell to preview the description.
Images #
Explore every single image in the dataset with respect to the number of annotations of each class it has. Click a row to preview selected image. Sort by any column to find anomalies and edge cases. Use horizontal scroll if the table has many columns for a large number of classes in the dataset.
Object distribution #
Interactive heatmap chart for every class with object distribution shows how many images are in the dataset with a certain number of objects of a specific class. Users can click cell and see the list of all corresponding images.
Class sizes #
The table below gives various size properties of objects for every class. Click a row to see the image with annotations of the selected class. Sort columns to find classes with the smallest or largest objects or understand the size differences between classes.
Class | Object count | Avg area | Max area | Min area | Min height | Min height | Max height | Max height | Avg height | Avg height | Min width | Min width | Max width | Max width |
|---|---|---|---|---|---|---|---|---|---|---|---|---|---|---|
carpetweed rectangle | 602 | 9.92% | 79.22% | 0.02% | 68px | 1.35% | 5046px | 98.77% | 1042px | 24.55% | 54px | 1.35% | 4814px | 100% |
morningglory rectangle | 486 | 28.69% | 98.05% | 0.17% | 116px | 2.4% | 6000px | 100% | 2233px | 48.32% | 78px | 3.92% | 6000px | 100% |
palmer amaranth rectangle | 444 | 24.16% | 100% | 0.06% | 77px | 1.88% | 6000px | 100% | 1783px | 42.14% | 93px | 2.88% | 5775px | 100% |
Spatial Heatmap #
The heatmaps below give the spatial distributions of all objects for every class. These visualizations provide insights into the most probable and rare object locations on the image. It helps analyze objects' placements in a dataset.

Objects #
Table contains all 1532 objects. Click a row to preview an image with annotations, and use search or pagination to navigate. Sort columns to find outliers in the dataset.
Object ID ㅤ | Class ㅤ | Image name click row to open | Image size height x width | Height ㅤ | Height ㅤ | Width ㅤ | Width ㅤ | Area ㅤ |
|---|---|---|---|---|---|---|---|---|
1➔ | morningglory rectangle | 20200819_NIKOND3300_YL_284.jpg | 4000 x 6000 | 1879px | 46.98% | 1665px | 27.75% | 13.04% |
2➔ | carpetweed rectangle | 20200819_NIKOND3300_YL_252.jpg | 6000 x 4000 | 4987px | 83.12% | 3731px | 93.28% | 77.53% |
3➔ | palmer amaranth rectangle | 20200819_NIKOND3300_YL_734.jpg | 4000 x 6000 | 1173px | 29.32% | 1395px | 23.25% | 6.82% |
4➔ | palmer amaranth rectangle | 20200819_NIKOND3300_YL_734.jpg | 4000 x 6000 | 2308px | 57.7% | 2249px | 37.48% | 21.63% |
5➔ | morningglory rectangle | 20200819_NIKOND3300_YL_30.jpg | 6000 x 4000 | 5556px | 92.6% | 3395px | 84.88% | 78.59% |
6➔ | morningglory rectangle | 20200819_NIKOND3300_YL_30.jpg | 6000 x 4000 | 3972px | 66.2% | 2373px | 59.33% | 39.27% |
7➔ | morningglory rectangle | 20200624_iPhone6_SY_54.jpg | 3264 x 2448 | 978px | 29.96% | 1149px | 46.94% | 14.06% |
8➔ | morningglory rectangle | 20200624_iPhone6_SY_54.jpg | 3264 x 2448 | 732px | 22.43% | 890px | 36.36% | 8.15% |
9➔ | carpetweed rectangle | 20200819_NIKOND3300_YL_201.jpg | 4000 x 6000 | 746px | 18.65% | 792px | 13.2% | 2.46% |
10➔ | carpetweed rectangle | 20200819_NIKOND3300_YL_201.jpg | 4000 x 6000 | 1687px | 42.17% | 1398px | 23.3% | 9.83% |
License #
The CottonWeedDet3: A 3-Class Weed Detection Dataset for Cotton Cropping Systems is publicly available.
Citation #
If you make use of the CottonWeedDet3 data, please cite the following reference:
@dataset{CottonWeedDet3,
  author={Abdur Rahman and Yuzhen Lu and Haifeng Wang},
  title={CottonWeedDet3: A 3-Class Weed Detection Dataset for Cotton Cropping Systems},
  year={2022},
  url={https://www.kaggle.com/datasets/yuzhenlu/cottonweeddet3/}
}
If you are happy with Dataset Ninja and use provided visualizations and tools in your work, please cite us:
@misc{ visualization-tools-for-cotton-weed-det3-dataset,
  title = { Visualization Tools for CottonWeedDet3 Dataset },
  type = { Computer Vision Tools },
  author = { Dataset Ninja },
  howpublished = { \url{ https://datasetninja.com/cotton-weed-det3 } },
  url = { https://datasetninja.com/cotton-weed-det3 },
  journal = { Dataset Ninja },
  publisher = { Dataset Ninja },
  year = { 2026 },
  month = { jan },
  note = { visited on 2026-01-09 },
}
Download #
Dataset CottonWeedDet3 can be downloaded in Supervisely format:
As an alternative, it can be downloaded with dataset-tools package:
pip install --upgrade dataset-tools
… using following python code:
import dataset_tools as dtools

dtools.download(dataset='CottonWeedDet3', dst_dir='~/dataset-ninja/')
Make sure not to overlook the python code example available on the Supervisely Developer Portal. It will give you a clear idea of how to effortlessly work with the downloaded dataset.
The data in original format can be downloaded here.
Disclaimer #
Our gal from the legal dep told us we need to post this:
Dataset Ninja provides visualizations and statistics for some datasets that can be found online and can be downloaded by general audience. Dataset Ninja is not a dataset hosting platform and can only be used for informational purposes. The platform does not claim any rights for the original content, including images, videos, annotations and descriptions. Joint publishing is prohibited.
You take full responsibility when you use datasets presented at Dataset Ninja, as well as other information, including visualizations and statistics we provide. You are in charge of compliance with any dataset license and all other permissions. You are required to navigate datasets homepage and make sure that you can use it. In case of any questions, get in touch with us at hello@datasetninja.com.


