Introduction #
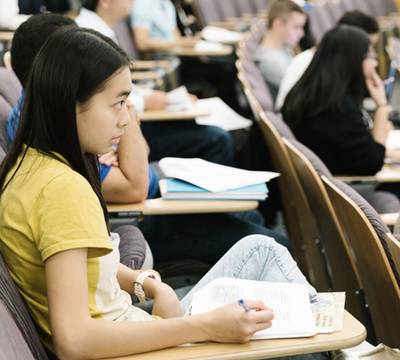
The authors of the CrowdHuman dataset addressed the ongoing challenge of human detection in highly crowded environments, particularly dealing with occlusions. They recognized the underrepresentation of crowd scenarios in current human detection benchmarks. To address this gap, they introduced the present dataset, designed to enhance the evaluation of human detectors in crowd scenarios. This dataset is characterized by its size, rich annotations, and high diversity. It contains many human instances, totalling 470,000 from train and validation subsets. Notably, each human instance is annotated with various bounding boxes including head, visible-region, and full-body bounding boxes.
The importance of accurately detecting humans in images has garnered increased attention due to its relevance in various applications such as autonomous vehicles, surveillance, robotics, and human-machine interactions. An accurate human detection system plays a crucial role in these contexts.
The dataset collection process aimed for diversity to simulate real-world scenarios. The authors crawled images from Google using approximately 150 different keywords, covering a broad range of cities, activities, and viewpoints. The dataset contains around 25,000 images, carefully curated to ensure diversity and relevance to crowd scenes.
For image annotation, the authors adopted a comprehensive approach. They annotated individual persons by providing full bounding boxes that encompass the entire individual, accounting for occlusions and various poses. Head and visible-region bounding boxes were also annotated. Annotations were double-checked by different annotators to ensure accuracy.
CrowdHuman dataset stands out in terms of its size, density, diversity, and representation of occlusions. The dataset contains a significant number of persons per image, averaging about 22.6 individuals. This density surpasses existing datasets, making it a valuable resource for assessing crowd scenarios. Additionally, the authors considered various levels of occlusion, dividing the dataset into subsets with different occlusion levels for detailed analysis.
The authors highlighted the uniqueness of the CrowdHuman dataset compared to existing ones. They emphasized its contribution to addressing the occlusion challenge and better evaluating human detectors in crowded settings.
Summary #
CrowdHuman: A Benchmark for Detecting Human in a Crowd is a dataset for an object detection task. It is used in the surveillance domain, and in the robotics and automotive industries.
The dataset consists of 24388 images with 1344883 labeled objects belonging to 3 different classes including head, full-body, and visible.
Images in the CrowdHuman dataset have bounding box annotations. There are 5018 (21% of the total) unlabeled images (i.e. without annotations). There are 3 splits in the dataset: train (15000 images), test (5018 images), and val (4370 images). The dataset was released in 2018 by the Megvii Technology, China.

Explore #
CrowdHuman dataset has 24388 images. Click on one of the examples below or open "Explore" tool anytime you need to view dataset images with annotations. This tool has extended visualization capabilities like zoom, translation, objects table, custom filters and more. Hover the mouse over the images to hide or show annotations.


Class balance #
There are 3 annotation classes in the dataset. Find the general statistics and balances for every class in the table below. Click any row to preview images that have labels of the selected class. Sort by column to find the most rare or prevalent classes.
Class ㅤ | Images ㅤ | Objects ㅤ | Count on image average | Area on image average |
|---|---|---|---|---|
head➔ rectangle | 19370 | 436754 | 22.55 | 5.11% |
full-body➔ rectangle | 19370 | 566493 | 29.25 | 45.15% |
visible➔ rectangle | 19334 | 341636 | 17.67 | 32.39% |
Co-occurrence matrix #
Co-occurrence matrix is an extremely valuable tool that shows you the images for every pair of classes: how many images have objects of both classes at the same time. If you click any cell, you will see those images. We added the tooltip with an explanation for every cell for your convenience, just hover the mouse over a cell to preview the description.
Images #
Explore every single image in the dataset with respect to the number of annotations of each class it has. Click a row to preview selected image. Sort by any column to find anomalies and edge cases. Use horizontal scroll if the table has many columns for a large number of classes in the dataset.
Class sizes #
The table below gives various size properties of objects for every class. Click a row to see the image with annotations of the selected class. Sort columns to find classes with the smallest or largest objects or understand the size differences between classes.
Class | Object count | Avg area | Max area | Min area | Min height | Min height | Max height | Max height | Avg height | Avg height | Min width | Min width | Max width | Max width |
|---|---|---|---|---|---|---|---|---|---|---|---|---|---|---|
full-body rectangle | 566493 | 2.84% | 100% | 0% | 2px | 0.11% | 4850px | 100% | 210px | 22.52% | 2px | 0.1% | 5182px | 100% |
head rectangle | 436754 | 0.24% | 76.01% | 0% | 1px | 0.04% | 2476px | 100% | 44px | 4.77% | 1px | 0.02% | 1473px | 76.01% |
visible rectangle | 341636 | 2.61% | 100% | 0% | 2px | 0.08% | 4825px | 100% | 197px | 21.05% | 2px | 0.12% | 4720px | 100% |
Spatial Heatmap #
The heatmaps below give the spatial distributions of all objects for every class. These visualizations provide insights into the most probable and rare object locations on the image. It helps analyze objects' placements in a dataset.

Objects #
Table contains all 103175 objects. Click a row to preview an image with annotations, and use search or pagination to navigate. Sort columns to find outliers in the dataset.
Object ID ㅤ | Class ㅤ | Image name click row to open | Image size height x width | Height ㅤ | Height ㅤ | Width ㅤ | Width ㅤ | Area ㅤ |
|---|---|---|---|---|---|---|---|---|
1➔ | full-body rectangle | 283081,1acda000956dc2b1.jpg | 630 x 1200 | 520px | 82.54% | 207px | 17.25% | 14.24% |
2➔ | visible rectangle | 283081,1acda000956dc2b1.jpg | 630 x 1200 | 520px | 82.54% | 207px | 17.25% | 14.24% |
3➔ | head rectangle | 283081,1acda000956dc2b1.jpg | 630 x 1200 | 92px | 14.6% | 75px | 6.25% | 0.91% |
4➔ | full-body rectangle | 283081,1acda000956dc2b1.jpg | 630 x 1200 | 471px | 74.76% | 154px | 12.83% | 9.59% |
5➔ | visible rectangle | 283081,1acda000956dc2b1.jpg | 630 x 1200 | 471px | 74.76% | 154px | 12.83% | 9.59% |
6➔ | head rectangle | 283081,1acda000956dc2b1.jpg | 630 x 1200 | 84px | 13.33% | 69px | 5.75% | 0.77% |
7➔ | full-body rectangle | 283081,1acda000956dc2b1.jpg | 630 x 1200 | 436px | 69.21% | 157px | 13.08% | 9.05% |
8➔ | visible rectangle | 283081,1acda000956dc2b1.jpg | 630 x 1200 | 436px | 69.21% | 157px | 13.08% | 9.05% |
9➔ | head rectangle | 283081,1acda000956dc2b1.jpg | 630 x 1200 | 70px | 11.11% | 58px | 4.83% | 0.54% |
10➔ | full-body rectangle | 283081,1acda000956dc2b1.jpg | 630 x 1200 | 438px | 69.52% | 156px | 13% | 9.04% |
License #
Terms of use: by downloading the image data you agree to the following terms:
- You will use the data only for non-commercial research and educational purposes.
- You will NOT distribute the above images.
- Megvii Technology makes no representations or warranties regarding the data, including but not limited to warranties of non-infringement or fitness for a particular purpose.
- You accept full responsibility for your use of the data and shall defend and indemnify Megvii Technology, including its employees, officers and agents, against any and all claims arising from your use of the data, including but not limited to your use of any copies of copyrighted images that you may create from the data.
Citation #
If you make use of the CrowdHuman data, please cite the following reference:
@article{shao2018crowdhuman,
  title={CrowdHuman: A Benchmark for Detecting Human in a Crowd},
  author={Shao, Shuai and Zhao, Zijian and Li, Boxun and Xiao, Tete and Yu, Gang and Zhang,   Xiangyu and Sun, Jian},
  journal={arXiv preprint arXiv:1805.00123},
  year={2018}
}
If you are happy with Dataset Ninja and use provided visualizations and tools in your work, please cite us:
@misc{ visualization-tools-for-crowdhuman-dataset,
  title = { Visualization Tools for CrowdHuman Dataset },
  type = { Computer Vision Tools },
  author = { Dataset Ninja },
  howpublished = { \url{ https://datasetninja.com/crowdhuman } },
  url = { https://datasetninja.com/crowdhuman },
  journal = { Dataset Ninja },
  publisher = { Dataset Ninja },
  year = { 2026 },
  month = { jan },
  note = { visited on 2026-01-07 },
}
Download #
Please visit dataset homepage to download the data.
Disclaimer #
Our gal from the legal dep told us we need to post this:
Dataset Ninja provides visualizations and statistics for some datasets that can be found online and can be downloaded by general audience. Dataset Ninja is not a dataset hosting platform and can only be used for informational purposes. The platform does not claim any rights for the original content, including images, videos, annotations and descriptions. Joint publishing is prohibited.
You take full responsibility when you use datasets presented at Dataset Ninja, as well as other information, including visualizations and statistics we provide. You are in charge of compliance with any dataset license and all other permissions. You are required to navigate datasets homepage and make sure that you can use it. In case of any questions, get in touch with us at hello@datasetninja.com.


