

Introduction #
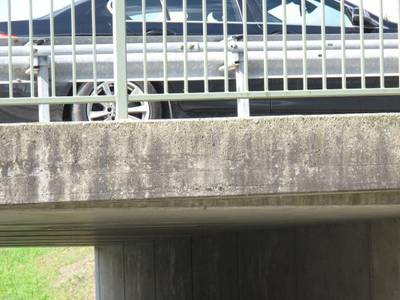
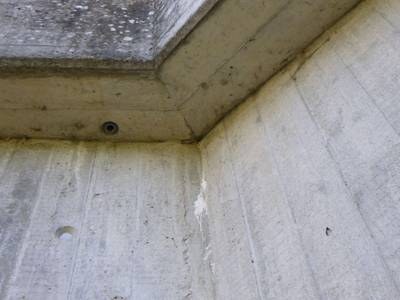
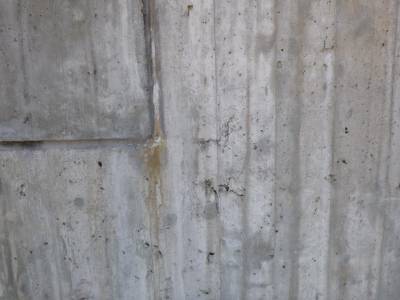
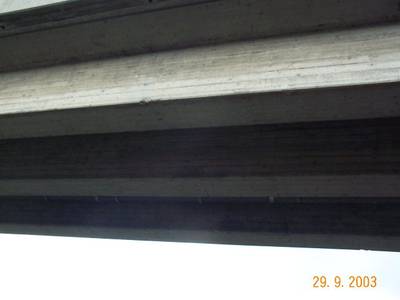
The dacl10k: Benchmark for Semantic Bridge Damage Segmentation is the first large-scale dataset for semantic bridge damage segmentation. It includes images collected during concrete bridge inspections acquired from databases at authorities and engineering offices, thus, it represents real-world scenarios. Concrete bridges represent the most common building type, besides steel, steel composite, and wooden bridges.
Civil engineering structures such as power plants, sewers, and bridges form essential components of the public infrastructure. It is mandatory to keep these structures in a safe and operational state. In order to ensure this, the authors of the dataset frequently inspected where the current recognition and documentation of defects and building components is mostly carried out manually.
A failure of individual structures results in enormous costs. For example, the economic costs caused by the closure of a bridge due to congestion is many times the cost of the bridge itself and its maintenance. The authors primary objective was to develop a dataset that enables the training of models which later support the inspector during damage recognition and documentation to a maximum.
Dataset acquisition
Approximately one half of the images originate from databases of engineering offices, while the other half was provided by local authorities from Germany. The images were taken between 2000 and 2020. Both data sources supplied highly heterogeneous images regarding camera type, pose, lighting condition, and resolution.
Dataset description
The authors recognize 13 frequently occurring defects on reinforced concrete bridges (e.g., crack, spalling, efflorescence) and 6 important building parts (e.g., exposed reinforcement bar exposed rebar, bearing, expansion joint, protective equipment). All these classes play an important role for determining the building’s structural integrity, traffic safety and durability. Dacl10k includes 9,920 images from more than 100 different bridges, specifically designed for practical use, as it comprises all visually unique damage types defined by bridge inspection standards. Every object class in dataset can be labeled with:
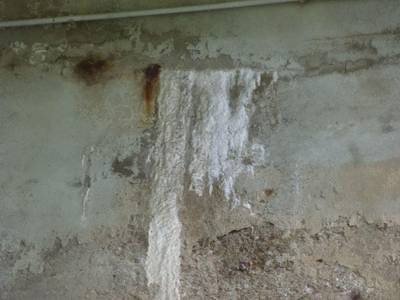
- concrete defect tag: cavity,efflorescence,alligator crack,spalling,restformwork,exposed rebars, hollowareas, crack, rockpocket classes,
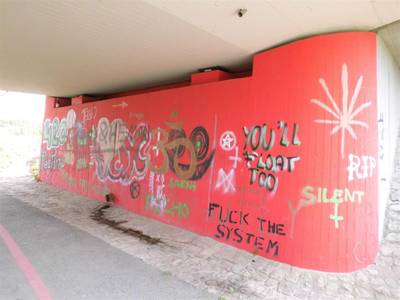
- general defect tag: rust, wetspot, weathering, graffiti classes.
- object part tag: bearing, expansion joint, drainage, protective equipment, joint tape, washouts/concrete corrosion classes.
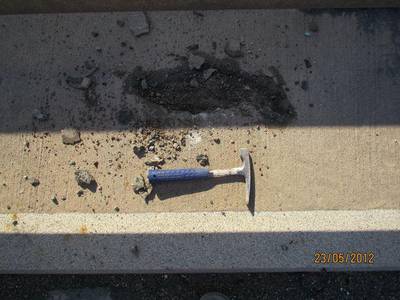
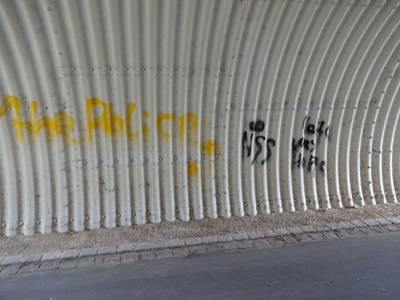
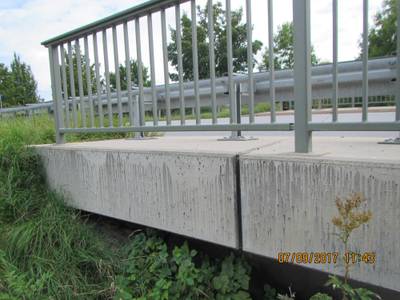
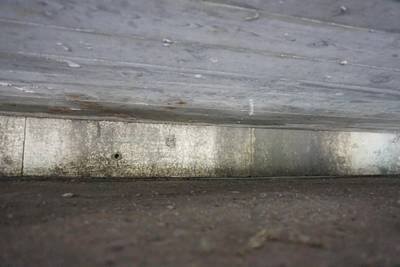
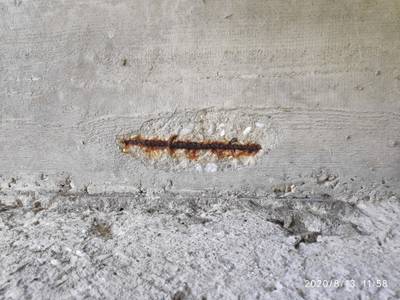
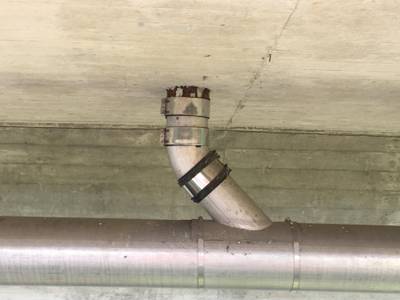
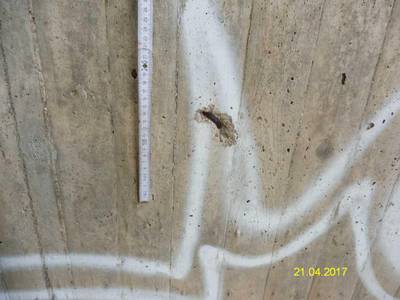
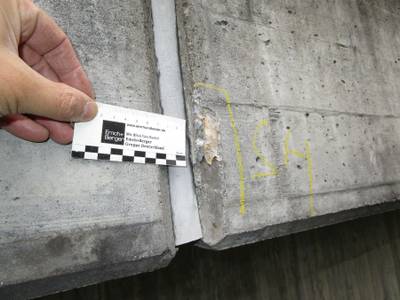
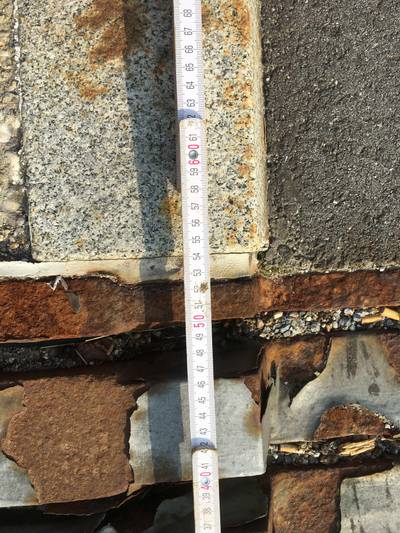
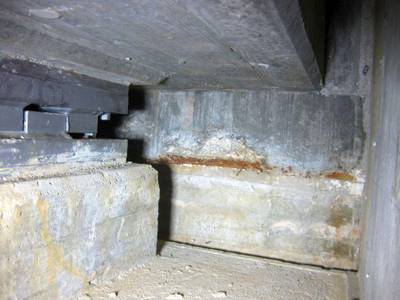
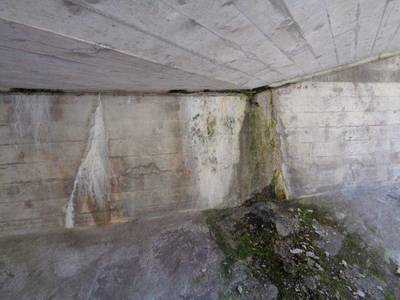
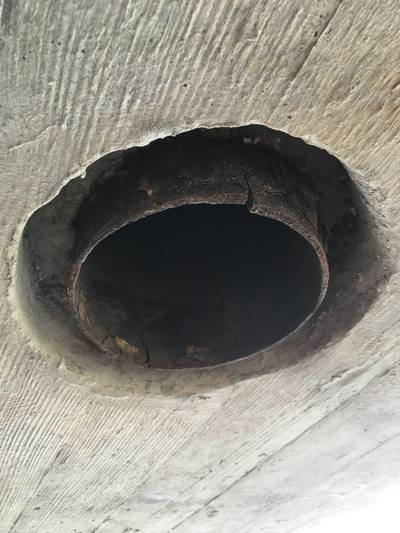
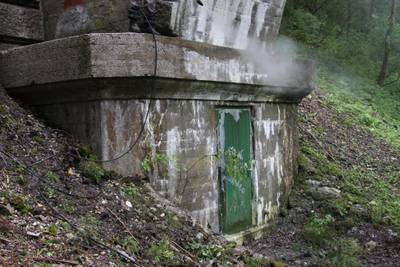
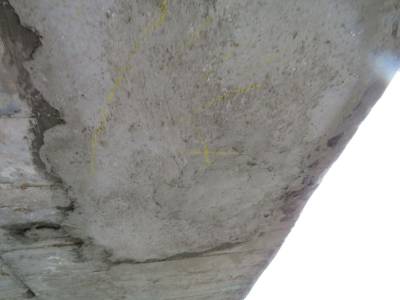
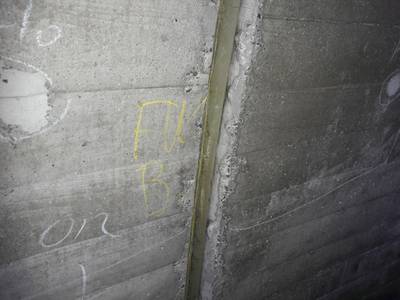
Example annotations from dacl10k. Top row: original image. Middle row: polygonal annotations. Bottom row: stacked masks. The following classes are abbreviated: Alligator Crack (ACrack), Washouts/Concrete corrosion (WConccor), Expansion Joint (EJoint), Protective Equipment (PEquipment) and Joint Tape (JTape). From left to right, the images display the individual classes: 1. Weathering, Spalling, Exposed Rebars, Rust; 2. Weathering, Crack; 3. Alligator Crack, Restformwork, Efflorescence; 4. Weathering, Crack, Spalling, Rockpocket; 5. Crack, Rust, Expansion Joint, Spalling; 6. Weathering, Rockpocket, Spalling, Efflorescence, Crack, Rust, Restformwork, Joint Tape; 7. Weathering, Protective Eq.
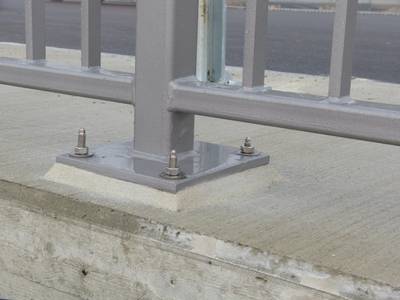
The 19 classes considered within dacl10k are separated into three groups: concrete defects, general defects and objects. The concrete defects appear only on building parts made of (reinforced) concrete, while general defects may be present on all materials (e.g., concrete or steel). The only defect within dacl10k that is not visually recognizable is hollowareas. This damage is usually identified by hammering on the concrete surface, thus, it can only be detected acoustically (not visually) but, as it is bordered with chalk during hands-on inspections, the authors annotated its markings. The objects group includes all components of a bridge that are not made of concrete, such as joint tapes, railings or impact attenuation devices (protective equipment). The objects often show defects such as geometrical irregularities or deficits in structural capacity. Geometrical irregularities can arise from wrong distances between the railing rods or if the railing height is less than the minimum according to the given national standard. These visually challenging recognizable issues are not part of the dataset.
Dataset comprises coarse pixel-level annotations. The authors border each defect and object on a given image with one polygon (shape) and assign its label. Furthermore, they include polygons of the same class that overlap with each other in one shape. With respect to inspection standards and application, for all the defect classes, it is not important to differentiate between instances of a given class. Instead, their size and localization on a class-basis is important. Thereby, the authors utilize the open-source labeling tool LabelMe.
It often appears that shapes of different damage or object classes overlap with each other. Consequently, the underlying task can be described as multi-label semantic segmentation because one pixel can be part of multiple defects and objects. In other words, the labels are not assigned mutually exclusive to the pixels. The authors labeling process consisted of two consecutive steps: annotation of data received from engineering offices by civil engineering students (in-house) and annotation data from the authorities by an external annotation team, previously filtered for relevant image content. The students labeled approximately 7,000 images in accordance to our guidelines. Nearly 30% of the images had to be rejected due to flags indicating bad quality (blurring, overexposure) or personal data.
The pipeline during in-house labeling was separated into three parts. The first part consisted of the regular annotation which comprises annotating a batch of 100 images, getting feedback by a domain expert and correcting the failures accordingly. The second part included an extensive analysis of the dataset to find structural failures in the annotations. Thirdly, the dataset was divided into subtasks with respect to the failures most commonly made. Then, one student corrected each failure type consecutively. The quality assessment of the data annotated by the external team was divided into four quality checks for each data batch. In average, one batch included 250 images. Each check included one iteration over the annotated data by experts. Based on the analysis, the error rate was determined which is the ratio of false-labeled images and total amount of frames in the according batch. Starting with an error rate of 60%, the rate could be lowered to a final value of 1%.
Statistical analysis
Regarding the pixel counts over the whole dataset, it can be stated that weathering, followed by protective equipment, are the most dominant classes with
nearly four and 1.5 billion pixels. Within the range of 0.1 billion and 1 billion pixels, the majority of defects and objects with respect to the number of pixels can be found. Clearly underrepresented are the defects restformwork (66 million) and the objects joint tape (68 million) and exposed rebars (65 million).
Pixel counts with respect to each class in dacl10k based on the original image sizes. The bars are arranged according to the group affiliation.
The average image size is 1581 px in height and 1950 px in width. The mean image area is approximately 4 megapixels while the total pixel area in the dataset is approx. 43 billion px. Table below provides an overview of statistics describing the classwise density of polygons, size of polygons, density of pixels, share of polygons and share of pixels over the whole dataset. In average, 1.8 crack shapes are present on a crack image, whereby, one polygon includes 27,467 px. The average crack image shows approx. 50,000 px labeled as crack. With respect to the displayed shares, four out of 100 polygons are labeled as crack and
0.3% of the total pixel area received the label crack.
Furthermore, table below reveals the cause of the overrepresented classes weathering and protective equipment. They display a share regarding the number of polygons of 5.31% (top 20%) and 2.09% (exactly the median). This, in combination with the fact that an according image shows 900,000 px or rather 786,000 px of that class, leads to their dominant role. The overrepresentation of weathering can be more fatal than the one of protective equipment with respect to the model performance. This is due to the fact thatthe features (shape and texture) of weathering are similar to the ones from wetspot. Both are of round shape and represented by a darker area surrounded by a brighter “rest”. They vary slightly with regards to their texture. weathering is more noisy and more matt than wetspot which is smooth and sometimes mirroring.
In addition, wetspot and weathering often overlap which makes it difficult to distinguish between them from the model’s perspective. The features of the object protective equipment, in contrast, are unique and therefore shouldn’t interfere with other classes during learning. The lack of pixels representing restformwork, exposed rebars and joint tape, as mentioned before, originates from their relatively rare occurrences but mostly from their small shapes. In average, polygons bordering restformwork or joint tape have a size of approx. 50,000 px while polygons labeled as exposed rebars include 26,000 px. The average size of their polygons is equal to or less than the lower quartile (50,367 px). Additionally, exposed rebars shows the smallest average polygon size of all classes.
Overall statistics of the dataset regarding average number of polygons per image, number of pixels per polygon, number of pixels per image, share of polygons and share of pixels. Midrules separate the classes according to their group affiliation.
 Homepage
 Research PaperDacl Challenge Data
Summary #
dacl10k: Benchmark for Semantic Bridge Damage Segmentation is a dataset for instance segmentation, semantic segmentation, and object detection tasks. It is used in the construction industry.
The dataset consists of 9920 images with 62327 labeled objects belonging to 19 different classes including rust, spalling, weathering, and other: crack, efflorescence, protective equipment, cavity, hollowareas, drainage, wetspot, graffiti, joint tape, exposed rebars, restformwork, bearing, expansion joint, alligator crack, rockpocket, and washouts/concrete corrosion.
Images in the dacl10k dataset have pixel-level instance segmentation annotations. Due to the nature of the instance segmentation task, it can be automatically transformed into a semantic segmentation (only one mask for every class) or object detection (bounding boxes for every object) tasks. There are 2081 (21% of the total) unlabeled images (i.e. without annotations). There are 3 splits in the dataset: train (6935 images), test (2010 images), and val (975 images). Additionally, each label in images has concrete defect, general defect, or object part tag. Also every image in test dataset has one of following tags: test dev or test challenge. Explore it in supervisely labeling tool. The dataset was released in 2023 by the University of the Bundeswehr Munich, Germany.
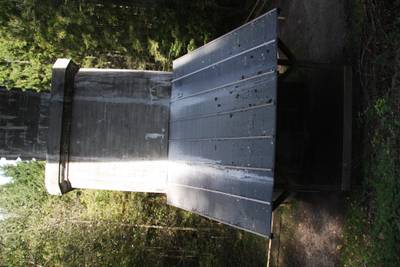
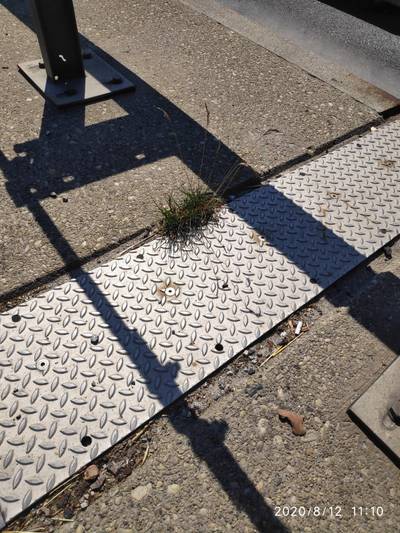
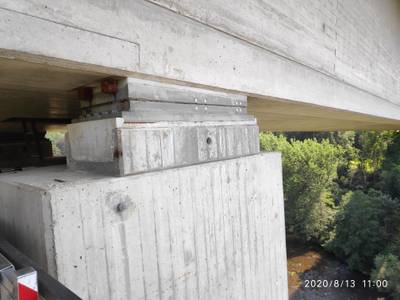
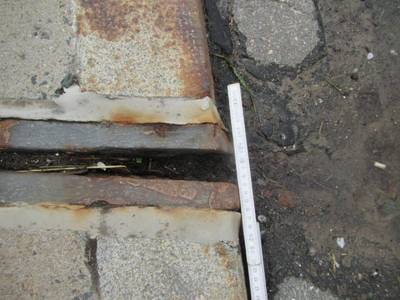
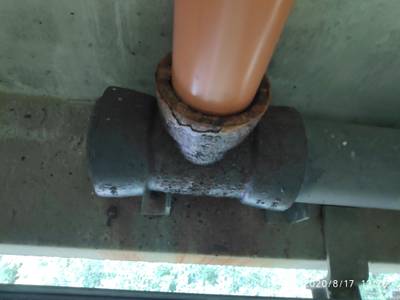
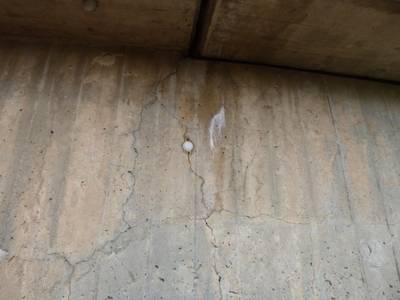
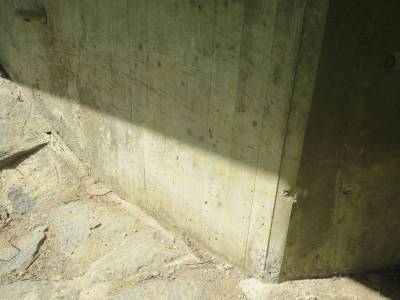
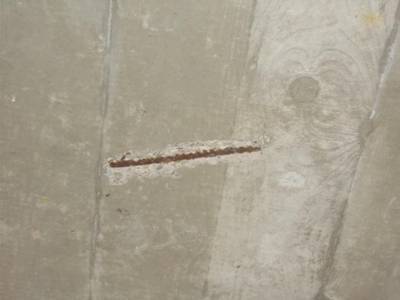
Here are the visualized examples for the classes:
Explore #
dacl10k dataset has 9920 images. Click on one of the examples below or open "Explore" tool anytime you need to view dataset images with annotations. This tool has extended visualization capabilities like zoom, translation, objects table, custom filters and more. Hover the mouse over the images to hide or show annotations.


Class balance #
There are 19 annotation classes in the dataset. Find the general statistics and balances for every class in the table below. Click any row to preview images that have labels of the selected class. Sort by column to find the most rare or prevalent classes.

Class ㅤ | Images ㅤ | Objects ㅤ | Count on image average | Area on image average |
|---|---|---|---|---|
rust➔ polygon | 3915 | 14720 | 3.76 | 4.55% |
spalling➔ polygon | 3739 | 9884 | 2.64 | 5.48% |
weathering➔ polygon | 3096 | 4634 | 1.5 | 34.5% |
crack➔ polygon | 1981 | 3626 | 1.83 | 1.33% |
efflorescence➔ polygon | 1729 | 3965 | 2.29 | 9.34% |
protective equipment➔ polygon | 1494 | 1890 | 1.27 | 20.66% |
cavity➔ polygon | 1355 | 9271 | 6.84 | 4.67% |
hollowareas➔ polygon | 1252 | 1557 | 1.24 | 17.87% |
drainage➔ polygon | 1181 | 1652 | 1.4 | 6.62% |
wetspot➔ polygon | 1109 | 1661 | 1.5 | 18.57% |
Co-occurrence matrix #
Co-occurrence matrix is an extremely valuable tool that shows you the images for every pair of classes: how many images have objects of both classes at the same time. If you click any cell, you will see those images. We added the tooltip with an explanation for every cell for your convenience, just hover the mouse over a cell to preview the description.
Images #
Explore every single image in the dataset with respect to the number of annotations of each class it has. Click a row to preview selected image. Sort by any column to find anomalies and edge cases. Use horizontal scroll if the table has many columns for a large number of classes in the dataset.
Class sizes #
The table below gives various size properties of objects for every class. Click a row to see the image with annotations of the selected class. Sort columns to find classes with the smallest or largest objects or understand the size differences between classes.
Class | Object count | Avg area | Max area | Min area | Min height | Min height | Max height | Max height | Avg height | Avg height | Min width | Min width | Max width | Max width |
|---|---|---|---|---|---|---|---|---|---|---|---|---|---|---|
rust polygon | 14720 | 1.2% | 98.49% | 0% | 4px | 0.25% | 4032px | 100% | 174px | 11.24% | 4px | 0.22% | 5176px | 100% |
spalling polygon | 9884 | 2.06% | 99.71% | 0% | 6px | 0.25% | 4030px | 100% | 222px | 15.66% | 6px | 0.44% | 5472px | 100% |
cavity polygon | 9271 | 0.68% | 99.87% | 0% | 2px | 0.21% | 3000px | 100% | 55px | 4.75% | 3px | 0.18% | 3898px | 100% |
weathering polygon | 4634 | 23.04% | 99.94% | 0% | 11px | 0.77% | 4032px | 100% | 642px | 49.79% | 11px | 0.62% | 5152px | 100% |
efflorescence polygon | 3965 | 4.05% | 99.94% | 0% | 8px | 0.6% | 3742px | 100% | 419px | 25.68% | 4px | 0.21% | 5053px | 100% |
crack polygon | 3626 | 0.7% | 11.01% | 0% | 8px | 0.45% | 4240px | 100% | 388px | 23.85% | 9px | 0.4% | 4240px | 100% |
graffiti polygon | 2200 | 7.53% | 99.94% | 0% | 6px | 0.62% | 3267px | 100% | 327px | 27.65% | 5px | 0.52% | 4673px | 100% |
exposed rebars polygon | 2000 | 0.54% | 41.58% | 0% | 6px | 0.41% | 3130px | 100% | 199px | 11.37% | 5px | 0.33% | 4256px | 99.95% |
protective equipment polygon | 1890 | 16.27% | 100.47% | 0.01% | 8px | 0.67% | 4032px | 100% | 605px | 41.01% | 8px | 0.62% | 5152px | 100% |
wetspot polygon | 1661 | 12.37% | 99.94% | 0.01% | 9px | 1.32% | 4000px | 100% | 486px | 40.47% | 15px | 0.94% | 4441px | 100% |
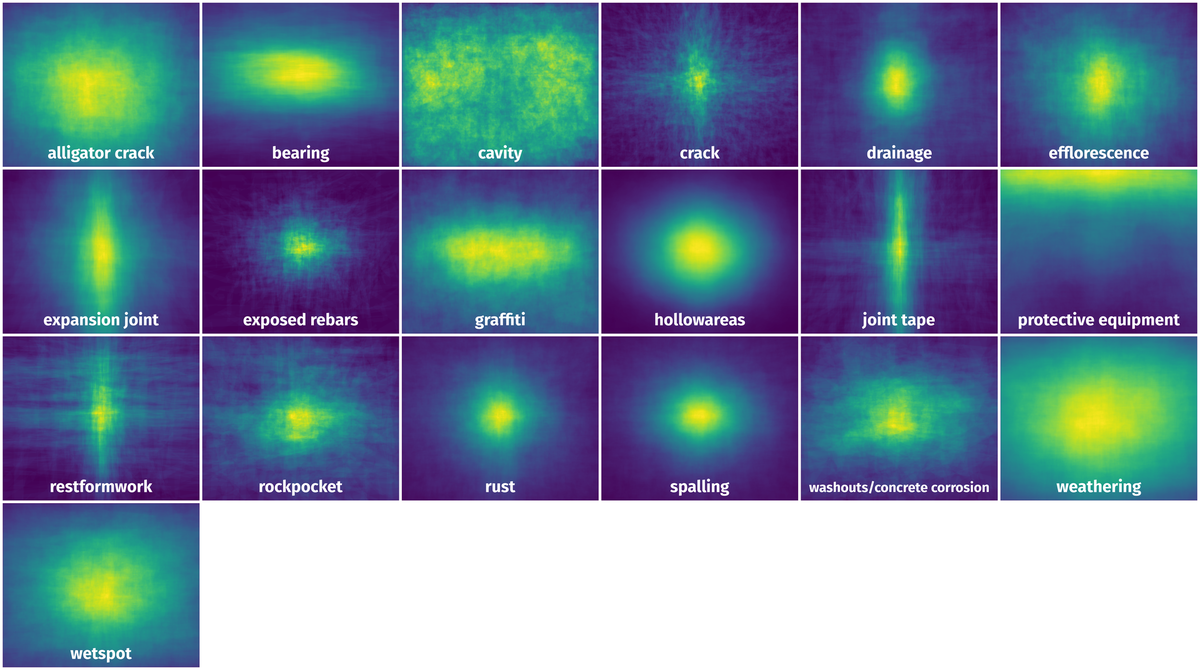
Spatial Heatmap #
The heatmaps below give the spatial distributions of all objects for every class. These visualizations provide insights into the most probable and rare object locations on the image. It helps analyze objects' placements in a dataset.
Objects #
Table contains all 62327 objects. Click a row to preview an image with annotations, and use search or pagination to navigate. Sort columns to find outliers in the dataset.
Object ID ㅤ | Class ㅤ | Image name click row to open | Image size height x width | Height ㅤ | Height ㅤ | Width ㅤ | Width ㅤ | Area ㅤ |
|---|---|---|---|---|---|---|---|---|
1➔ | spalling polygon | dacl10k_v2_train_3793.jpg | 2448 x 3264 | 384px | 15.69% | 372px | 11.4% | 1.31% |
2➔ | spalling polygon | dacl10k_v2_train_3793.jpg | 2448 x 3264 | 150px | 6.13% | 150px | 4.6% | 0.13% |
3➔ | spalling polygon | dacl10k_v2_train_3793.jpg | 2448 x 3264 | 484px | 19.77% | 377px | 11.55% | 1.51% |
4➔ | rust polygon | dacl10k_v2_train_3793.jpg | 2448 x 3264 | 214px | 8.74% | 77px | 2.36% | 0.14% |
5➔ | spalling polygon | dacl10k_v2_train_3793.jpg | 2448 x 3264 | 311px | 12.7% | 128px | 3.92% | 0.34% |
6➔ | drainage polygon | dacl10k_v2_train_3793.jpg | 2448 x 3264 | 389px | 15.89% | 475px | 14.55% | 1.42% |
7➔ | graffiti polygon | dacl10k_v2_train_3793.jpg | 2448 x 3264 | 1047px | 42.77% | 2835px | 86.86% | 22.42% |
8➔ | graffiti polygon | dacl10k_v2_train_3793.jpg | 2448 x 3264 | 831px | 33.95% | 1219px | 37.35% | 8.21% |
9➔ | graffiti polygon | dacl10k_v2_train_3793.jpg | 2448 x 3264 | 133px | 5.43% | 122px | 3.74% | 0.13% |
10➔ | hollowareas polygon | dacl10k_v2_train_3793.jpg | 2448 x 3264 | 508px | 20.75% | 412px | 12.62% | 1.85% |
License #
dacl10k: Benchmark for Semantic Bridge Damage Segmentation is under CC BY-NC 4.0 license.
Citation #
If you make use of the dacl10k data, please cite the following reference:
@dataset{dacl10k,
  author={Johannes Flotzinger and Philipp J. Rosch and Thomas Braml},
  title={dacl10k: Benchmark for Semantic Bridge Damage Segmentation},
  year={2023},
  url={https://dacl.ai/workshop.html}
}
If you are happy with Dataset Ninja and use provided visualizations and tools in your work, please cite us:
@misc{ visualization-tools-for-dacl10k-dataset,
  title = { Visualization Tools for dacl10k Dataset },
  type = { Computer Vision Tools },
  author = { Dataset Ninja },
  howpublished = { \url{ https://datasetninja.com/dacl10k } },
  url = { https://datasetninja.com/dacl10k },
  journal = { Dataset Ninja },
  publisher = { Dataset Ninja },
  year = { 2026 },
  month = { jul },
  note = { visited on 2026-07-16 },
}
Download #
Dataset dacl10k can be downloaded in Supervisely format:
As an alternative, it can be downloaded with dataset-tools package:
pip install --upgrade dataset-tools
… using following python code:
import dataset_tools as dtools

dtools.download(dataset='dacl10k', dst_dir='~/dataset-ninja/')
Make sure not to overlook the python code example available on the Supervisely Developer Portal. It will give you a clear idea of how to effortlessly work with the downloaded dataset.
The data in original format can be downloaded here:
Disclaimer #
Our gal from the legal dep told us we need to post this:
Dataset Ninja provides visualizations and statistics for some datasets that can be found online and can be downloaded by general audience. Dataset Ninja is not a dataset hosting platform and can only be used for informational purposes. The platform does not claim any rights for the original content, including images, videos, annotations and descriptions. Joint publishing is prohibited.
You take full responsibility when you use datasets presented at Dataset Ninja, as well as other information, including visualizations and statistics we provide. You are in charge of compliance with any dataset license and all other permissions. You are required to navigate datasets homepage and make sure that you can use it. In case of any questions, get in touch with us at hello@datasetninja.com.