

Introduction #
The authors introduced DeepFish Dataset as a benchmark suite accompanied by a vast dataset tailored for training and evaluating various computer vision tasks. This dataset comprises roughly 40,000 images captured underwater across 20 distinct habitats in the tropical waters of Australia. Initially, the dataset solely featured classification labels. However, recognizing the need for a more comprehensive fish analysis benchmark, the authors augmented it by collecting segmentation labels. These labels empower models to autonomously monitor fish populations, pinpoint their locations, and estimate their sizes, thereby enhancing the dataset’s utility for diverse analytical purposes.
Motivation
Effective monitoring of fish populations in their natural habitats is essential for promoting sustainable fisheries practices. In regions like New South Wales, Australia, where the fisheries industry was valued at over 100 million Australian dollars in 2012–2014, such monitoring plays a crucial role. By providing insights into areas requiring protection and restoration, it helps maintain robust fish populations vital for both human consumption and environmental conservation. The automation of monitoring processes can significantly reduce labor costs and enhance efficiency, leading to positive sustainability outcomes and contributing to the preservation of a healthy ecosystem.
Deep learning techniques have consistently demonstrated remarkable performance in image analysis tasks. However, the automatic analysis of underwater fish habitats presents a unique and challenging application, demanding a sophisticated and accurate computer vision system. Extensive research endeavors have been directed towards developing such systems, aiming to understand the complexities of marine environments and differentiate between various fish species. These efforts rely on publicly available fish datasets. Nevertheless, existing datasets are limited in size and fail to fully capture the variability and intricacies of real-world underwater habitats. These habitats often feature adverse water conditions, significant resemblance between fish and background elements such as rocks, and occlusions among fish, posing additional challenges for accurate analysis.
Dataset description
The authors introduce DeepFish as a benchmark specifically designed for analyzing fish in underwater marine environments, leveraging a dataset derived from in-situ field recordings. This dataset comprises around 40,000 high-resolution (1,920 × 1,080) images captured underwater across 20 distinct marine habitats in tropical Australia. These images span a wide range of coastal and nearshore benthic habitats commonly inhabited by fish species in the region, providing a comprehensive representation of underwater environments.
Locations where the DeepFish images were acquired.
Moreover, the authors extend beyond the initial classification labels by obtaining point-level and semantic segmentation labels, enabling additional computer vision tasks. These labels empower models to gain insights into fish habitats from various angles, including understanding fish behavior, monitoring population counts, and estimating their sizes and shapes. To assess the dataset’s properties and establish preliminary results for this benchmark, state-of-the-art methods are evaluated using these labels.
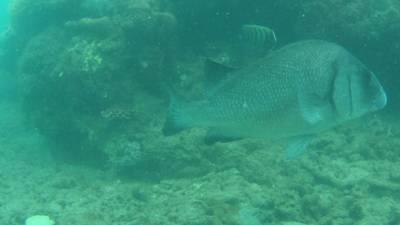
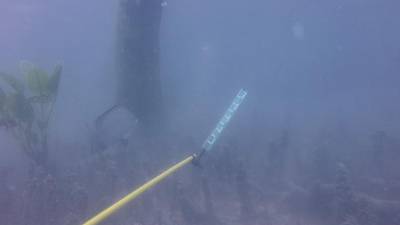
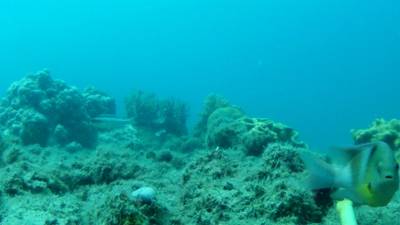
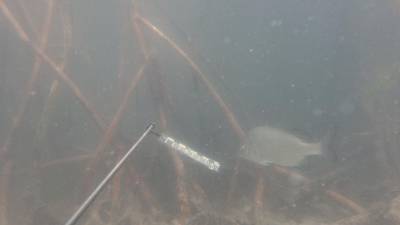
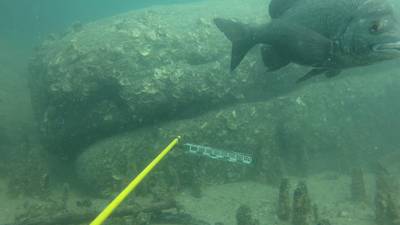
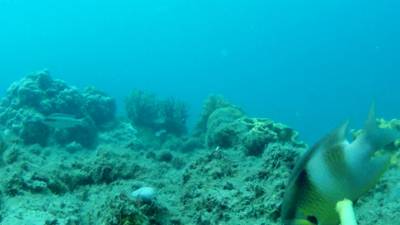
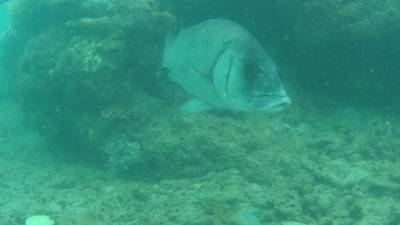
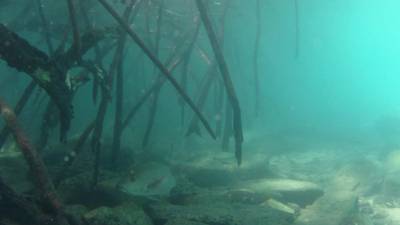
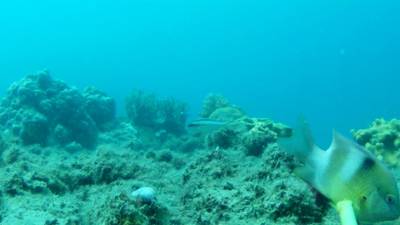
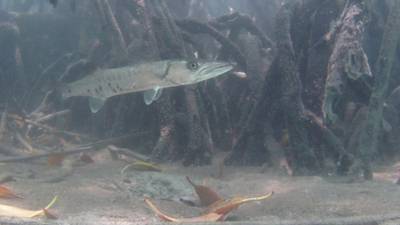
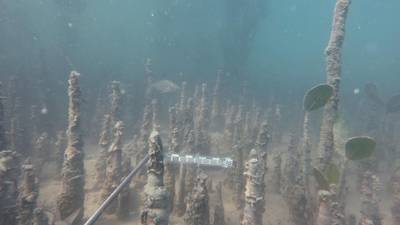
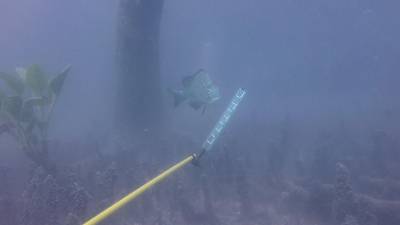
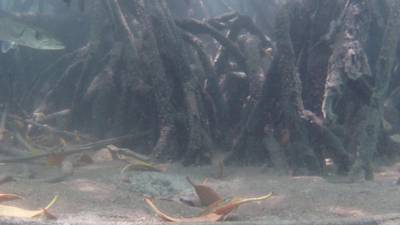
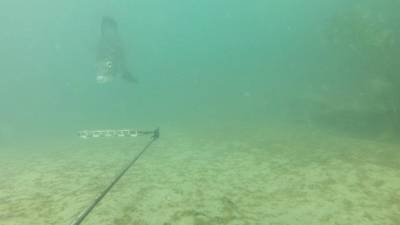
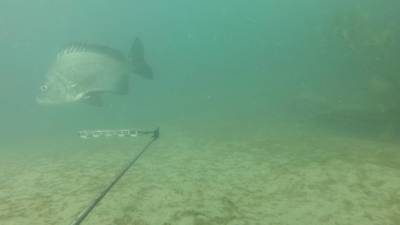
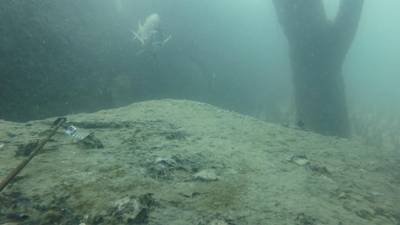
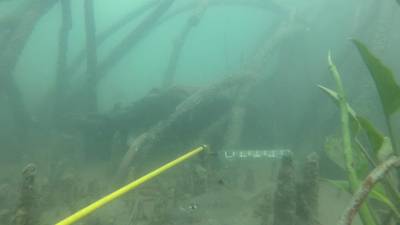
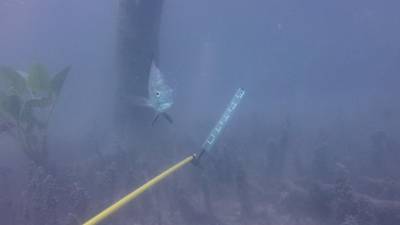
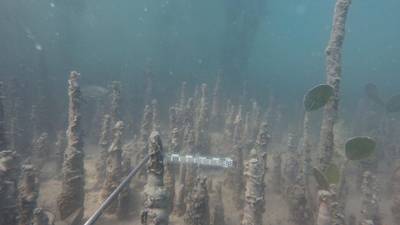
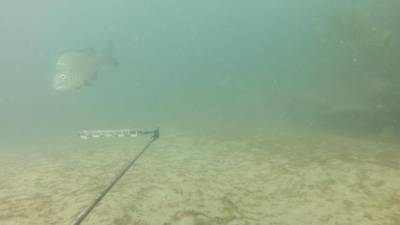
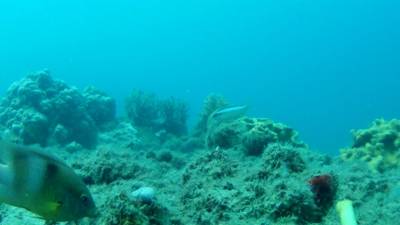
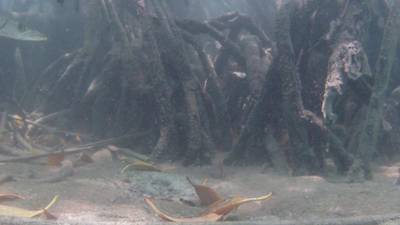
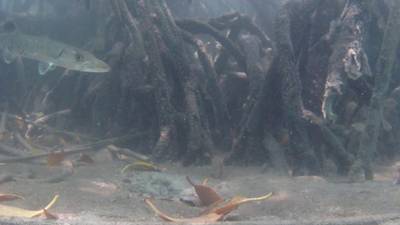
DeepFish image samples across 20 different habitats.
The authors aimed to develop a benchmark that could significantly advance understanding of fish habitats. Consequently, they meticulously examined the quality of data acquisition, preparation, and annotation protocol. They began by selecting a dataset established by Bradley and colleagues, which encompasses a vast collection of images (approximately 40 thousand) capturing a wide range of underwater fish habitats with high variability. The dataset’s diversity and size render it well-suited for training and evaluating deep learning techniques. To enhance the dataset and create a more comprehensive testbed conducive to inspiring new, specialized algorithms for this problem domain, the authors tailored it accordingly, naming it DeepFish.
Videos for DeepFish were gathered across 20 habitats situated in remote coastal marine settings of tropical Australia. These videos were captured using cameras affixed to metal frames, strategically deployed over the side of a vessel to capture underwater footage. Submerged cameras were lowered to the seabed, where they recorded the natural fish community, while the vessel maintained a distance of 100 meters. The depth and precise map coordinates of the cameras were meticulously recorded using an acoustic depth sounder and GPS, respectively. Video recordings were conducted during daylight hours and under conditions of relatively low turbidity to ensure optimal visibility. The video clips were captured in full HD resolution (1,920 × 1,080 pixels) using a digital camera, resulting in a total of 39,766 frames. This method of image acquisition employs a low-disturbance approach, allowing for the accurate assessment of fish habitat associations in challenging and often inaccessible environments.
| Habitats | Fish Clf | Fish Loc | Fish Seg |
|---|---|---|---|
| Low complexity reef | 4,977 | 357 | 77 |
| Sandy mangrove prop roots | 4,162 | 322 | 42 |
| Complex reef | 4,018 | 190 | 16 |
| Seagrass bed | 3,255 | 328 | 16 |
| Low algal bed | 2,795 | 282 | 17 |
| Reef trench | 2,653 | 187 | 48 |
| Boulders | 2,314 | 227 | 16 |
| Mixed substratum mangrove | 2,139 | 177 | 28 |
| Rocky Mangrove—prop roots | 2,119 | 211 | 27 |
| Upper Mangrove | 2,101 | 129 | 21 |
| Rock shelf | 1,848 | 186 | 19 |
| Mangrove | 1,542 | 157 | 33 |
| Sparse algal bed | 1,467 | 0 | 0 |
| Muddy mangrove | 1,117 | 113 | 79 |
| Large boulder and pneumatophores | 900 | 91 | 37 |
| Rocky mangrove—large boulder | 560 | 57 | 28 |
| Bare substratum | 526 | 55 | 32 |
| Upper mangrove | 475 | 49 | 28 |
| Large boulder | 434 | 45 | 27 |
| Muddy mangrove | 364 | 37 | 29 |
| Total | 39,766 | 3,200 | 620 |
DeepFish dataset statistics. Number of images annotated for each sub-dataset: FishClf for classification, FishLoc for counting/localization, and FishSeg for semantic segmentation.
The original labels of the dataset are limited to classification tasks, providing binary information indicating the presence or absence of fish in each video frame, regardless of the fish count. While these labels serve a purpose in analyzing fish utilization across different habitats by categorizing images based on fish presence, they lack the granularity needed for detailed habitat analysis. To overcome this limitation, they obtained point-level and semantic segmentation labels. These additional annotations enable models to perform more advanced computer vision tasks such as object counting, localization, and segmentation. With these labels, the models can learn to accurately analyze and interpret the complexities of underwater habitats, facilitating a deeper understanding of fish dynamics and habitat characteristics.
Dataset splits
The authors establish sub-datasets tailored for each specific computer vision task: FishClf for classification, FishLoc for counting and localization, and FishSeg for segmentation. To ensure robustness and representativeness in their splits, they implement a systematic approach rather than a random allocation method. Their approach involves partitioning the annotated images into training, validation, and test sets, considering the diversity of fish habitats and maintaining a balanced representation of fish populations across splits. Specifically, they initially categorize images within each habitat into those containing no fish (background) and those with at least one fish (foreground). Subsequently, they allocate 50% of images for training, 20% for validation, and 30% for testing for each habitat, ensuring an equal distribution of background and foreground images within each split. Afterward, the authors aggregate the selected training images from all habitats to form the training split for the dataset, following the same procedure for validation and testing splits. This meticulous approach results in a distinctive split comprising 19,883, 7,953, and 11,930 images (for training, validation, and test sets respectively) for FishClf, 1,600, 640, and 960 images for FishLoc, and 310, 124, and 186 images for FishSeg.
 Homepage
 Research Paper
 GitHub
Summary #
DeepFish Dataset is a dataset for instance segmentation, classification, semantic segmentation, object detection, counting, and localization tasks. It is used in the environmental research, and in the fishery industry.
The dataset consists of 43586 images with 374 labeled objects belonging to 1 single class (fish).
Images in the DeepFish dataset have pixel-level instance segmentation annotations. Due to the nature of the instance segmentation task, it can be automatically transformed into a semantic segmentation (only one mask for every class) or object detection (bounding boxes for every object) tasks. There are 43276 (99% of the total) unlabeled images (i.e. without annotations). There are 9 splits in the dataset: classification test (19884 images), classification train (15906 images), classification val (3976 images), localization train (1600 images), localization test (960 images), localization val (640 images), segmentation train (310 images), segmentation test (186 images), and segmentation val (124 images). Alternatively, the dataset could be split into 20 habitats: low complexity reef (5411 images), sandy mangrove prop roots (4526 images), complex reef (4224 images), seagrass bed (3599 images), low algal bed (3094 images), reef trench (2888 images), boulders (2557 images), rocky mangrove - prop roots (2357 images), mixed substratum mangrove - prop roots (2344 images), upper mangrove - medium rhizophora (2251 images), rock shelf (2053 images), mangrove - mixed pneumatophore prop root (1732 images), sparse algal bed (1467 images), muddy mangrove - pneumatophores and trunk (1309 images), large boulder and pneumatophores (1028 images), rocky mangrove - large boulder and trunk (645 images), bare substratum (613 images), upper mangrove - tall rhizophora (552 images), large boulder (506 images), and muddy mangrove - pneumatophores (430 images). Additionally, some images marked with no fish and fish count tags. The dataset was released in 2020 by the James Cook University, Australia, University of British Columbia, Canada, and Element AI, Canada.
Explore #
DeepFish dataset has 43586 images. Click on one of the examples below or open "Explore" tool anytime you need to view dataset images with annotations. This tool has extended visualization capabilities like zoom, translation, objects table, custom filters and more. Hover the mouse over the images to hide or show annotations.


Class balance #
There are 1 annotation classes in the dataset. Find the general statistics and balances for every class in the table below. Click any row to preview images that have labels of the selected class. Sort by column to find the most rare or prevalent classes.

Class ㅤ | Images ㅤ | Objects ㅤ | Count on image average | Area on image average |
|---|---|---|---|---|
fish➔ mask | 310 | 374 | 1.21 | 3.93% |
Images #
Explore every single image in the dataset with respect to the number of annotations of each class it has. Click a row to preview selected image. Sort by any column to find anomalies and edge cases. Use horizontal scroll if the table has many columns for a large number of classes in the dataset.
Object distribution #
Interactive heatmap chart for every class with object distribution shows how many images are in the dataset with a certain number of objects of a specific class. Users can click cell and see the list of all corresponding images.
Class sizes #
The table below gives various size properties of objects for every class. Click a row to see the image with annotations of the selected class. Sort columns to find classes with the smallest or largest objects or understand the size differences between classes.
Class | Object count | Avg area | Max area | Min area | Min height | Min height | Max height | Max height | Avg height | Avg height | Min width | Min width | Max width | Max width |
|---|---|---|---|---|---|---|---|---|---|---|---|---|---|---|
fish mask | 374 | 3.26% | 17.81% | 0.03% | 40px | 3.7% | 690px | 63.89% | 258px | 23.89% | 15px | 0.78% | 1174px | 61.15% |
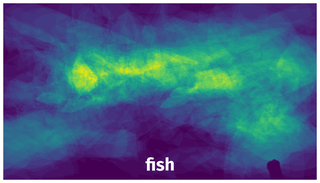
Spatial Heatmap #
The heatmaps below give the spatial distributions of all objects for every class. These visualizations provide insights into the most probable and rare object locations on the image. It helps analyze objects' placements in a dataset.
Objects #
Table contains all 374 objects. Click a row to preview an image with annotations, and use search or pagination to navigate. Sort columns to find outliers in the dataset.
Object ID ㅤ | Class ㅤ | Image name click row to open | Image size height x width | Height ㅤ | Height ㅤ | Width ㅤ | Width ㅤ | Area ㅤ |
|---|---|---|---|---|---|---|---|---|
1➔ | fish mask | 9892_Acanthopagrus_palmaris_2_f000000.jpg | 1080 x 1920 | 214px | 19.81% | 481px | 25.05% | 2.62% |
2➔ | fish mask | 7398_F6_f000010.jpg | 1080 x 1920 | 127px | 11.76% | 227px | 11.82% | 0.73% |
3➔ | fish mask | 9894_Amniataba_caudivittatus_f000030.jpg | 1080 x 1920 | 165px | 15.28% | 443px | 23.07% | 2.19% |
4➔ | fish mask | 9870_Gerres_f000030.jpg | 1080 x 1920 | 53px | 4.91% | 169px | 8.8% | 0.3% |
5➔ | fish mask | 9870_Gerres_f000180.jpg | 1080 x 1920 | 102px | 9.44% | 209px | 10.89% | 0.39% |
6➔ | fish mask | 9908_Acanthopagrus_palmaris_f000050.jpg | 1080 x 1920 | 485px | 44.91% | 875px | 45.57% | 11.69% |
7➔ | fish mask | 7482_F2_f000440.jpg | 1080 x 1920 | 484px | 44.81% | 335px | 17.45% | 4.81% |
8➔ | fish mask | 7482_F2_f000440.jpg | 1080 x 1920 | 91px | 8.43% | 214px | 11.15% | 0.52% |
9➔ | fish mask | 9894_Amniataba_caudivittatus_f000010.jpg | 1080 x 1920 | 207px | 19.17% | 396px | 20.62% | 2.31% |
10➔ | fish mask | 9894_gerres_2_f000000.jpg | 1080 x 1920 | 111px | 10.28% | 345px | 17.97% | 0.96% |
License #
Citation #
If you make use of the Deep Fish data, please cite the following reference:
@article{saleh2020realistic,
  title={A realistic fish-habitat dataset to evaluate algorithms for underwater visual analysis},
  author={Saleh, Alzayat and Laradji, Issam H and Konovalov, Dmitry A and Bradley, Michael and Vazquez, David and Sheaves, Marcus},
  journal={Scientific Reports},
  volume={10},
  number={1},
  pages={14671},
  year={2020},
  publisher={Nature Publishing Group UK London},
  doi={https://doi.org/10.1038/s41598-020-71639-x}
}
If you are happy with Dataset Ninja and use provided visualizations and tools in your work, please cite us:
@misc{ visualization-tools-for-deep-fish-dataset,
  title = { Visualization Tools for DeepFish Dataset },
  type = { Computer Vision Tools },
  author = { Dataset Ninja },
  howpublished = { \url{ https://datasetninja.com/deep-fish } },
  url = { https://datasetninja.com/deep-fish },
  journal = { Dataset Ninja },
  publisher = { Dataset Ninja },
  year = { 2026 },
  month = { jul },
  note = { visited on 2026-07-24 },
}
Download #
Dataset DeepFish can be downloaded in Supervisely format:
As an alternative, it can be downloaded with dataset-tools package:
pip install --upgrade dataset-tools
… using following python code:
import dataset_tools as dtools

dtools.download(dataset='DeepFish', dst_dir='~/dataset-ninja/')
Make sure not to overlook the python code example available on the Supervisely Developer Portal. It will give you a clear idea of how to effortlessly work with the downloaded dataset.
The data in original format can be downloaded here.
Disclaimer #
Our gal from the legal dep told us we need to post this:
Dataset Ninja provides visualizations and statistics for some datasets that can be found online and can be downloaded by general audience. Dataset Ninja is not a dataset hosting platform and can only be used for informational purposes. The platform does not claim any rights for the original content, including images, videos, annotations and descriptions. Joint publishing is prohibited.
You take full responsibility when you use datasets presented at Dataset Ninja, as well as other information, including visualizations and statistics we provide. You are in charge of compliance with any dataset license and all other permissions. You are required to navigate datasets homepage and make sure that you can use it. In case of any questions, get in touch with us at hello@datasetninja.com.