
Introduction #
The authors of the DeepLesion dataset recognize the importance and challenges of extracting, harvesting, and constructing large-scale annotated radiological image datasets. They propose a scalable approach that involves mining clinical annotations, specifically bookmarks in picture archiving and communication systems (PACS), made by radiologists during their daily workflow. This process results in the creation of DeepLesion, a dataset containing 32,735 lesions in 32,120 CT slices from 10,594 studies of 4,427 unique patients, covering various lesion types such as lung nodules, liver tumors, and enlarged lymph nodes. The authors emphasize the dataset’s potential applications in medical image tasks and use it to train a universal lesion detector with a unified framework. The full 220GB dataset with unlabeled images could be downloaded here.
 Homepage
 Research Paper
 Kaggle
Summary #
DeepLesion is a dataset for object detection, unsupervised learning, and weakly supervised learning tasks. It is used in the medical industry.
The dataset consists of 32118 images with 32733 labeled objects belonging to 1 single class (lesion).
Images in the DeepLesion dataset have bounding box annotations. All images are labeled (i.e. with annotations). There are 3 splits in the dataset: train (22494 images), test (4831 images), and val (4793 images). Additionally, every image contains information about age and gender, while every object contains information about lesion diameter and lesion type. The dataset was released in 2018 by the National Institutes of Health, USA.
Explore #
DeepLesion dataset has 32118 images. Click on one of the examples below or open "Explore" tool anytime you need to view dataset images with annotations. This tool has extended visualization capabilities like zoom, translation, objects table, custom filters and more. Hover the mouse over the images to hide or show annotations.


Class balance #
There are 1 annotation classes in the dataset. Find the general statistics and balances for every class in the table below. Click any row to preview images that have labels of the selected class. Sort by column to find the most rare or prevalent classes.

Class ㅤ | Images ㅤ | Objects ㅤ | Count on image average | Area on image average |
|---|---|---|---|---|
lesion➔ rectangle | 32118 | 32733 | 1.02 | 0.65% |
Images #
Explore every single image in the dataset with respect to the number of annotations of each class it has. Click a row to preview selected image. Sort by any column to find anomalies and edge cases. Use horizontal scroll if the table has many columns for a large number of classes in the dataset.
Object distribution #
Interactive heatmap chart for every class with object distribution shows how many images are in the dataset with a certain number of objects of a specific class. Users can click cell and see the list of all corresponding images.
Class sizes #
The table below gives various size properties of objects for every class. Click a row to see the image with annotations of the selected class. Sort columns to find classes with the smallest or largest objects or understand the size differences between classes.
Class | Object count | Avg area | Max area | Min area | Min height | Min height | Max height | Max height | Avg height | Avg height | Min width | Min width | Max width | Max width |
|---|---|---|---|---|---|---|---|---|---|---|---|---|---|---|
lesion rectangle | 32733 | 0.64% | 31.27% | 0.05% | 11px | 2.08% | 307px | 59.96% | 35px | 6.89% | 11px | 2.15% | 372px | 72.66% |
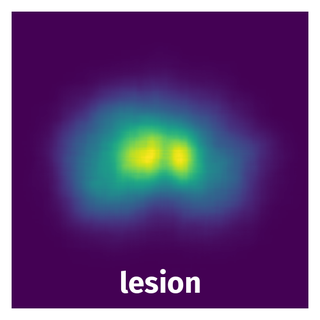
Spatial Heatmap #
The heatmaps below give the spatial distributions of all objects for every class. These visualizations provide insights into the most probable and rare object locations on the image. It helps analyze objects' placements in a dataset.
Objects #
Table contains all 32733 objects. Click a row to preview an image with annotations, and use search or pagination to navigate. Sort columns to find outliers in the dataset.
Object ID ㅤ | Class ㅤ | Image name click row to open | Image size height x width | Height ㅤ | Height ㅤ | Width ㅤ | Width ㅤ | Area ㅤ |
|---|---|---|---|---|---|---|---|---|
1➔ | lesion rectangle | 002358_01_01_069.png | 512 x 512 | 31px | 6.05% | 31px | 6.05% | 0.37% |
2➔ | lesion rectangle | 000161_04_01_060.png | 512 x 512 | 29px | 5.66% | 27px | 5.27% | 0.3% |
3➔ | lesion rectangle | 001532_04_01_049.png | 512 x 512 | 31px | 6.05% | 47px | 9.18% | 0.56% |
4➔ | lesion rectangle | 003204_01_01_059.png | 512 x 512 | 19px | 3.71% | 22px | 4.3% | 0.16% |
5➔ | lesion rectangle | 002488_03_01_026.png | 512 x 512 | 38px | 7.42% | 33px | 6.45% | 0.48% |
6➔ | lesion rectangle | 001532_03_01_050.png | 512 x 512 | 22px | 4.3% | 20px | 3.91% | 0.17% |
7➔ | lesion rectangle | 000254_05_01_103.png | 512 x 512 | 30px | 5.86% | 40px | 7.81% | 0.46% |
8➔ | lesion rectangle | 000732_10_02_309.png | 512 x 512 | 31px | 6.05% | 32px | 6.25% | 0.38% |
9➔ | lesion rectangle | 003458_01_01_025.png | 512 x 512 | 23px | 4.49% | 22px | 4.3% | 0.19% |
10➔ | lesion rectangle | 000655_01_02_121.png | 512 x 512 | 32px | 6.25% | 30px | 5.86% | 0.37% |
License #
License is unknown for the DeepLesion dataset.
Citation #
If you make use of the DeepLesion data, please cite the following reference:
@dataset{DeepLesion,
  author={Ke Yan and Xiaosong Wang and Le Lu and Ronald M. Summers},
  title={DeepLesion},
  year={2018},
  url={https://nihcc.app.box.com/v/DeepLesion/}
}
If you are happy with Dataset Ninja and use provided visualizations and tools in your work, please cite us:
@misc{ visualization-tools-for-deep-lesion-dataset,
  title = { Visualization Tools for DeepLesion Dataset },
  type = { Computer Vision Tools },
  author = { Dataset Ninja },
  howpublished = { \url{ https://datasetninja.com/deep-lesion } },
  url = { https://datasetninja.com/deep-lesion },
  journal = { Dataset Ninja },
  publisher = { Dataset Ninja },
  year = { 2026 },
  month = { jul },
  note = { visited on 2026-07-16 },
}
Download #
Please visit dataset homepage to download the data.
Disclaimer #
Our gal from the legal dep told us we need to post this:
Dataset Ninja provides visualizations and statistics for some datasets that can be found online and can be downloaded by general audience. Dataset Ninja is not a dataset hosting platform and can only be used for informational purposes. The platform does not claim any rights for the original content, including images, videos, annotations and descriptions. Joint publishing is prohibited.
You take full responsibility when you use datasets presented at Dataset Ninja, as well as other information, including visualizations and statistics we provide. You are in charge of compliance with any dataset license and all other permissions. You are required to navigate datasets homepage and make sure that you can use it. In case of any questions, get in touch with us at hello@datasetninja.com.