Introduction #
The authors of the 4 different DeepNIR datasets are interested in applying data-driven Machine Learning (ML) technologies to the agriculture sector, specifically in core agricultural tasks such as vegetation segmentation and fruit detection. They aim to investigate the potential improvements that can be achieved by adopting ML techniques, specifically synthetic image generation and data-driven object detection. Their initial focus is on generating synthetic near-infrared (NIR) images, which can serve as auxiliary information for object detection.
The NIR spectrum (λ∼750–850 nm) has been of great significance in various agricultural tasks since the 1970s. It has enabled the use of vegetation indices (e.g., NDVI) for assessing vegetation health and conditions. Similar to the thermal spectrum, which provides valuable information beyond the visible range, the NIR spectrum allows for the observation of chlorophyll responses in plants, particularly from leaves. This information is essential for agronomists to understand vegetation status and conditions.
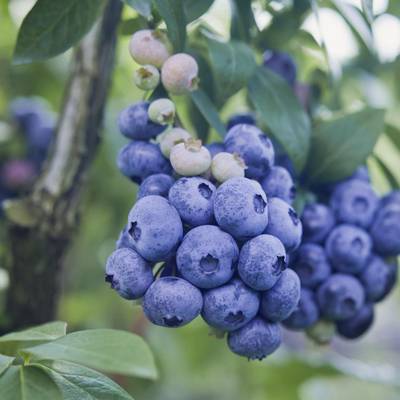
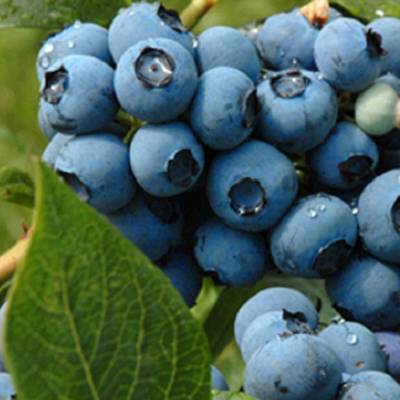
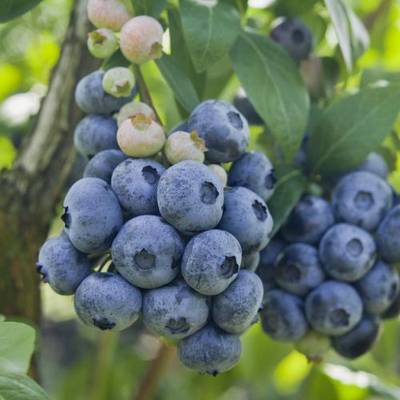
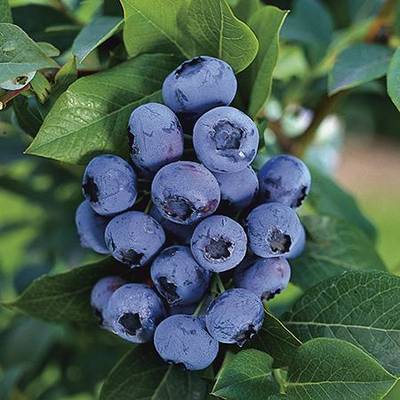
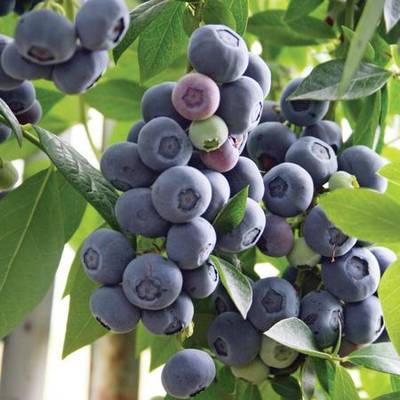
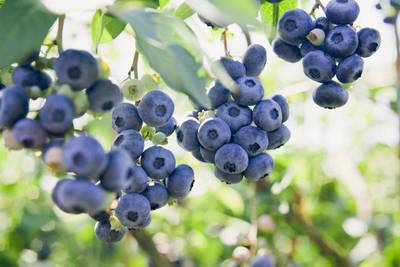
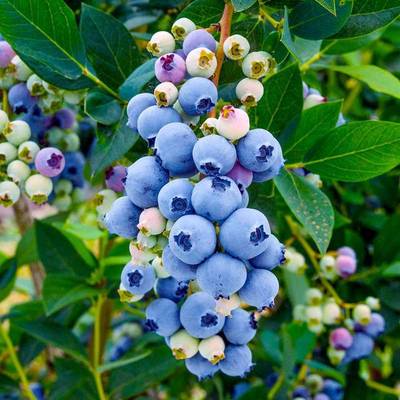
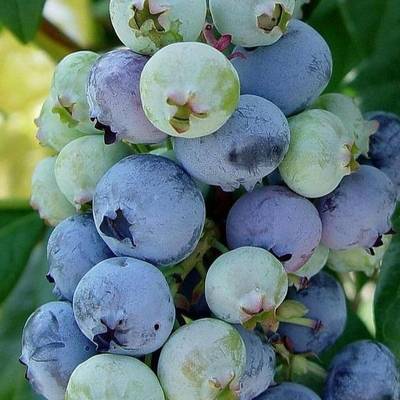
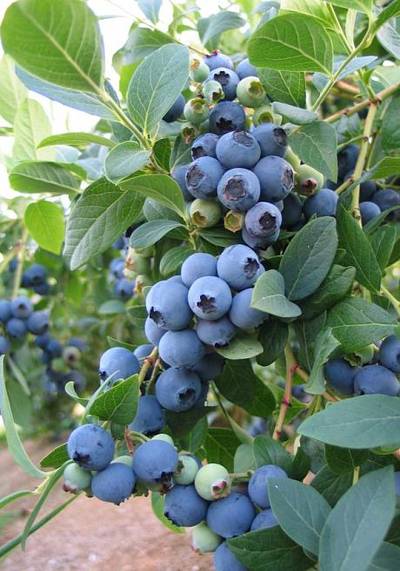
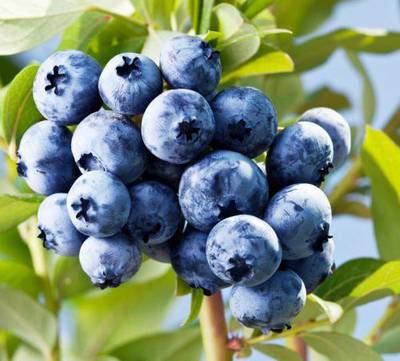
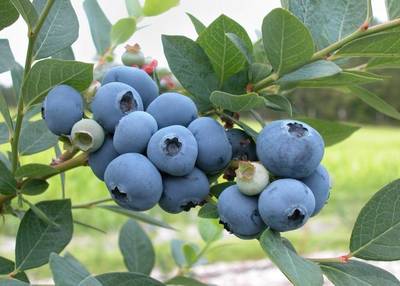
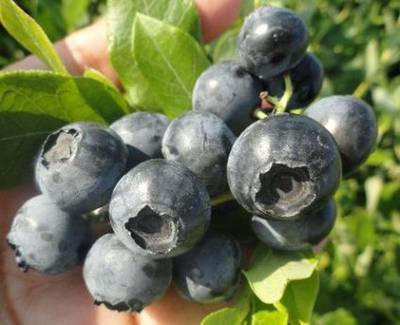
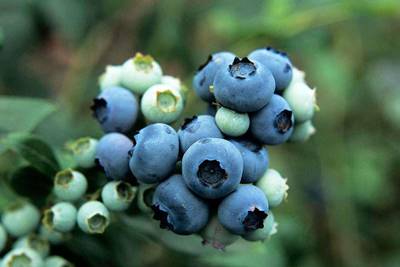
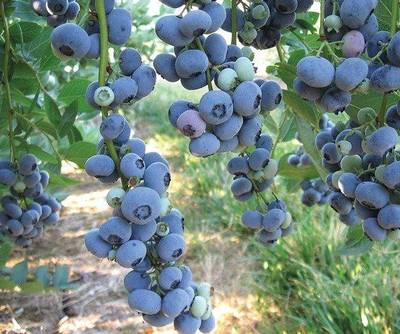
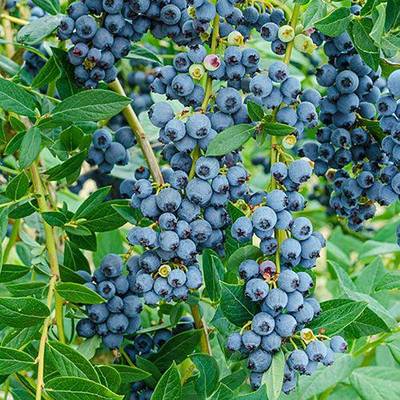
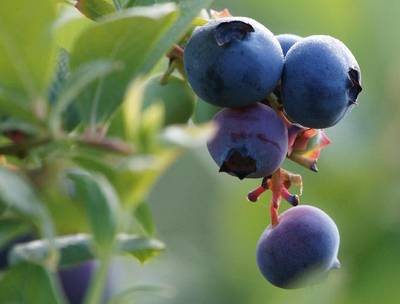
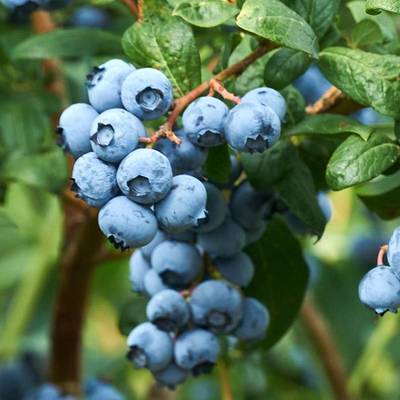
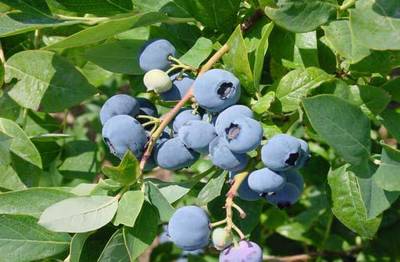
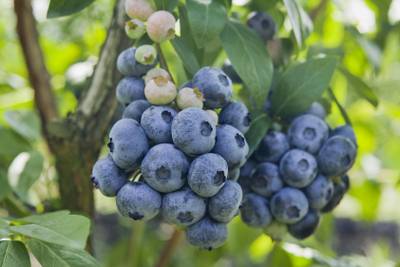
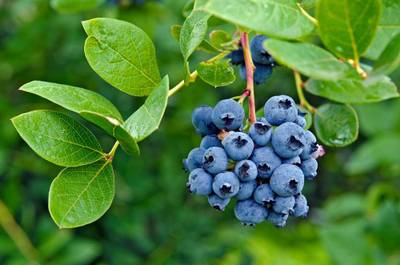
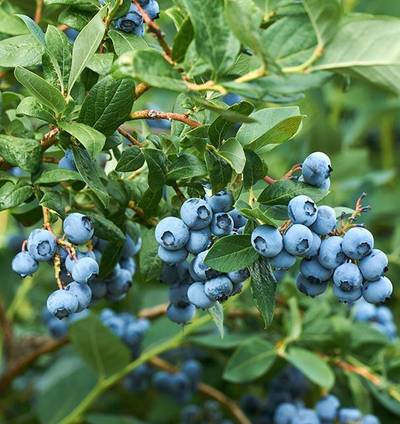
To evaluate the impact of synthetically generated images, the authors created a DeepNIR Fruit Detection dataset consisting of 4 channels (NIR+RGB) and 11 fruits, building upon their previous study that presented 7 fruits for detection. The dataset includes blueberry, cherry, kiwi, and wheat, and while the total number of images is relatively small compared to other publicly available datasets, it can still be useful for pre-training models for downstream tasks. Each image contains multiple instances of fruits, as they typically form clusters. Moreover, each fruit image was taken from various camera views, scales, and lighting conditions, facilitating model generalization.
The dataset was split following an 8:1:1 rule for train/validation/test, and the final object detection results were reported using the test set. The authors also addressed errors in their previous dataset, except for the wheat dataset, which was obtained from a machine learning competition. They provide detailed experiment results and dataset samples in the following experiments section of the paper.
Please note, that the authors provided for public download images in .jpg format which doesn’t support the 4th channel (NIR).
Summary #
deepNIR: Dataset for Generating Synthetic near-infrared (NIR) Images and Improved Fruit Detection System Using Deep Learning Techniques is a dataset for object detection and unsupervised learning tasks. It is used in the agricultural industry.
The dataset consists of 4295 images with 161979 labeled objects belonging to 11 different classes including wheat, mango, cherry, and other: kiwi, capsicum, blueberry, apple, rockmelon, orange, avocado, and strawberry.
Images in the deepNIR Fruit Detection dataset have bounding box annotations. There is 1 unlabeled image (i.e. without annotations). There are 3 splits in the dataset: train (3434 images), test (431 images), and valid (430 images). The dataset was released in 2022 by the CSIRO Data61, Australia and CARES, University of Auckland, Australia.
Here are the visualized examples for the classes:
Explore #
deepNIR Fruit Detection dataset has 4295 images. Click on one of the examples below or open "Explore" tool anytime you need to view dataset images with annotations. This tool has extended visualization capabilities like zoom, translation, objects table, custom filters and more. Hover the mouse over the images to hide or show annotations.





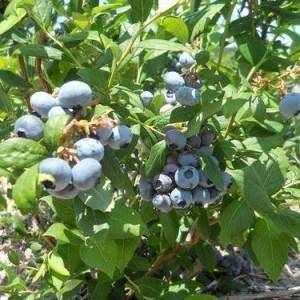

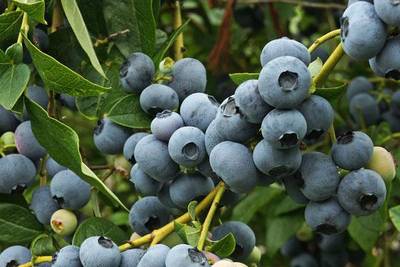

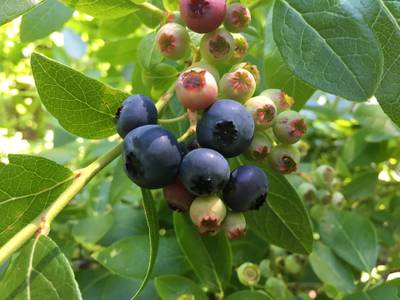



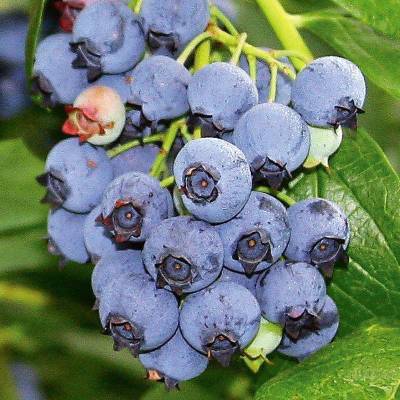


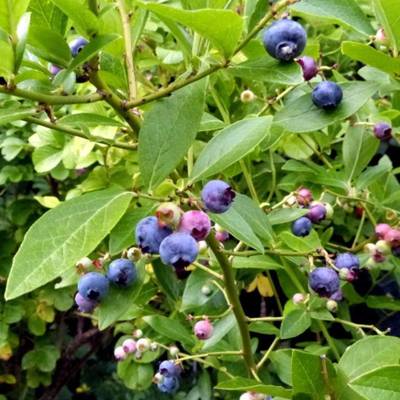

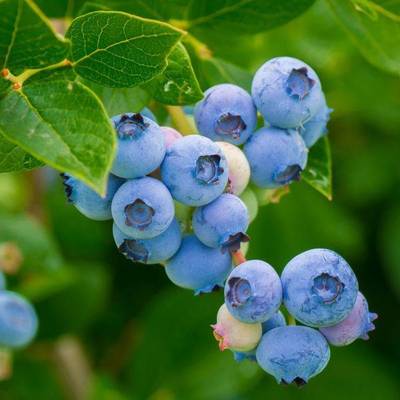

















Class balance #
There are 11 annotation classes in the dataset. Find the general statistics and balances for every class in the table below. Click any row to preview images that have labels of the selected class. Sort by column to find the most rare or prevalent classes.
Class ㅤ | Images ㅤ | Objects ㅤ | Count on image average | Area on image average |
|---|---|---|---|---|
wheat➔ rectangle | 3373 | 147793 | 43.82 | 26.83% |
mango➔ rectangle | 170 | 1145 | 6.74 | 14.68% |
cherry➔ rectangle | 153 | 4137 | 27.04 | 30.87% |
kiwi➔ rectangle | 125 | 3716 | 29.73 | 38.6% |
capsicum➔ rectangle | 122 | 724 | 5.93 | 8.28% |
blueberry➔ rectangle | 78 | 3176 | 40.72 | 37.68% |
apple➔ rectangle | 63 | 354 | 5.62 | 34.54% |
rockmelon➔ rectangle | 58 | 141 | 2.43 | 8.33% |
orange➔ rectangle | 57 | 274 | 4.81 | 22.52% |
avocado➔ rectangle | 54 | 178 | 3.3 | 25.19% |
Co-occurrence matrix #
Co-occurrence matrix is an extremely valuable tool that shows you the images for every pair of classes: how many images have objects of both classes at the same time. If you click any cell, you will see those images. We added the tooltip with an explanation for every cell for your convenience, just hover the mouse over a cell to preview the description.
Images #
Explore every single image in the dataset with respect to the number of annotations of each class it has. Click a row to preview selected image. Sort by any column to find anomalies and edge cases. Use horizontal scroll if the table has many columns for a large number of classes in the dataset.
Class sizes #
The table below gives various size properties of objects for every class. Click a row to see the image with annotations of the selected class. Sort columns to find classes with the smallest or largest objects or understand the size differences between classes.
Class | Object count | Avg area | Max area | Min area | Min height | Min height | Max height | Max height | Avg height | Avg height | Min width | Min width | Max width | Max width |
|---|---|---|---|---|---|---|---|---|---|---|---|---|---|---|
wheat rectangle | 147793 | 0.67% | 50.66% | 0% | 1px | 0.1% | 715px | 69.82% | 78px | 7.61% | 1px | 0.1% | 987px | 96.39% |
cherry rectangle | 4137 | 1.38% | 18.93% | 0.03% | 11px | 1.22% | 885px | 58.93% | 74px | 11.29% | 10px | 1.28% | 838px | 45.63% |
kiwi rectangle | 3716 | 1.62% | 38.37% | 0.01% | 8px | 1.15% | 2156px | 100% | 74px | 12.86% | 7px | 0.89% | 2088px | 47.46% |
blueberry rectangle | 3176 | 1.26% | 14.47% | 0.01% | 2px | 0.25% | 1056px | 42.25% | 70px | 10.22% | 7px | 1.56% | 947px | 39.49% |
mango rectangle | 1145 | 2.38% | 35.84% | 0.25% | 18px | 4.07% | 1116px | 74.4% | 69px | 15.56% | 16px | 3.8% | 843px | 63.72% |
capsicum rectangle | 724 | 1.47% | 4.64% | 0.19% | 52px | 5.42% | 308px | 32.08% | 139px | 14.49% | 41px | 3.2% | 277px | 21.64% |
apple rectangle | 354 | 6.79% | 29.65% | 0.53% | 36px | 8% | 532px | 63.43% | 169px | 27.71% | 35px | 5.82% | 618px | 60.35% |
strawberry rectangle | 341 | 3.5% | 22.87% | 0.27% | 28px | 6.25% | 518px | 64.32% | 137px | 20.86% | 23px | 3.82% | 562px | 44.11% |
orange rectangle | 274 | 5% | 50.43% | 0.29% | 21px | 5.32% | 391px | 81.33% | 103px | 19.92% | 26px | 5.2% | 366px | 71.6% |
avocado rectangle | 178 | 8.12% | 49.53% | 0.39% | 28px | 7.5% | 880px | 82.88% | 133px | 28.44% | 23px | 5% | 629px | 66.4% |
Spatial Heatmap #
The heatmaps below give the spatial distributions of all objects for every class. These visualizations provide insights into the most probable and rare object locations on the image. It helps analyze objects' placements in a dataset.

Objects #
Table contains all 161979 objects. Click a row to preview an image with annotations, and use search or pagination to navigate. Sort columns to find outliers in the dataset.
Object ID ㅤ | Class ㅤ | Image name click row to open | Image size height x width | Height ㅤ | Height ㅤ | Width ㅤ | Width ㅤ | Area ㅤ |
|---|---|---|---|---|---|---|---|---|
1➔ | wheat rectangle | f15aa967e_jpg.rf.d61b542a815435d11687ec1c59fded69.jpg | 1024 x 1024 | 131px | 12.79% | 112px | 10.94% | 1.4% |
2➔ | wheat rectangle | f15aa967e_jpg.rf.d61b542a815435d11687ec1c59fded69.jpg | 1024 x 1024 | 136px | 13.28% | 143px | 13.96% | 1.85% |
3➔ | wheat rectangle | f15aa967e_jpg.rf.d61b542a815435d11687ec1c59fded69.jpg | 1024 x 1024 | 83px | 8.11% | 158px | 15.43% | 1.25% |
4➔ | wheat rectangle | f15aa967e_jpg.rf.d61b542a815435d11687ec1c59fded69.jpg | 1024 x 1024 | 139px | 13.57% | 160px | 15.62% | 2.12% |
5➔ | wheat rectangle | f15aa967e_jpg.rf.d61b542a815435d11687ec1c59fded69.jpg | 1024 x 1024 | 29px | 2.83% | 170px | 16.6% | 0.47% |
6➔ | wheat rectangle | f15aa967e_jpg.rf.d61b542a815435d11687ec1c59fded69.jpg | 1024 x 1024 | 95px | 9.28% | 129px | 12.6% | 1.17% |
7➔ | wheat rectangle | f15aa967e_jpg.rf.d61b542a815435d11687ec1c59fded69.jpg | 1024 x 1024 | 116px | 11.33% | 126px | 12.3% | 1.39% |
8➔ | wheat rectangle | f15aa967e_jpg.rf.d61b542a815435d11687ec1c59fded69.jpg | 1024 x 1024 | 130px | 12.7% | 117px | 11.43% | 1.45% |
9➔ | wheat rectangle | f15aa967e_jpg.rf.d61b542a815435d11687ec1c59fded69.jpg | 1024 x 1024 | 118px | 11.52% | 155px | 15.14% | 1.74% |
10➔ | wheat rectangle | f15aa967e_jpg.rf.d61b542a815435d11687ec1c59fded69.jpg | 1024 x 1024 | 97px | 9.47% | 53px | 5.18% | 0.49% |
License #
Citation #
If you make use of the deepNIR data, please cite the following reference:
@dataset{inkyu_sa_2022_6324489,
  author       = {Inkyu Sa and
                  Jong Yoon Lim and
                  Ho Seok Ahn},
  title        = {{deepNIR: Dataset for generating synthetic NIR
                   images and improved fruit detection system using
                   deep learning techniques}},
  month        = mar,
  year         = 2022,
  publisher    = {Zenodo},
  version      = {0.1},
  doi          = {10.5281/zenodo.6324489},
  url          = {https://doi.org/10.5281/zenodo.6324489}
}
If you are happy with Dataset Ninja and use provided visualizations and tools in your work, please cite us:
@misc{ visualization-tools-for-deep-nir-fruit-dataset,
  title = { Visualization Tools for deepNIR Fruit Detection Dataset },
  type = { Computer Vision Tools },
  author = { Dataset Ninja },
  howpublished = { \url{ https://datasetninja.com/deep-nir-fruit } },
  url = { https://datasetninja.com/deep-nir-fruit },
  journal = { Dataset Ninja },
  publisher = { Dataset Ninja },
  year = { 2026 },
  month = { feb },
  note = { visited on 2026-02-12 },
}
Download #
Dataset deepNIR Fruit Detection can be downloaded in Supervisely format:
As an alternative, it can be downloaded with dataset-tools package:
pip install --upgrade dataset-tools
… using following python code:
import dataset_tools as dtools

dtools.download(dataset='deepNIR Fruit Detection', dst_dir='~/dataset-ninja/')
Make sure not to overlook the python code example available on the Supervisely Developer Portal. It will give you a clear idea of how to effortlessly work with the downloaded dataset.
The data in original format can be downloaded here.
Disclaimer #
Our gal from the legal dep told us we need to post this:
Dataset Ninja provides visualizations and statistics for some datasets that can be found online and can be downloaded by general audience. Dataset Ninja is not a dataset hosting platform and can only be used for informational purposes. The platform does not claim any rights for the original content, including images, videos, annotations and descriptions. Joint publishing is prohibited.
You take full responsibility when you use datasets presented at Dataset Ninja, as well as other information, including visualizations and statistics we provide. You are in charge of compliance with any dataset license and all other permissions. You are required to navigate datasets homepage and make sure that you can use it. In case of any questions, get in touch with us at hello@datasetninja.com.


