Introduction #
The authors present DeepSportRadar Instance Segmentation Challenge v.2 Dataset, a comprehensive set comprising computer vision tasks, datasets, and benchmarks designed for automating sport comprehension. The primary aim of this dataset is to bridge the divide between academic research and real-world applications. In pursuit of this goal, the datasets include high-resolution raw images, camera parameters, and meticulously crafted annotations of superior quality. DeepSportradar currently addresses four demanding tasks pertaining to basketball:
- Ball 3D localization in calibrated scenes. This task tackles the estimation of ball size on basketball scenes given the oracle ball position.
- Camera calibration. This task aims at predicting the camera calibration parameters from images taken from basketball games.
- Player instance segmentation. This task deals with the segmentation of individual humans (players, coaches and referees) on the basketball court.
- Player re-identification. In this task, the objective is to re-identify basketball players across multiple video frames captured from the same camera viewpoint at various time instants.
Note: the presented information on DatasetNinja is related to the instance segmentation task, but you can always refer to the original data
Motivation
Individual and professional sports have long wielded significant influence over the economic, political, and cultural fabric of society. In terms of economics alone, this impact is poised for expansion, with the global sports market, encompassing services and goods offered by sports entities, projected to surge from $354.96 billion in 2021 to a staggering $707.84 billion in 2026. The online live-streaming sector, in particular, is forecasted to witness remarkable growth, with its value skyrocketing from $18.12 billion in 2020 to $87.34 billion in 2028. A driving force behind this growth trajectory is the rapid advancement of technology, reshaping the landscape of sports consumption.
Indeed, advancements in Computer Vision (CV) and Deep Learning (DL) present the opportunity to extract rich insights from live-streamed sporting events, enhancing the viewing experience for audiences and leagues alike. However, the efficacy and reliability of DL-based solutions hinge heavily upon the quantity and quality of the training data. Each sporting discipline poses unique challenges for the models, and the quality of annotations significantly impacts overall performance.
In recent years, the SoccerNet datasets have garnered attention in the CV community for their extensive data and benchmark models. Nevertheless, two principal concerns mar this initiative: Firstly, restricting focus solely to soccer limits the generalizability of results across other sports domains. Secondly, and more critically, SoccerNet annotations are derived from broadcast videos, presenting several limitations. These include limited spatial and temporal coverage due to camera movements and interruptions by replays or advertisements, lower image resolution compared to the original sensor, lack of access to camera parameters or positioning data, and the presence of overlay graphics such as scores and advertisements, obstructing the view. In essence, annotations based on broadcast videos remain disconnected from the actual sensor and recording tools employed during the game, posing challenges for accurate analysis and interpretation.
Dataset description
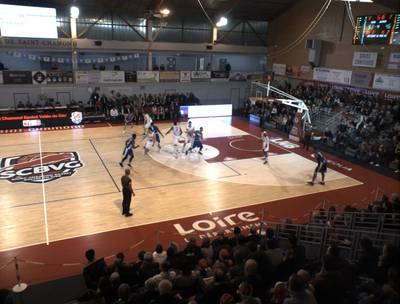
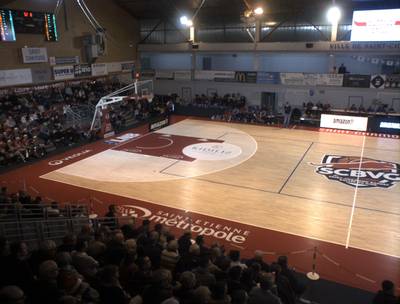
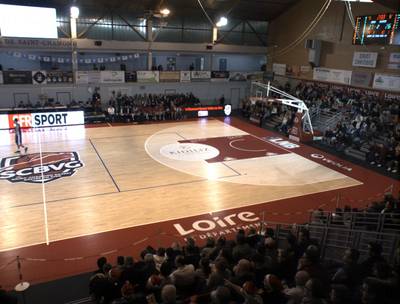
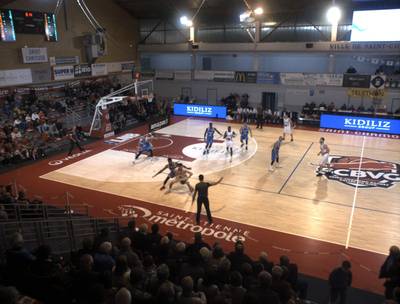
The dataset comprises raw-instants, which are sets of images simultaneously captured by an array of cameras, offering a panoramic view of the sports field. Specifically, it focuses solely on in-game basketball scenes. Within the DeepSport dataset, camera resolutions span from 2 megapixels (Mpx) to 5 megapixels (Mpx). Consequently, the resultant images exhibit varying levels of definition, ranging from 80 pixels per meter (px/m) to 150 px/m. This variability in image clarity is influenced by factors such as camera resolution, sensor size, lens focal length, and distance from the court.
A raw instant captured by the Keemotion/Synergy Automated Camera System with a two cameras setup.
The dataset was captured in 15 different basketball arenas, each identified by a unique label, during 37 professional games of the French league LNB-Pro A.
| Arena label | Arena name (City) | Number of items |
|---|---|---|
| ks-fr-stchamond | Halle André Boulloche (Saint-Chamond) | 12 |
| ks-fr-fos | HdS Parsemain (Fos-sur-Mer) | 23 |
| ks-fr-strasbourg | Rhénus Sport (Strasbourg) | 8 |
| ks-fr-vichy | PdS Pierre Coulon (Vichy) | 9 |
| ks-fr-nantes | la Trocardière (Nantes) | 20 |
| ks-fr-bourgeb | Ekinox (Bourg-en-Bresse) | 12 |
| ks-fr-gravelines | Sportica (Gravelines) | 129 |
| ks-fr-monaco | Salle Gaston Médecin (Monaco) | 9 |
| ks-fr-poitiers | Stade Poitevin (Poitiers) | 5 |
| ks-fr-nancy | PdS Jean Weille de Gentilly (Nancy) | 40 |
| ks-fr-lemans | Antarès (Le Mans) | 16 |
| ks-fr-blois | Le Jeu de Paume (Blois) | 39 |
| ks-fr-caen | PdS de Caen (Caen) | 31 |
| ks-fr-roanne | HdS Andre Vacheresse (Roanne) | 3 |
| ks-fr-limoges | PdS de Beaublanc (Limoges) | 8 |
The DeepSport dataset was captured in 15 different arenas and three of them are kept for the testing set. It features a variety of angle of views, distance to the court and image resolution.
The cameras employed for capturing the raw-instants are meticulously calibrated, ensuring that both intrinsic and extrinsic parameters are accurately determined. Leveraging this calibration data, the ball’s 3D annotation was acquired by pinpointing two key points in the image space: the center of the ball and its corresponding vertical projection onto the ground. Annotations for human figures positioned near the court were meticulously delineated in each image, with particular attention paid to instances of occlusion, ensuring comprehensive and precise contouring.
Cross section showing camera setup height from the ground and distance to the court of the different arenas in which images were acquired. The camera definition depends on camera resolution, sensor size, lens focal length and camera setup distance to the court.
The dataset possesses three crucial attributes that render it highly pertinent for exploring instance segmentation in challenging scenarios. Firstly, each instance exclusively pertains to a single class. This simplifies model training and analysis by eliminating inter-class interference and the need to average performance metrics across classes with varying frequencies. Secondly, despite the singular class representation, instances exhibit diverse appearances and poses, often proving difficult to separate from the background. Additionally, occurrences of occlusion are frequent, posing formidable challenges. The high degree of interaction among instances of the same class, sometimes resulting in fragmentation into disconnected parts, places significant strain on current instance segmentation methods. Thirdly, the provided instance masks are exceedingly precise, meticulously annotated through a semi-automated process. This dataset strikes a delicate balance, offering challenges for cutting-edge models while remaining practical for research and analysis.
Samples of annotated images from the instance segmentation task (cropped around annotated instances). Annotated instances are highlighted in distinct colors.
Summary #
DeepSportRadar Instance Segmentation Challenge v.2 Dataset is a dataset for instance segmentation, semantic segmentation, object detection, and identification tasks. It is used in the sports industry.
The dataset consists of 1456 images with 4104 labeled objects belonging to 2 different classes including human and ball.
Images in the DeepSportRadar dataset have pixel-level instance segmentation annotations. Due to the nature of the instance segmentation task, it can be automatically transformed into a semantic segmentation (only one mask for every class) or object detection (bounding boxes for every object) tasks. There are 842 (58% of the total) unlabeled images (i.e. without annotations). There are 3 splits in the dataset: train (1132 images), test (168 images), and val (156 images). Alternatively, the dataset could be split into 2 courts: camcourt 1 (728 images) and camcourt 2 (728 images), or into 15 arena labels: ks-fr-gravelines (516 images), ks-fr-nancy (160 images), ks-fr-blois (156 images), ks-fr-caen (124 images), ks-fr-fos (92 images), ks-fr-nantes (80 images), ks-fr-lemans (64 images), ks-fr-bourgeb (48 images), ks-fr-stchamond (48 images), ks-fr-monaco (36 images), ks-fr-vichy (36 images), ks-fr-limoges (32 images), ks-fr-strasbourg (32 images), ks-fr-poitiers (20 images), and ks-fr-roanne (12 images). Additionally, every image marked with its sequence, game id, league id and im id tags. The dataset was released in 2022 by the Sportradar AG, Switzerland.

Explore #
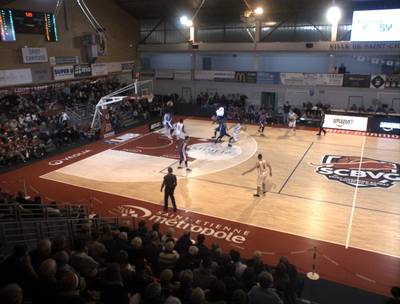
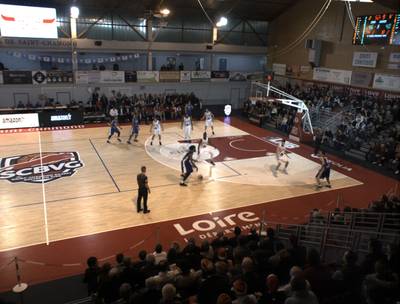
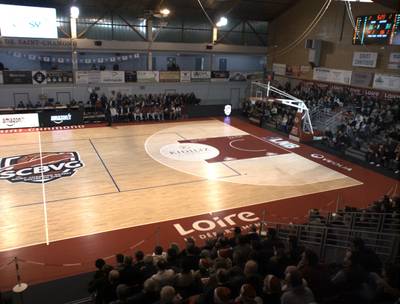
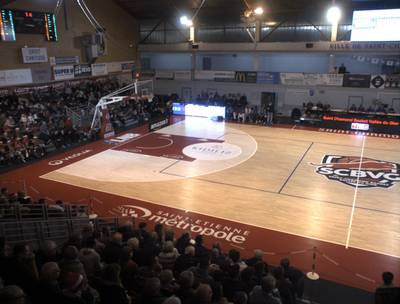
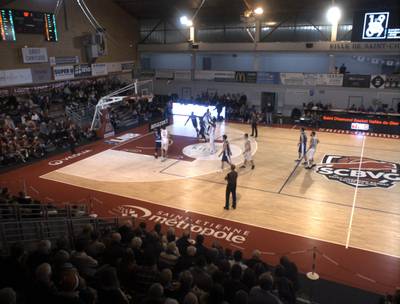
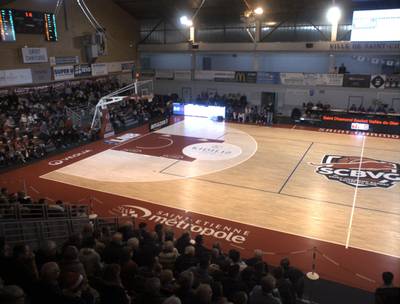
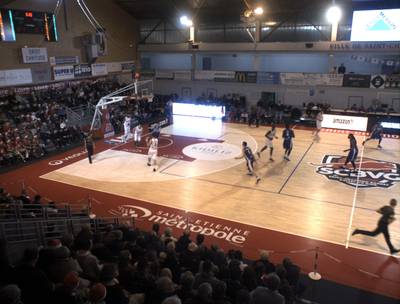
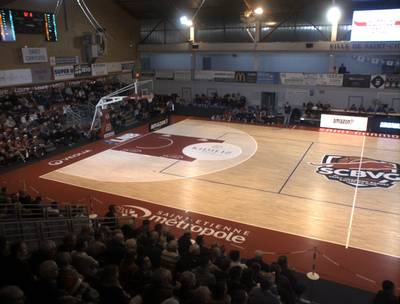
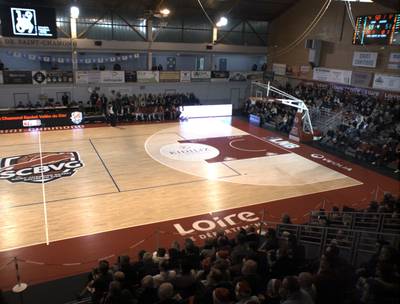
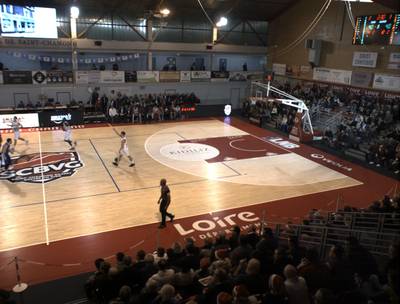
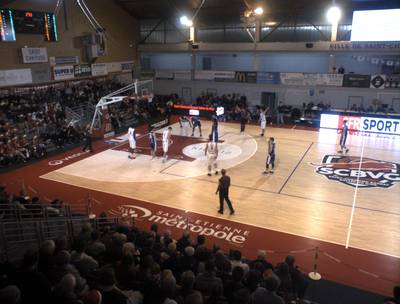
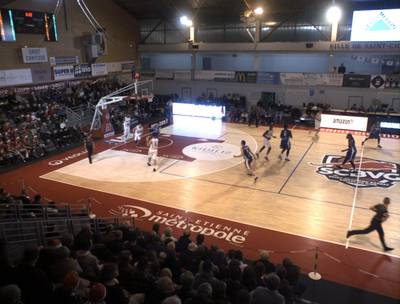
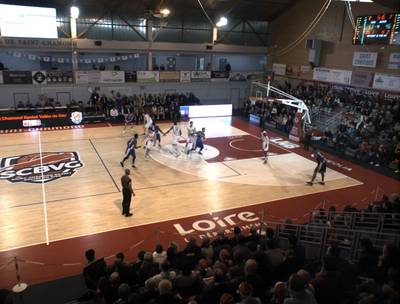
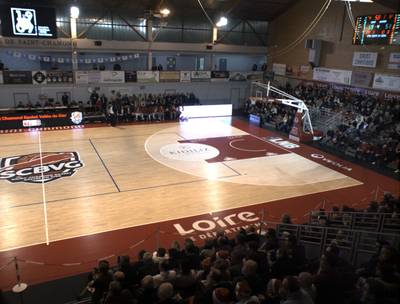
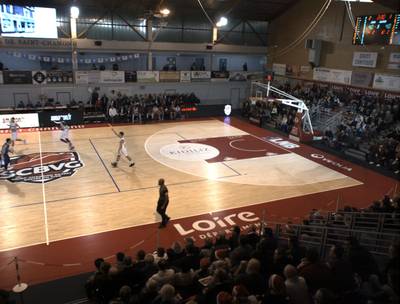
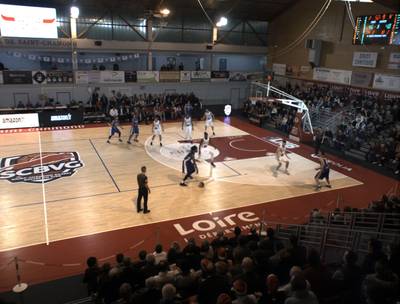
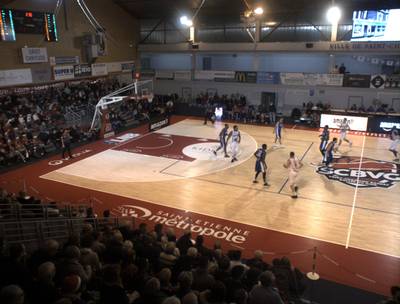
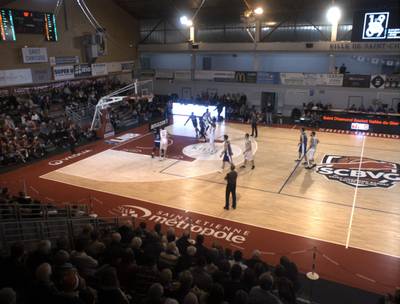
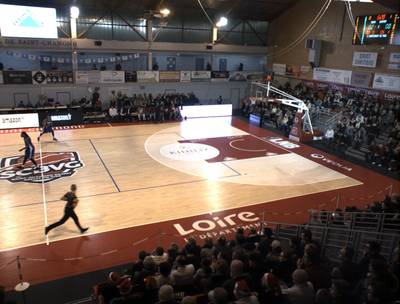
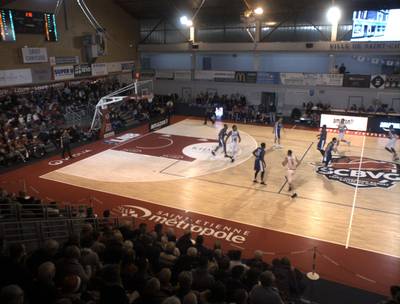
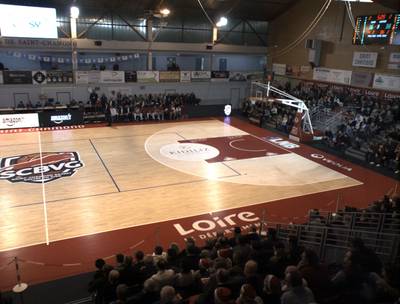
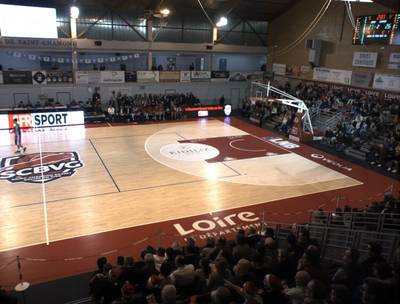
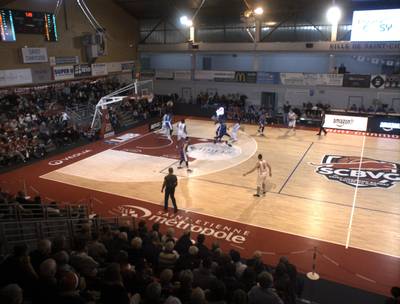
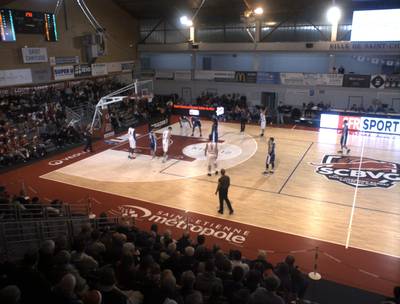
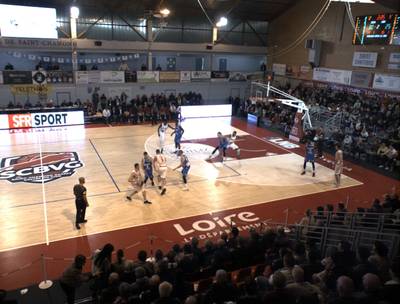
DeepSportRadar dataset has 1456 images. Click on one of the examples below or open "Explore" tool anytime you need to view dataset images with annotations. This tool has extended visualization capabilities like zoom, translation, objects table, custom filters and more. Hover the mouse over the images to hide or show annotations.






























Class balance #
There are 2 annotation classes in the dataset. Find the general statistics and balances for every class in the table below. Click any row to preview images that have labels of the selected class. Sort by column to find the most rare or prevalent classes.
Class ㅤ | Images ㅤ | Objects ㅤ | Count on image average | Area on image average |
|---|---|---|---|---|
human➔ mask | 614 | 3766 | 6.13 | 1.58% |
ball➔ mask | 338 | 338 | 1 | 0.01% |
Co-occurrence matrix #
Co-occurrence matrix is an extremely valuable tool that shows you the images for every pair of classes: how many images have objects of both classes at the same time. If you click any cell, you will see those images. We added the tooltip with an explanation for every cell for your convenience, just hover the mouse over a cell to preview the description.
Images #
Explore every single image in the dataset with respect to the number of annotations of each class it has. Click a row to preview selected image. Sort by any column to find anomalies and edge cases. Use horizontal scroll if the table has many columns for a large number of classes in the dataset.
Object distribution #
Interactive heatmap chart for every class with object distribution shows how many images are in the dataset with a certain number of objects of a specific class. Users can click cell and see the list of all corresponding images.
Class sizes #
The table below gives various size properties of objects for every class. Click a row to see the image with annotations of the selected class. Sort columns to find classes with the smallest or largest objects or understand the size differences between classes.
Class | Object count | Avg area | Max area | Min area | Min height | Min height | Max height | Max height | Avg height | Avg height | Min width | Min width | Max width | Max width |
|---|---|---|---|---|---|---|---|---|---|---|---|---|---|---|
human mask | 3766 | 0.26% | 2.34% | 0% | 6px | 0.29% | 998px | 48.59% | 201px | 12.63% | 4px | 0.17% | 376px | 19.7% |
ball mask | 338 | 0.01% | 0.03% | 0% | 3px | 0.17% | 44px | 2.34% | 23px | 1.42% | 3px | 0.13% | 47px | 1.91% |
Spatial Heatmap #
The heatmaps below give the spatial distributions of all objects for every class. These visualizations provide insights into the most probable and rare object locations on the image. It helps analyze objects' placements in a dataset.

Objects #
Table contains all 4104 objects. Click a row to preview an image with annotations, and use search or pagination to navigate. Sort columns to find outliers in the dataset.
Object ID ㅤ | Class ㅤ | Image name click row to open | Image size height x width | Height ㅤ | Height ㅤ | Width ㅤ | Width ㅤ | Area ㅤ |
|---|---|---|---|---|---|---|---|---|
1➔ | human mask | camcourt1_1513711952974_0.png | 1752 x 2336 | 182px | 10.39% | 86px | 3.68% | 0.18% |
2➔ | human mask | camcourt1_1513711952974_0.png | 1752 x 2336 | 163px | 9.3% | 68px | 2.91% | 0.12% |
3➔ | human mask | camcourt1_1513711952974_0.png | 1752 x 2336 | 341px | 19.46% | 124px | 5.31% | 0.41% |
4➔ | human mask | camcourt1_1513711952974_0.png | 1752 x 2336 | 208px | 11.87% | 72px | 3.08% | 0.2% |
5➔ | human mask | camcourt1_1513711952974_0.png | 1752 x 2336 | 308px | 17.58% | 136px | 5.82% | 0.4% |
6➔ | human mask | camcourt1_1513711952974_0.png | 1752 x 2336 | 242px | 13.81% | 70px | 3% | 0.22% |
7➔ | human mask | camcourt1_1513711952974_0.png | 1752 x 2336 | 234px | 13.36% | 80px | 3.42% | 0.22% |
8➔ | human mask | camcourt1_1513711952974_0.png | 1752 x 2336 | 254px | 14.5% | 153px | 6.55% | 0.3% |
9➔ | human mask | camcourt1_1513711952974_0.png | 1752 x 2336 | 253px | 14.44% | 130px | 5.57% | 0.29% |
10➔ | human mask | camcourt1_1513711952974_0.png | 1752 x 2336 | 221px | 12.61% | 123px | 5.27% | 0.23% |
License #
DeepSportRadar Instance Segmentation Challenge v.2 Dataset is under CC BY-NC-SA 4.0 license.
Citation #
If you make use of the DeepSportRadar data, please cite the following reference:
@inproceedings{Van_Zandycke_2022,
  author = {Gabriel Van Zandycke and Vladimir Somers and Maxime Istasse and Carlo Del Don and Davide Zambrano},
  title = {{DeepSportradar}-v1: Computer Vision Dataset for Sports Understanding with High Quality Annotations},
  booktitle = {Proceedings of the 5th International {ACM} Workshop on Multimedia Content Analysis in Sports},
  publisher = {{ACM}},
  year = 2022,
  month = {oct},
  doi = {10.1145/3552437.3555699},
  url = {https://doi.org/10.1145%2F3552437.3555699}
}
If you are happy with Dataset Ninja and use provided visualizations and tools in your work, please cite us:
@misc{ visualization-tools-for-deep-sport-radar-dataset,
  title = { Visualization Tools for DeepSportRadar Dataset },
  type = { Computer Vision Tools },
  author = { Dataset Ninja },
  howpublished = { \url{ https://datasetninja.com/deep-sport-radar } },
  url = { https://datasetninja.com/deep-sport-radar },
  journal = { Dataset Ninja },
  publisher = { Dataset Ninja },
  year = { 2026 },
  month = { feb },
  note = { visited on 2026-02-05 },
}
Download #
Dataset DeepSportRadar can be downloaded in Supervisely format:
As an alternative, it can be downloaded with dataset-tools package:
pip install --upgrade dataset-tools
… using following python code:
import dataset_tools as dtools

dtools.download(dataset='DeepSportRadar', dst_dir='~/dataset-ninja/')
Make sure not to overlook the python code example available on the Supervisely Developer Portal. It will give you a clear idea of how to effortlessly work with the downloaded dataset.
The data in original format can be downloaded here.
Disclaimer #
Our gal from the legal dep told us we need to post this:
Dataset Ninja provides visualizations and statistics for some datasets that can be found online and can be downloaded by general audience. Dataset Ninja is not a dataset hosting platform and can only be used for informational purposes. The platform does not claim any rights for the original content, including images, videos, annotations and descriptions. Joint publishing is prohibited.
You take full responsibility when you use datasets presented at Dataset Ninja, as well as other information, including visualizations and statistics we provide. You are in charge of compliance with any dataset license and all other permissions. You are required to navigate datasets homepage and make sure that you can use it. In case of any questions, get in touch with us at hello@datasetninja.com.


