

Introduction #
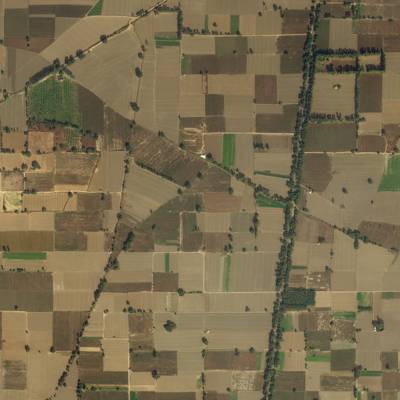
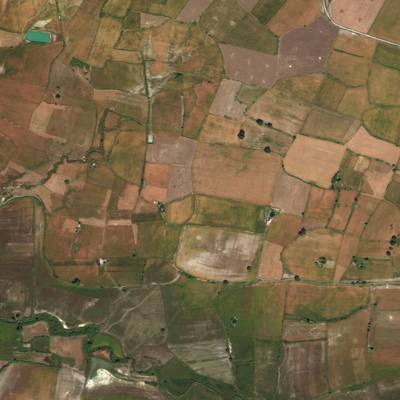
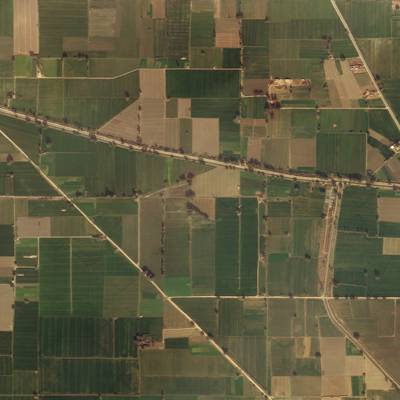
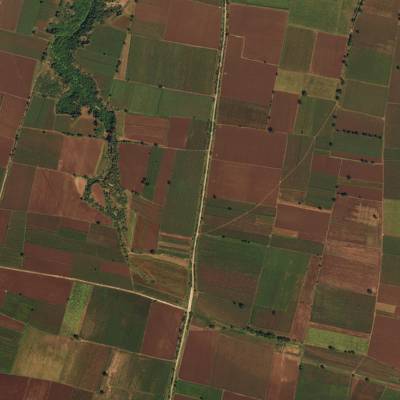
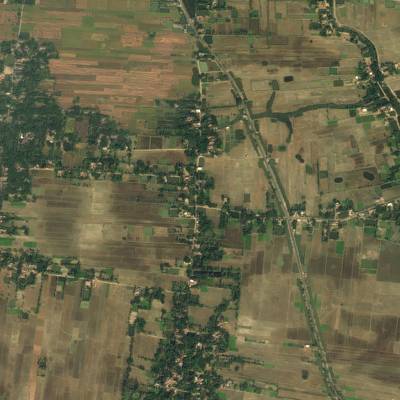
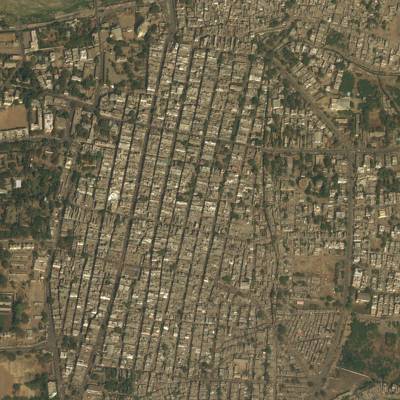
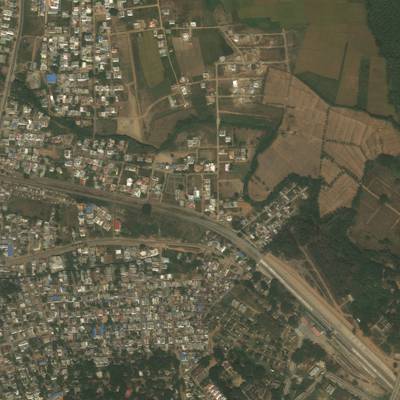
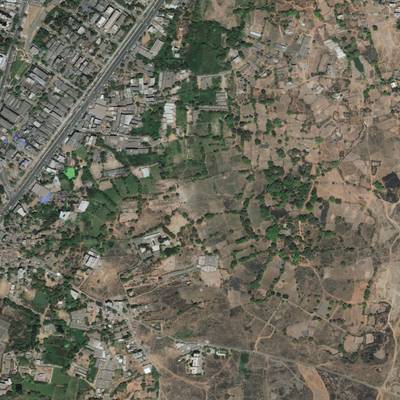
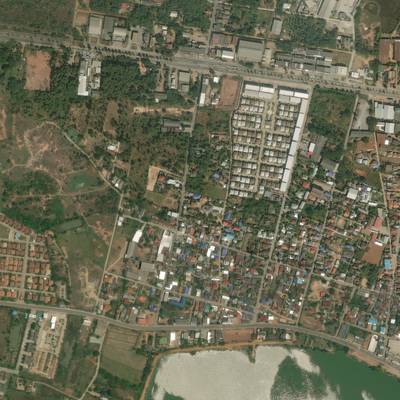
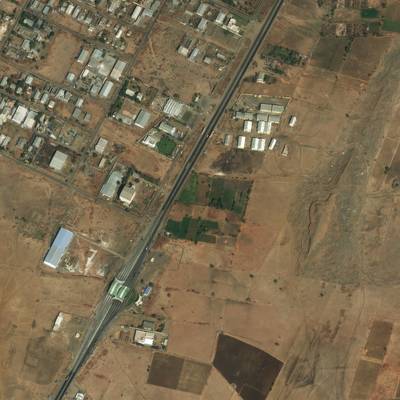
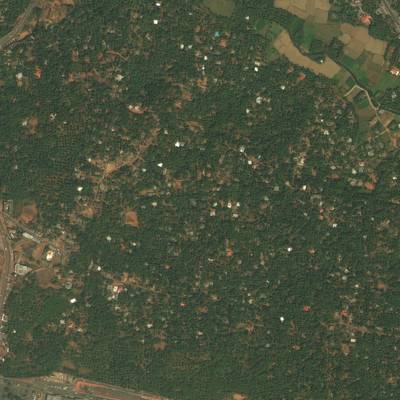
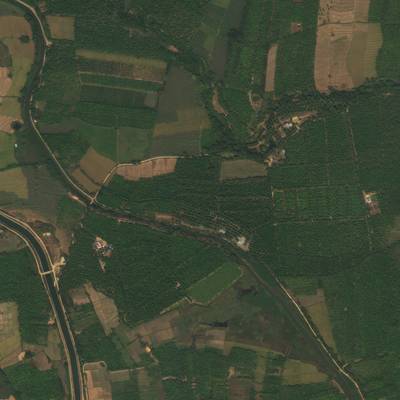
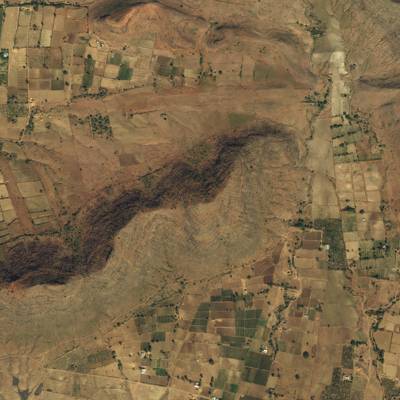
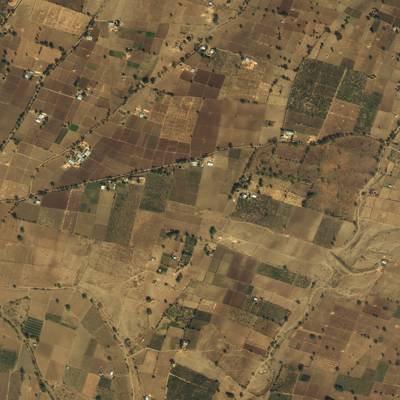
The authors introduce DeepGlobe Land Cover Classification Dataset 2018 Challenge, a comprehensive collection of high-resolution sub-meter satellite imagery focusing on rural areas. This dataset includes 1,146 satellite images of size 2,448x2,448 pixels, split into train, valid, and test sets. The images encompass RGB data with a pixel resolution of 50 cm, sourced from the DigitalGlobe Vivid+ dataset. Pixel-wise segmentation masks were created by professional annotators to represent different land cover classes. The total area size of the dataset is equivalent to 1716.9 km²
It is noted that satellite imagery, a source of rich and structured information, has been less explored in computer vision research compared to everyday images. However, the authors emphasize the potential impact of connecting computer vision with remote sensing data analysis, particularly in areas like global urban planning and climate change research. With this objective in mind, the DeepGlobe initiative is introduced to foster collaboration between researchers from diverse domains and raise awareness of remote sensing within the computer vision community. The goal is to enhance and assess state-of-the-art approaches for understanding satellite images, which could serve as benchmark references for future research in the field.
Highlighting the distinct characteristics of satellite imagery, the authors stress its potential for applications such as map composition, population analysis, precision agriculture, and autonomous driving. The DeepGlobe project defines three tracks to address specific challenges:
- Road Extraction Challenge (available on DatasetNinja): This challenge focuses on automating the extraction of road and street networks from satellite images, particularly in disaster zones and developing countries. The aim is to facilitate automated crisis response and expand map coverage for improved connectivity.
- Building Detection Challenge: With a focus on modelling urban demographics for disaster response and recovery, this challenge involves the automatic detection of buildings from satellite images. This facilitates the remote gathering of urban information and spatial distribution details of urban settlements.
- Land Cover Classification Challenge (current): This challenge revolves around the automatic classification and segmentation of land cover types from satellite images. It is crucial for sustainable development, agriculture, forestry, and urban planning.
Here is the description of the classes:
- urban_land: man-made, built up areas with human artifacts (can ignore roads for now which is hard to label).
- agriculture_land: farms, any planned (i.e. regular) plantation, cropland, orchards, vineyards, nurseries, and ornamental horticultural areas; confined feeding operations.
- rangeland: any non-forest, non-farm, green land, grass.
- forest_land: any land with x% tree crown density plus clearcuts.
- water: rivers, oceans, lakes, wetland, ponds.
- barren_land: mountain, land, rock, dessert, beach, no vegetation.
- unknown: clouds and others.
The authors emphasize that the dataset offers significant challenges due to its diversity of land cover types and dense annotations. While they acknowledge that small human errors are inevitable in this exploratory task of pixel-wise classification, the dataset provides a substantial resource for advancing high-resolution satellite image understanding.
 Homepage
 Research Paper
Summary #
DeepGlobe Land Cover Classification Dataset 2018 Challenge is a dataset for a semantic segmentation task. It is used in the urban planning and environmental research. Possible applications of the dataset could be in the agricultural industry.
The dataset consists of 1146 images with 3042 labeled objects belonging to 7 different classes including agriculture_land, urban_land, rangeland, and other: water, barren_land, forest_land, and unknown.
Images in the DeepGlobe Land Cover 2018 dataset have pixel-level semantic segmentation annotations. There are 343 (30% of the total) unlabeled images (i.e. without annotations). There are 3 splits in the dataset: train (803 images), test (172 images), and valid (171 images). The dataset was released in 2018 by the DeepGlobe Satellite Challenge (CVPR 2018).
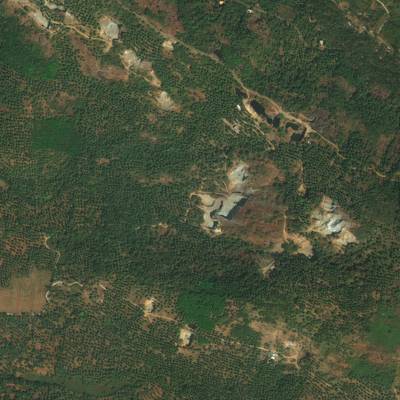
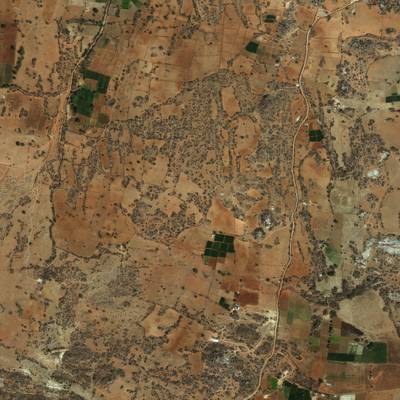
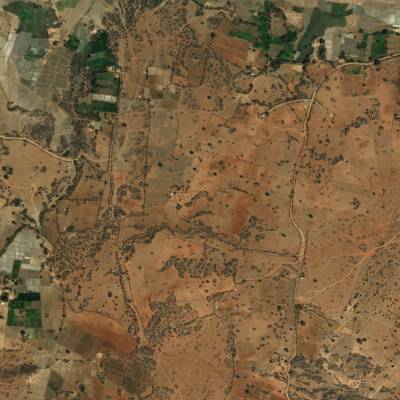
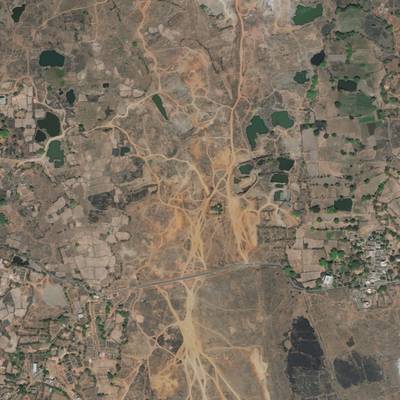
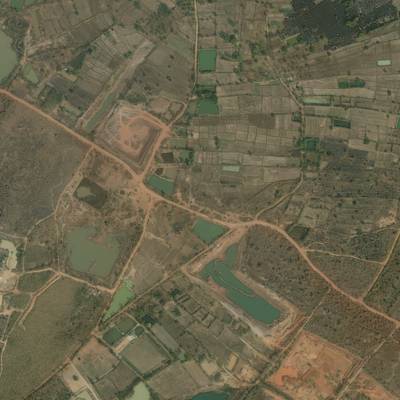
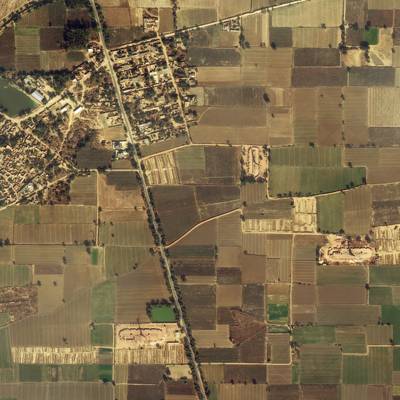
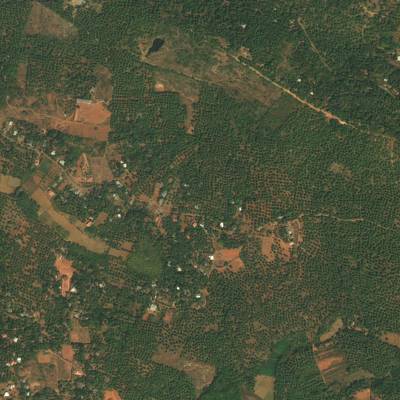
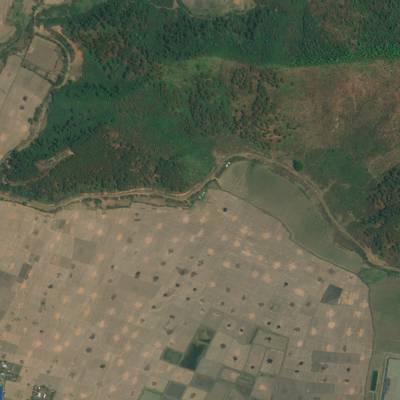
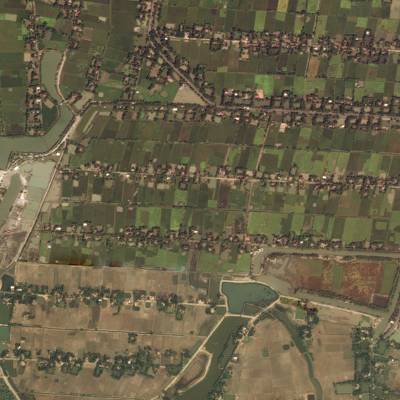
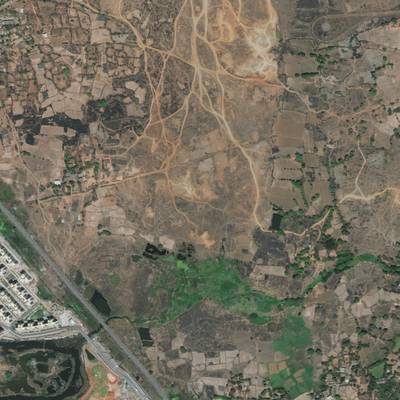
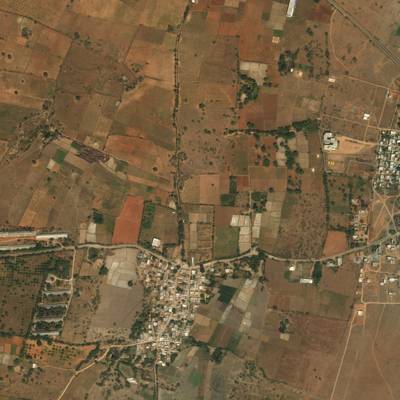
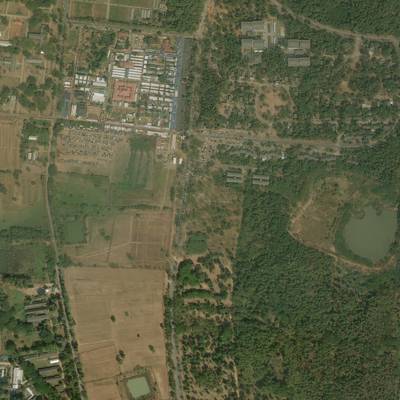
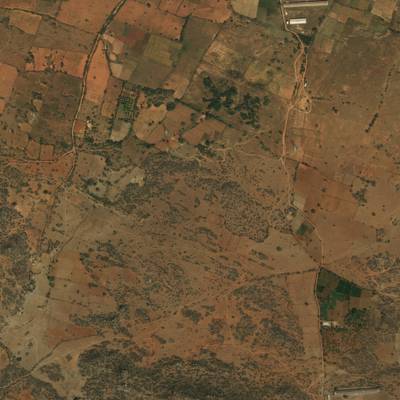
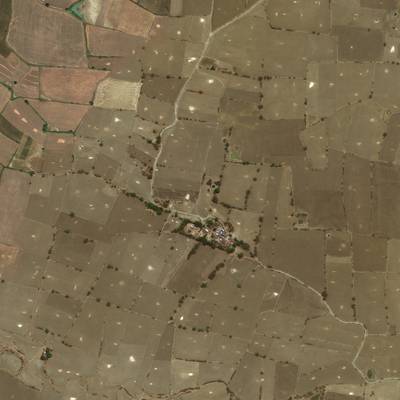
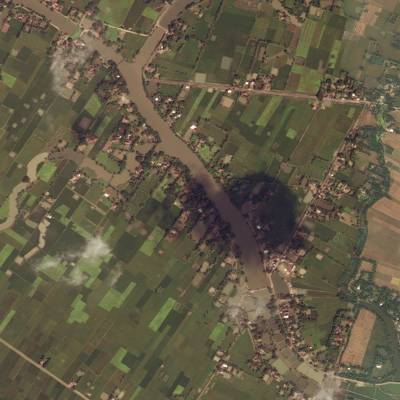
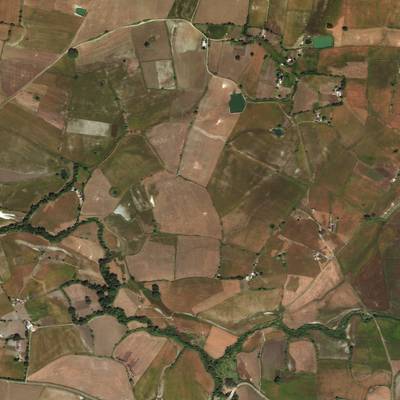
Here are the visualized examples for the classes:
Explore #
DeepGlobe Land Cover 2018 dataset has 1146 images. Click on one of the examples below or open "Explore" tool anytime you need to view dataset images with annotations. This tool has extended visualization capabilities like zoom, translation, objects table, custom filters and more. Hover the mouse over the images to hide or show annotations.


Class balance #
There are 7 annotation classes in the dataset. Find the general statistics and balances for every class in the table below. Click any row to preview images that have labels of the selected class. Sort by column to find the most rare or prevalent classes.

Class ㅤ | Images ㅤ | Objects ㅤ | Count on image average | Area on image average |
|---|---|---|---|---|
agriculture_land➔ mask | 722 | 722 | 1 | 64.21% |
urban_land➔ mask | 647 | 647 | 1 | 13.41% |
rangeland➔ mask | 521 | 521 | 1 | 13.08% |
water➔ mask | 477 | 477 | 1 | 5.58% |
barren_land➔ mask | 422 | 422 | 1 | 16.08% |
forest_land➔ mask | 191 | 191 | 1 | 46.93% |
unknown➔ mask | 62 | 62 | 1 | 0.66% |
Co-occurrence matrix #
Co-occurrence matrix is an extremely valuable tool that shows you the images for every pair of classes: how many images have objects of both classes at the same time. If you click any cell, you will see those images. We added the tooltip with an explanation for every cell for your convenience, just hover the mouse over a cell to preview the description.
Images #
Explore every single image in the dataset with respect to the number of annotations of each class it has. Click a row to preview selected image. Sort by any column to find anomalies and edge cases. Use horizontal scroll if the table has many columns for a large number of classes in the dataset.
Object distribution #
Interactive heatmap chart for every class with object distribution shows how many images are in the dataset with a certain number of objects of a specific class. Users can click cell and see the list of all corresponding images.
Class sizes #
The table below gives various size properties of objects for every class. Click a row to see the image with annotations of the selected class. Sort columns to find classes with the smallest or largest objects or understand the size differences between classes.
Class | Object count | Avg area | Max area | Min area | Min height | Min height | Max height | Max height | Avg height | Avg height | Min width | Min width | Max width | Max width |
|---|---|---|---|---|---|---|---|---|---|---|---|---|---|---|
agriculture_land mask | 722 | 64.21% | 100% | 0.05% | 96px | 3.92% | 2448px | 100% | 2275px | 92.92% | 42px | 1.72% | 2448px | 100% |
urban_land mask | 647 | 13.41% | 99.5% | 0% | 20px | 0.82% | 2448px | 100% | 1574px | 64.3% | 16px | 0.65% | 2448px | 100% |
rangeland mask | 521 | 13.08% | 93.56% | 0.01% | 40px | 1.63% | 2448px | 100% | 1833px | 74.88% | 19px | 0.78% | 2448px | 100% |
water mask | 477 | 5.58% | 88.8% | 0% | 10px | 0.41% | 2448px | 100% | 1309px | 53.48% | 5px | 0.2% | 2448px | 100% |
barren_land mask | 422 | 16.08% | 99.81% | 0% | 11px | 0.45% | 2448px | 100% | 1429px | 58.36% | 17px | 0.69% | 2448px | 100% |
forest_land mask | 191 | 46.93% | 100% | 0.01% | 41px | 1.67% | 2448px | 100% | 1930px | 78.82% | 42px | 1.72% | 2448px | 100% |
unknown mask | 62 | 0.66% | 10.82% | 0% | 5px | 0.2% | 2448px | 100% | 890px | 36.35% | 2px | 0.08% | 2448px | 100% |
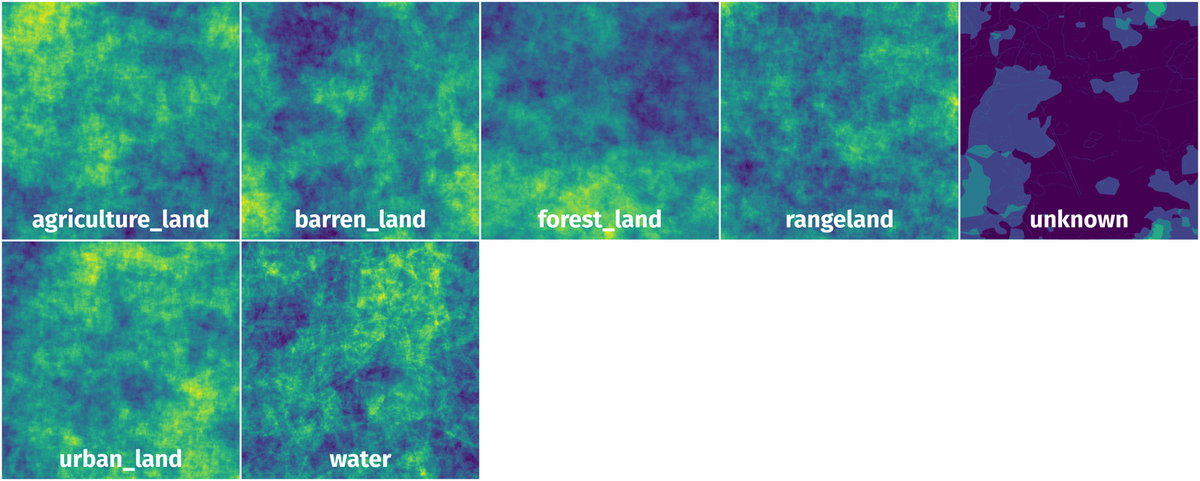
Spatial Heatmap #
The heatmaps below give the spatial distributions of all objects for every class. These visualizations provide insights into the most probable and rare object locations on the image. It helps analyze objects' placements in a dataset.
Objects #
Table contains all 3042 objects. Click a row to preview an image with annotations, and use search or pagination to navigate. Sort columns to find outliers in the dataset.
Object ID ㅤ | Class ㅤ | Image name click row to open | Image size height x width | Height ㅤ | Height ㅤ | Width ㅤ | Width ㅤ | Area ㅤ |
|---|---|---|---|---|---|---|---|---|
1➔ | urban_land mask | 458776_sat.jpg | 2448 x 2448 | 1170px | 47.79% | 2186px | 89.3% | 2.69% |
2➔ | agriculture_land mask | 458776_sat.jpg | 2448 x 2448 | 2448px | 100% | 2448px | 100% | 96.2% |
3➔ | rangeland mask | 458776_sat.jpg | 2448 x 2448 | 1298px | 53.02% | 1541px | 62.95% | 1.09% |
4➔ | water mask | 458776_sat.jpg | 2448 x 2448 | 10px | 0.41% | 80px | 3.27% | 0.01% |
5➔ | agriculture_land mask | 20187_sat.jpg | 2448 x 2448 | 2448px | 100% | 1608px | 65.69% | 50.14% |
6➔ | rangeland mask | 20187_sat.jpg | 2448 x 2448 | 1020px | 41.67% | 940px | 38.4% | 5.64% |
7➔ | forest_land mask | 20187_sat.jpg | 2448 x 2448 | 2448px | 100% | 1405px | 57.39% | 17.89% |
8➔ | barren_land mask | 20187_sat.jpg | 2448 x 2448 | 2374px | 96.98% | 1222px | 49.92% | 26.33% |
9➔ | agriculture_land mask | 245846_sat.jpg | 2448 x 2448 | 2448px | 100% | 2448px | 100% | 72.84% |
10➔ | water mask | 245846_sat.jpg | 2448 x 2448 | 683px | 27.9% | 2124px | 86.76% | 0.26% |
License #
The DeepGlobe Land Cover Classification Challenge and hence, the dataset are governed by DeepGlobe Rules, The DigitalGlobe's Internal Use License Agreement, and Annotation License Agreement.
Citation #
If you make use of the DeepGlobe 2018 data, please cite the following reference:
@InProceedings{DeepGlobe18,
    author = {Demir, Ilke and Koperski, Krzysztof and Lindenbaum, David and Pang, Guan and Huang, Jing and Basu, Saikat and Hughes, Forest and Tuia, Devis and Raskar, Ramesh},
    title = {DeepGlobe 2018: A Challenge to Parse the Earth Through Satellite Images},
    booktitle = {The IEEE Conference on Computer Vision and Pattern Recognition (CVPR) Workshops},
    month = {June},
    year = {2018}
}
If you are happy with Dataset Ninja and use provided visualizations and tools in your work, please cite us:
@misc{ visualization-tools-for-deepglobe-dataset,
  title = { Visualization Tools for DeepGlobe Land Cover 2018 Dataset },
  type = { Computer Vision Tools },
  author = { Dataset Ninja },
  howpublished = { \url{ https://datasetninja.com/deepglobe } },
  url = { https://datasetninja.com/deepglobe },
  journal = { Dataset Ninja },
  publisher = { Dataset Ninja },
  year = { 2026 },
  month = { jul },
  note = { visited on 2026-07-22 },
}
Download #
Dataset DeepGlobe Land Cover 2018 can be downloaded in Supervisely format:
As an alternative, it can be downloaded with dataset-tools package:
pip install --upgrade dataset-tools
… using following python code:
import dataset_tools as dtools

dtools.download(dataset='DeepGlobe Land Cover 2018', dst_dir='~/dataset-ninja/')
Make sure not to overlook the python code example available on the Supervisely Developer Portal. It will give you a clear idea of how to effortlessly work with the downloaded dataset.
The data in original format can be downloaded here.
Disclaimer #
Our gal from the legal dep told us we need to post this:
Dataset Ninja provides visualizations and statistics for some datasets that can be found online and can be downloaded by general audience. Dataset Ninja is not a dataset hosting platform and can only be used for informational purposes. The platform does not claim any rights for the original content, including images, videos, annotations and descriptions. Joint publishing is prohibited.
You take full responsibility when you use datasets presented at Dataset Ninja, as well as other information, including visualizations and statistics we provide. You are in charge of compliance with any dataset license and all other permissions. You are required to navigate datasets homepage and make sure that you can use it. In case of any questions, get in touch with us at hello@datasetninja.com.