

Introduction #
The authors of the DeepSeedling dataset emphasize the significance of plant population density in agricultural production systems, as it greatly influences crop yield and quality. They note that traditionally, estimating plant population density involves labor-intensive methods like field assessment or germination-test-based approaches, which can be prone to inaccuracies. Recent advancements in deep learning have opened up new possibilities for tackling complex computer vision tasks such as object detection. In this context, the authors set out to develop a deep-learning-based method for counting plant seedlings in field conditions.
Plant population density, crucial for agricultural production systems, is the measure of plant stands per unit area. The authors highlight its impact on crop yield potential and fruit quality, particularly during the critical seedling stage. They explain that current methods for estimating plant population density involve manually counting seedlings in randomly selected subareas of a field, with the average count used as a representation of the density.
The authors mention two common sampling methods: quadrat and plotless sampling, for counting seedlings within these subareas. They point out that while these methods are straightforward, they can be labor-intensive, especially for large fields, and may yield inaccurate results if not appropriately configured.
The proposed dataset is used for the evaluation of the model.
 Homepage
 Research Paper
 GitHub
Summary #
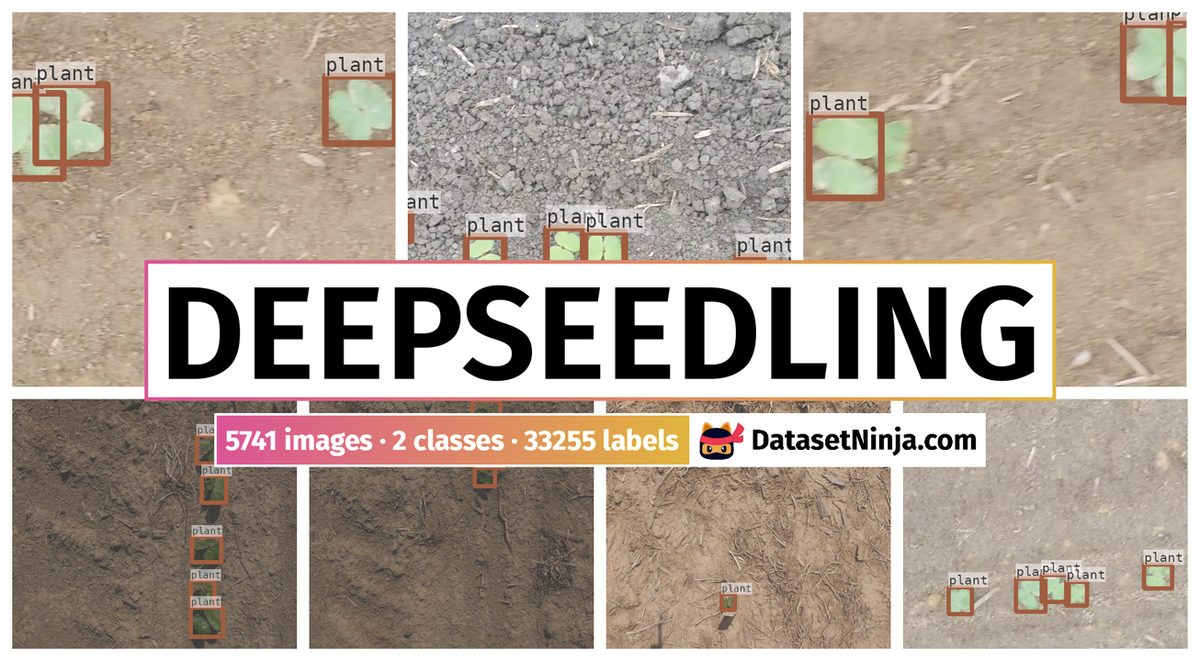
DeepSeedling: Deep Convolutional Network and Kalman Filter for Plant Seedling Detection and Counting in the Field is a dataset for an object detection task. It is used in the agricultural industry.
The dataset consists of 5741 images with 33255 labeled objects belonging to 2 different classes including plant and weed.
Images in the DeepSeedling dataset have bounding box annotations. There are 521 (9% of the total) unlabeled images (i.e. without annotations). There are 3 splits in the dataset: UGA2015 (2389 images), TAMU2015 (1821 images), and UGA2018 (1531 images). Additionally, images contain id of each category. The dataset was released in 2019 by the The University of Georgia, USA.
Explore #
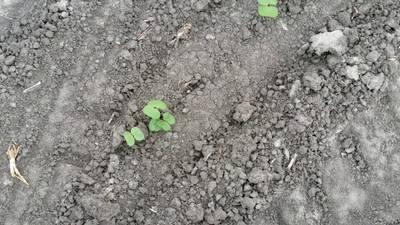
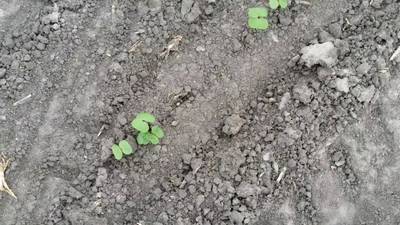
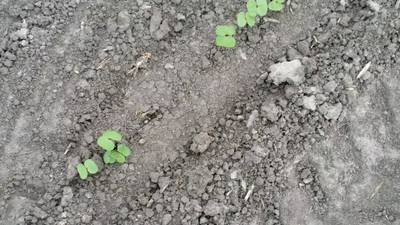
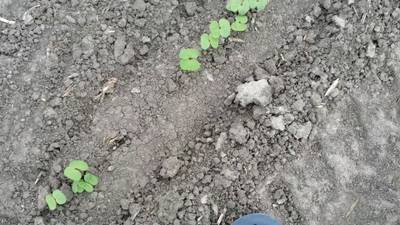
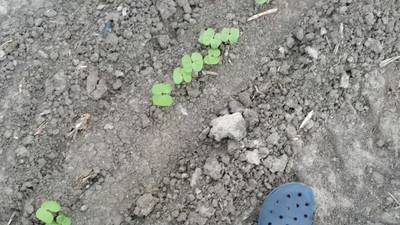
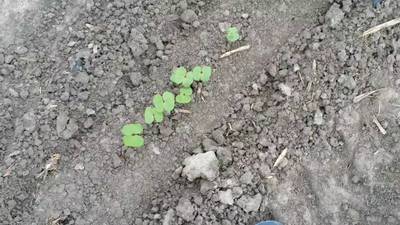
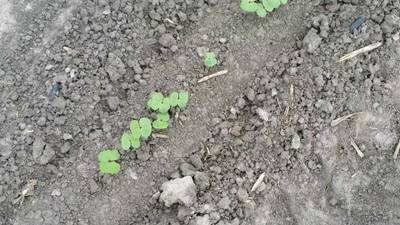
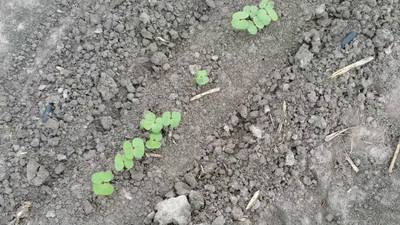
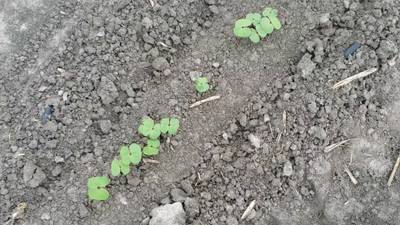
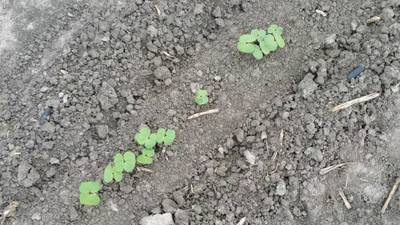
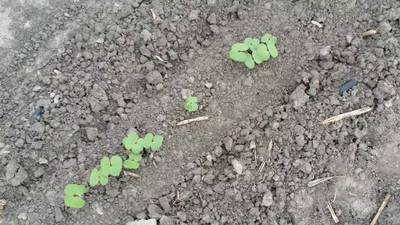
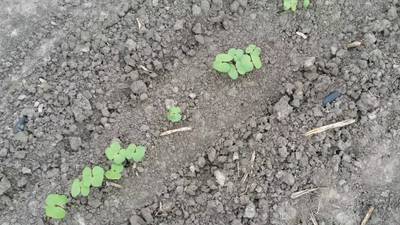
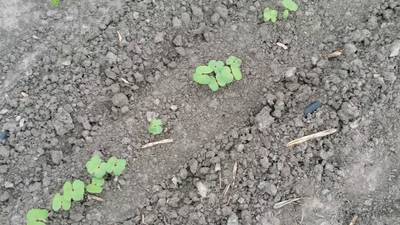
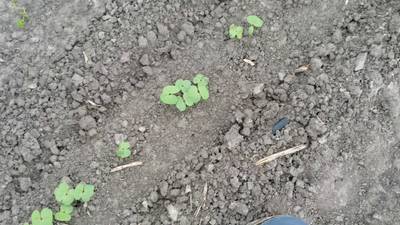
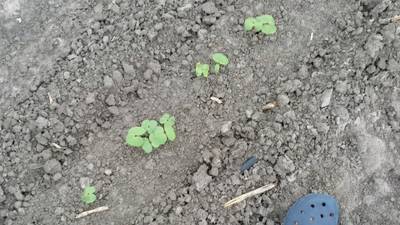
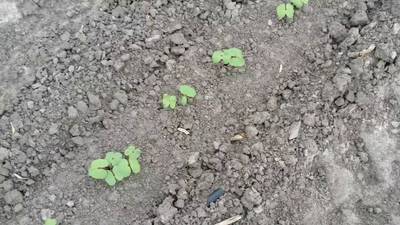
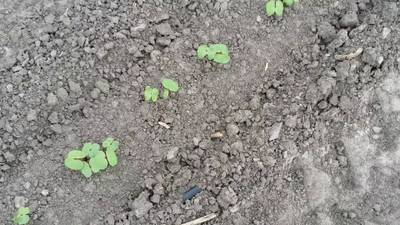
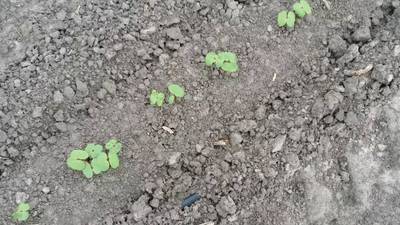
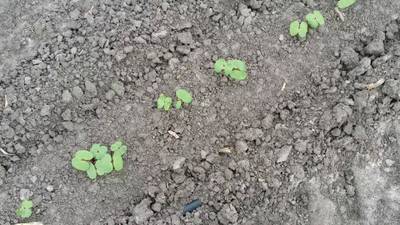
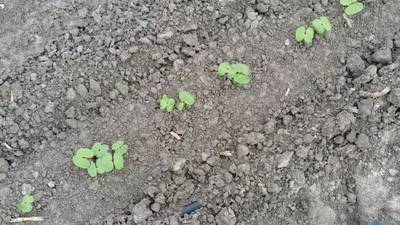
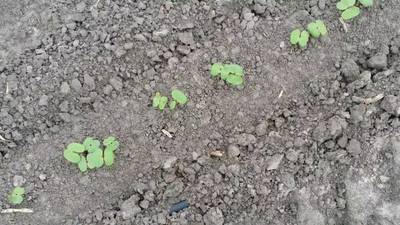
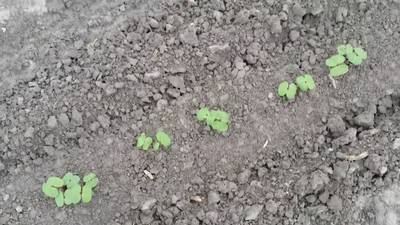
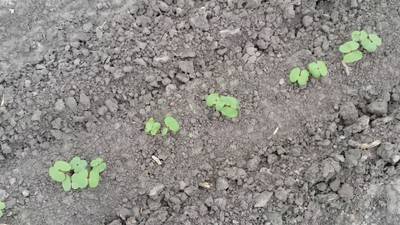
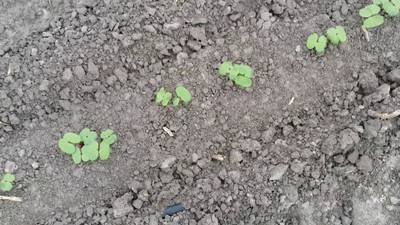
DeepSeedling dataset has 5741 images. Click on one of the examples below or open "Explore" tool anytime you need to view dataset images with annotations. This tool has extended visualization capabilities like zoom, translation, objects table, custom filters and more. Hover the mouse over the images to hide or show annotations.


Class balance #
There are 2 annotation classes in the dataset. Find the general statistics and balances for every class in the table below. Click any row to preview images that have labels of the selected class. Sort by column to find the most rare or prevalent classes.

Class ㅤ | Images ㅤ | Objects ㅤ | Count on image average | Area on image average |
|---|---|---|---|---|
plant➔ rectangle | 5145 | 31621 | 6.15 | 4.01% |
weed➔ rectangle | 952 | 1634 | 1.72 | 0.86% |
Co-occurrence matrix #
Co-occurrence matrix is an extremely valuable tool that shows you the images for every pair of classes: how many images have objects of both classes at the same time. If you click any cell, you will see those images. We added the tooltip with an explanation for every cell for your convenience, just hover the mouse over a cell to preview the description.
Images #
Explore every single image in the dataset with respect to the number of annotations of each class it has. Click a row to preview selected image. Sort by any column to find anomalies and edge cases. Use horizontal scroll if the table has many columns for a large number of classes in the dataset.
Object distribution #
Interactive heatmap chart for every class with object distribution shows how many images are in the dataset with a certain number of objects of a specific class. Users can click cell and see the list of all corresponding images.
Class sizes #
The table below gives various size properties of objects for every class. Click a row to see the image with annotations of the selected class. Sort columns to find classes with the smallest or largest objects or understand the size differences between classes.
Class | Object count | Avg area | Max area | Min area | Min height | Min height | Max height | Max height | Avg height | Avg height | Min width | Min width | Max width | Max width |
|---|---|---|---|---|---|---|---|---|---|---|---|---|---|---|
plant rectangle | 31621 | 0.7% | 7.73% | 0.01% | 5px | 0.46% | 435px | 40.28% | 110px | 10.22% | 2px | 0.1% | 422px | 21.98% |
weed rectangle | 1634 | 0.5% | 4.98% | 0% | 1px | 0.09% | 403px | 37.31% | 84px | 7.8% | 26px | 1.35% | 336px | 17.5% |
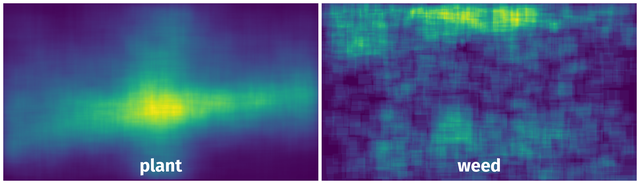
Spatial Heatmap #
The heatmaps below give the spatial distributions of all objects for every class. These visualizations provide insights into the most probable and rare object locations on the image. It helps analyze objects' placements in a dataset.
Objects #
Table contains all 33255 objects. Click a row to preview an image with annotations, and use search or pagination to navigate. Sort columns to find outliers in the dataset.
Object ID ㅤ | Class ㅤ | Image name click row to open | Image size height x width | Height ㅤ | Height ㅤ | Width ㅤ | Width ㅤ | Area ㅤ |
|---|---|---|---|---|---|---|---|---|
1➔ | plant rectangle | Frame10843.JPG | 1080 x 1920 | 112px | 10.37% | 111px | 5.78% | 0.6% |
2➔ | plant rectangle | Frame10843.JPG | 1080 x 1920 | 113px | 10.46% | 114px | 5.94% | 0.62% |
3➔ | plant rectangle | Frame10843.JPG | 1080 x 1920 | 100px | 9.26% | 105px | 5.47% | 0.51% |
4➔ | plant rectangle | Frame10843.JPG | 1080 x 1920 | 98px | 9.07% | 97px | 5.05% | 0.46% |
5➔ | plant rectangle | Frame10843.JPG | 1080 x 1920 | 72px | 6.67% | 65px | 3.39% | 0.23% |
6➔ | plant rectangle | Frame10843.JPG | 1080 x 1920 | 69px | 6.39% | 75px | 3.91% | 0.25% |
7➔ | plant rectangle | Frame10633.JPG | 1080 x 1920 | 108px | 10% | 113px | 5.89% | 0.59% |
8➔ | plant rectangle | Frame10633.JPG | 1080 x 1920 | 113px | 10.46% | 121px | 6.3% | 0.66% |
9➔ | plant rectangle | Frame10633.JPG | 1080 x 1920 | 114px | 10.56% | 119px | 6.2% | 0.65% |
10➔ | plant rectangle | Frame10633.JPG | 1080 x 1920 | 85px | 7.87% | 89px | 4.64% | 0.36% |
License #
DeepSeedling: Deep Convolutional Network and Kalman Filter for Plant Seedling Detection and Counting in the Field is under GNU GPL 3.0 license.
Citation #
If you make use of the DeepSeedling data, please cite the following reference:
@dataset{DeepSeedling,
  author={Yu Jiang and Changying Li and Andrew H. Paterson and Jon S. Robertson},
  title={DeepSeedling: Deep Convolutional Network and Kalman Filter for Plant Seedling Detection and Counting in the Field},
  year={2019},
  url={https://figshare.com/s/616956f8633c17ceae9b}
}
If you are happy with Dataset Ninja and use provided visualizations and tools in your work, please cite us:
@misc{ visualization-tools-for-deepseedling-dataset,
  title = { Visualization Tools for DeepSeedling Dataset },
  type = { Computer Vision Tools },
  author = { Dataset Ninja },
  howpublished = { \url{ https://datasetninja.com/deepseedling } },
  url = { https://datasetninja.com/deepseedling },
  journal = { Dataset Ninja },
  publisher = { Dataset Ninja },
  year = { 2026 },
  month = { jul },
  note = { visited on 2026-07-24 },
}
Download #
Dataset DeepSeedling can be downloaded in Supervisely format:
As an alternative, it can be downloaded with dataset-tools package:
pip install --upgrade dataset-tools
… using following python code:
import dataset_tools as dtools

dtools.download(dataset='DeepSeedling', dst_dir='~/dataset-ninja/')
Make sure not to overlook the python code example available on the Supervisely Developer Portal. It will give you a clear idea of how to effortlessly work with the downloaded dataset.
The data in original format can be downloaded here.
Disclaimer #
Our gal from the legal dep told us we need to post this:
Dataset Ninja provides visualizations and statistics for some datasets that can be found online and can be downloaded by general audience. Dataset Ninja is not a dataset hosting platform and can only be used for informational purposes. The platform does not claim any rights for the original content, including images, videos, annotations and descriptions. Joint publishing is prohibited.
You take full responsibility when you use datasets presented at Dataset Ninja, as well as other information, including visualizations and statistics we provide. You are in charge of compliance with any dataset license and all other permissions. You are required to navigate datasets homepage and make sure that you can use it. In case of any questions, get in touch with us at hello@datasetninja.com.