

Introduction #
The Defects in Power Distribution Components dataset is presented by the authors as a dataset comprising 708 images and corresponding labels of defects found in components within an electrical distribution system. In the context of their work, an electric system constitutes a complex infrastructure designed to supply power to various consumers, including residential, industrial, and railway facilities. Within an electrical distribution network, various components come into play, such as arresters, transformers, and cross arms, among others. These components are typically situated within power posts and are susceptible to faults stemming from routine operation, weather conditions, or acts of vandalism.
The high frequency of electric system failure is of considerable significance, as it can translate into substantial costs for maintaining a company of the power infrastructure. To mitigate the impact of these faults on consumers, the implementation of a contingency plan or, even better, preventing failures before they manifest becomes imperative.
One commonly adopted approach to prevent these failures involves visually inspecting the components of the distribution network. However, due to the extensive network of power posts and the numerous elements involved, human inspections are susceptible to errors. Consequently, automating this inspection process emerges as a promising solution to address these issues. Automation is often employed to identify visible defects, such as cracks, burns, and cable issues, using techniques like the inspection of images captured by drones. Nevertheless, using drones for inspection presents certain limitations, including potential degradation in image quality due to external variables like distance, balance, excessive vibration, or inadequate lighting conditions.
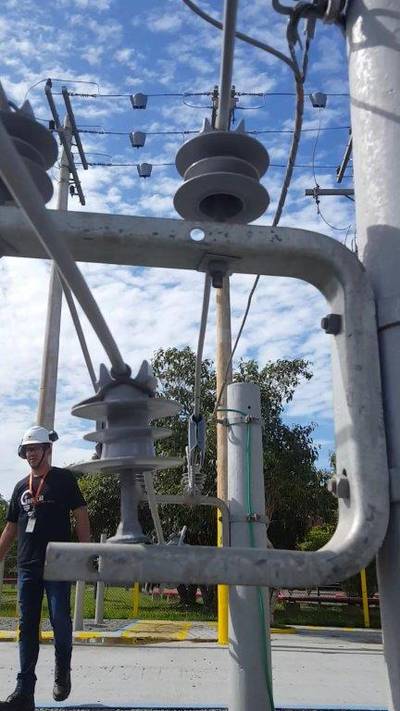
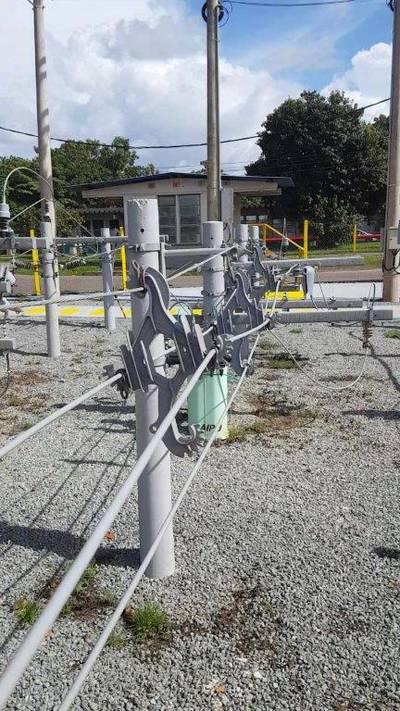
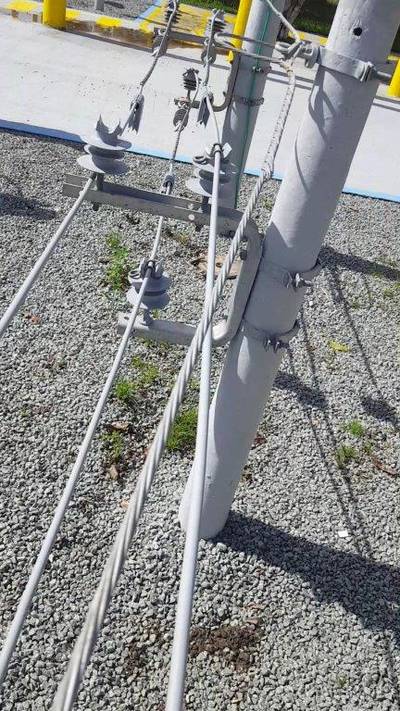
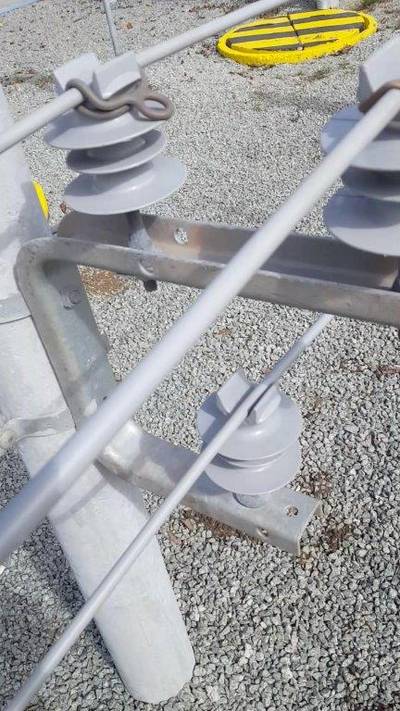
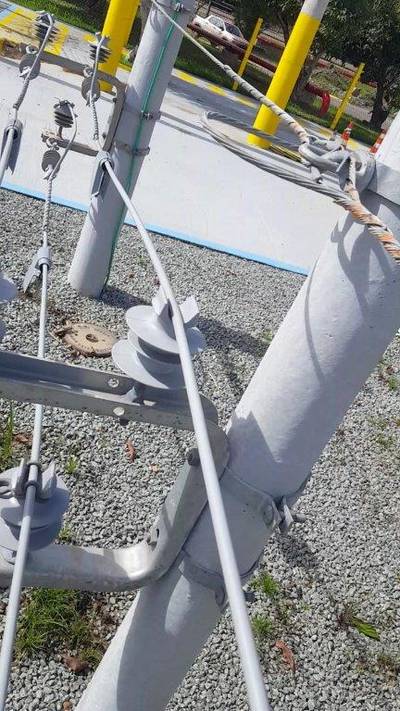
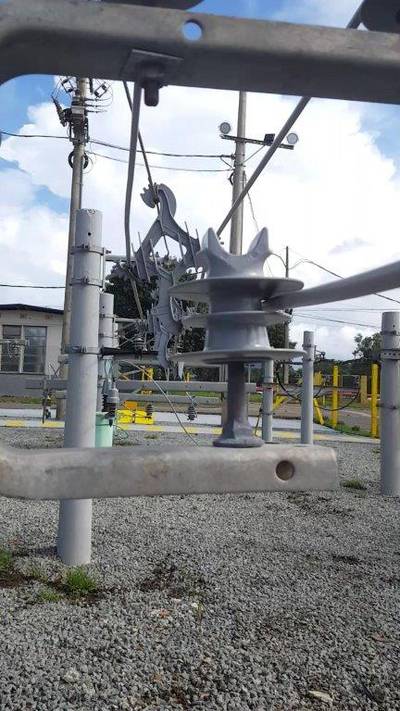
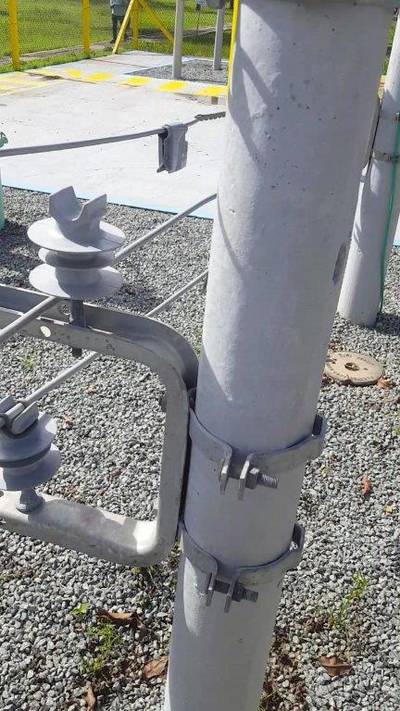
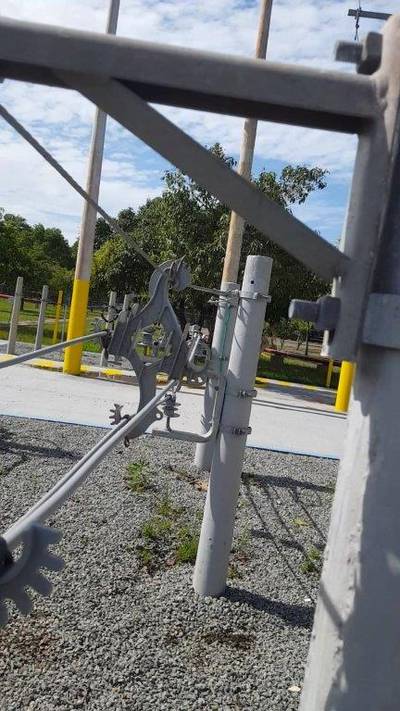
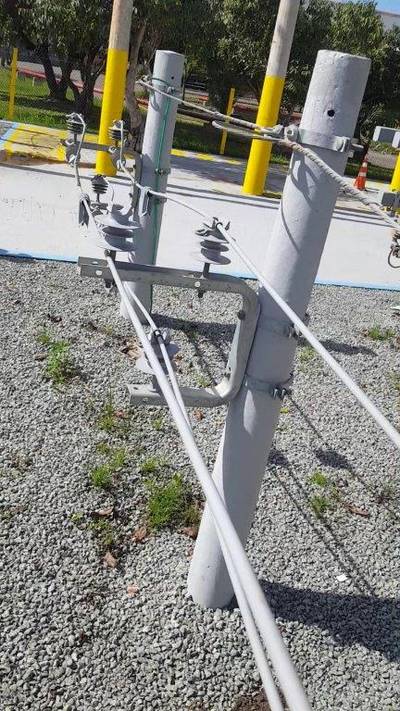
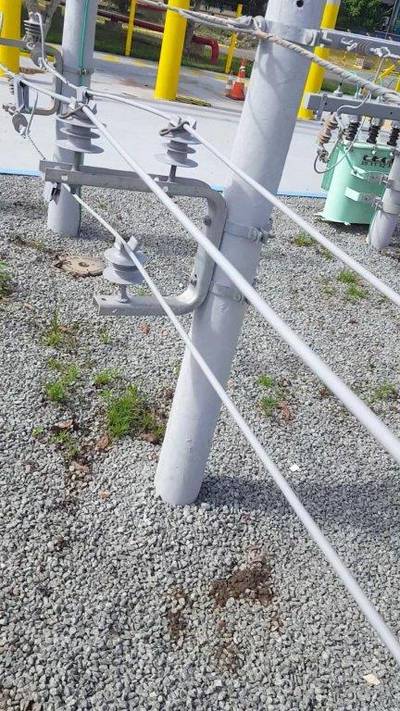
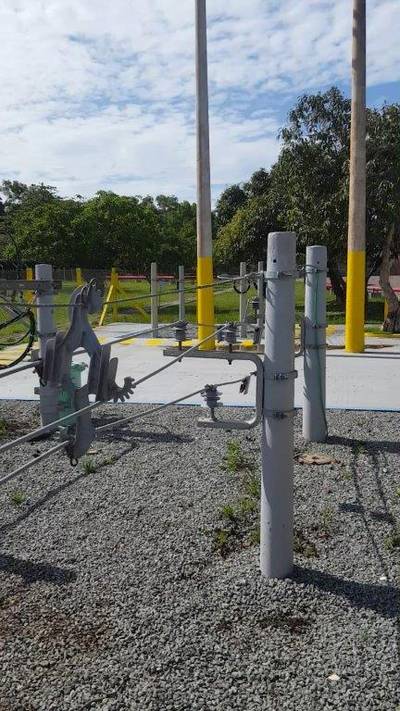
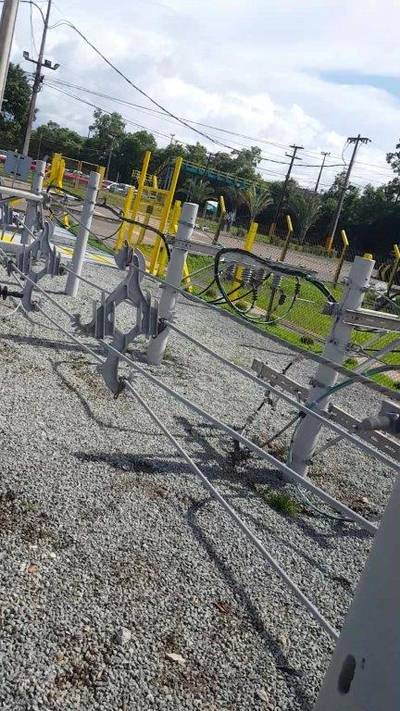
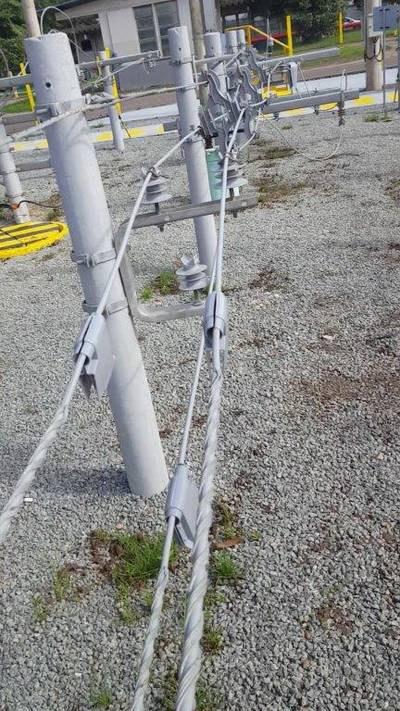
Moreover, the identification of objects during automatic inspections proves challenging. This is attributable to the varying sizes of the objects, the distance between the observer and the objects, and sometimes the presence of intersections between them. Notably, larger objects, such as the posts on the right side of the image, are more easily discernible, while smaller components pose a greater challenge. Consequently, devising a robust solution for automatic object identification is imperative to achieve superior outcomes compared to conventional methods.
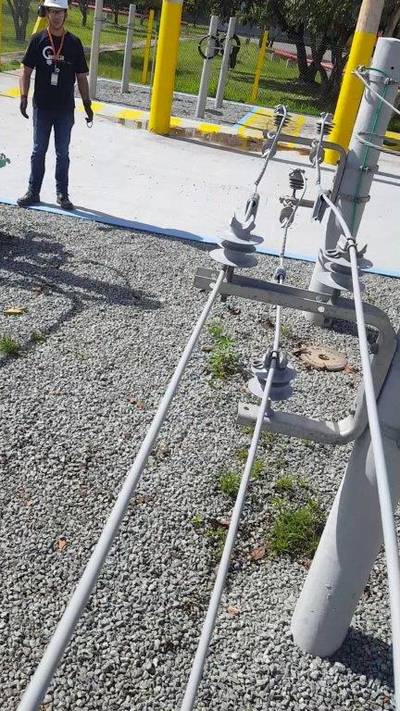
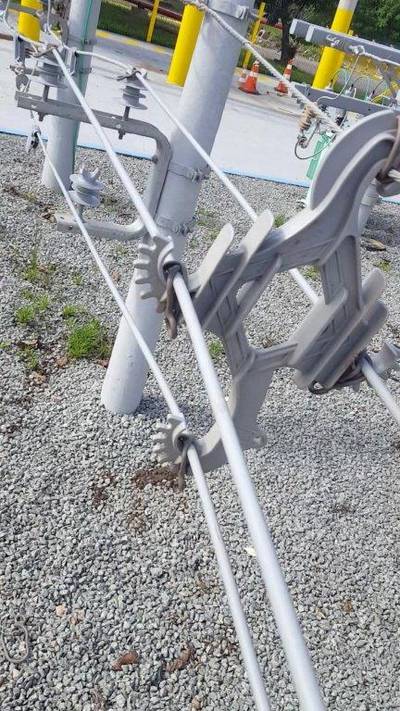
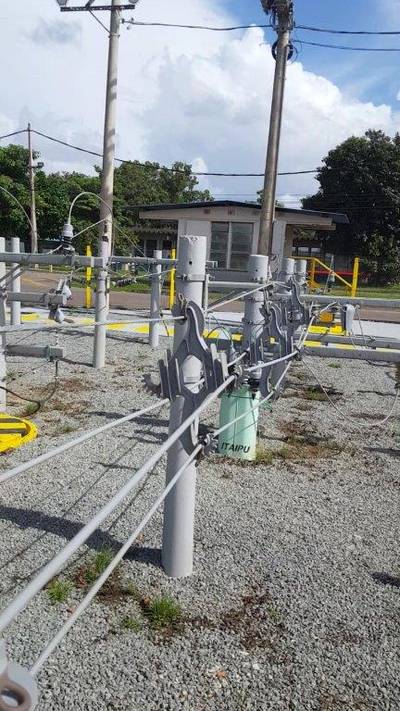
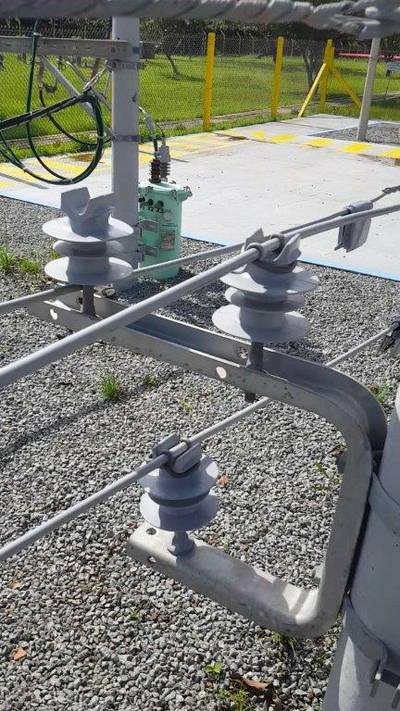
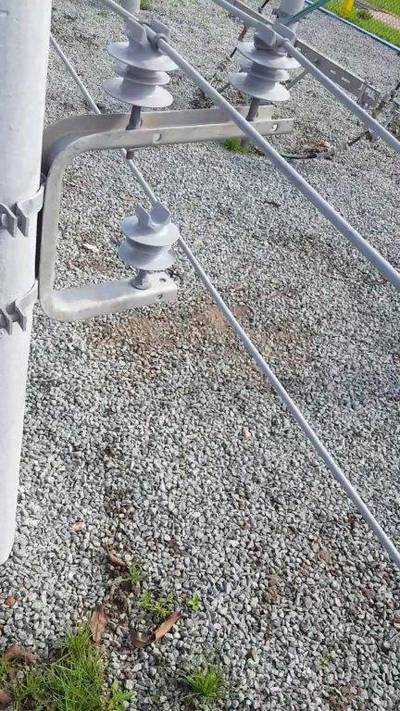
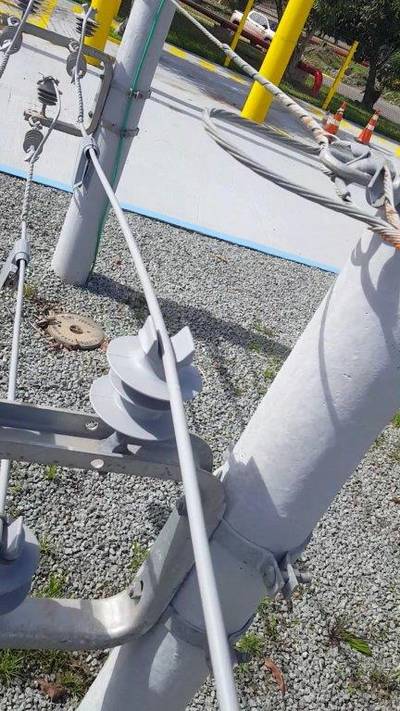
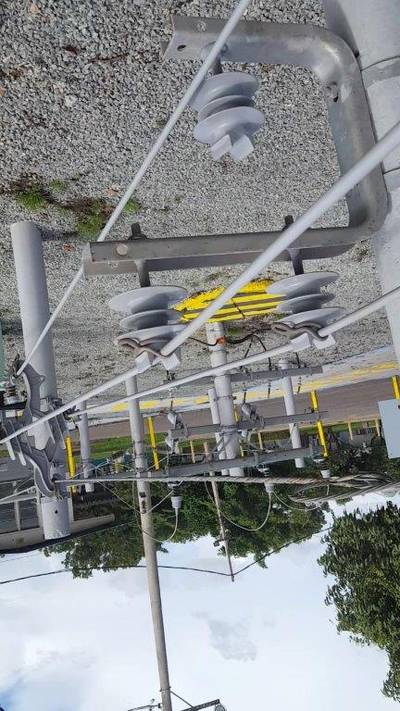
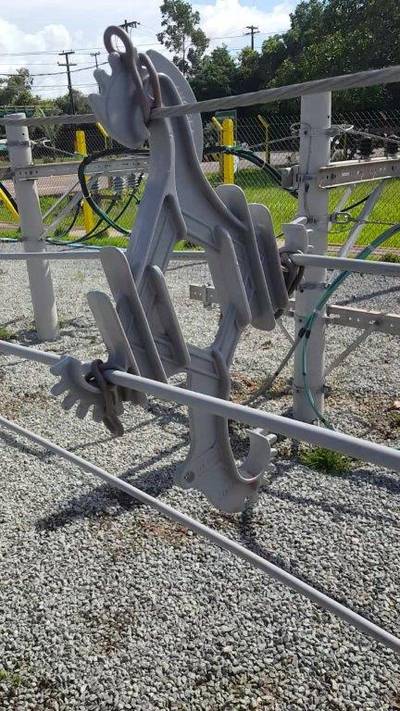
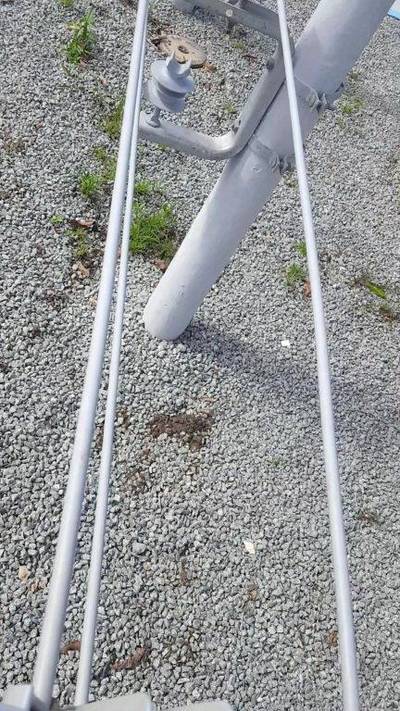
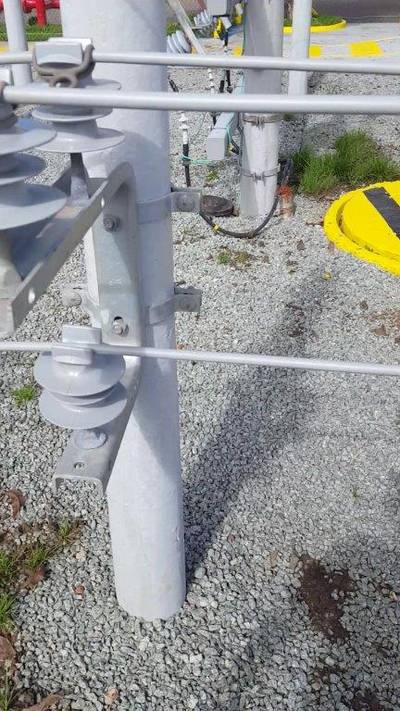
The energy lab is purpose-built for training in the maintenance of power distribution network components. The lab environment replicates various structures typically encountered along a railway. Notably, most of the lab’s components are installed at a height of approximately 1.5 meters. This deliberate choice was made to provide hands-on training for company employees. Moreover, this proximity to the ground enabled us to capture images for constructing the dataset from various distances and angles. As mentioned earlier, the main challenge in identifying objects and their defects arises from the small size of these components.
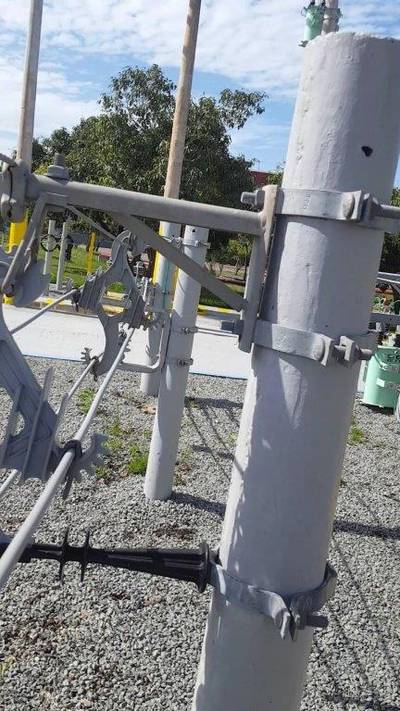
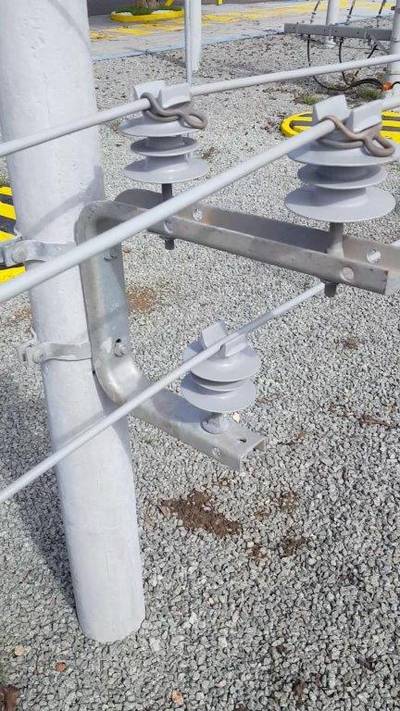
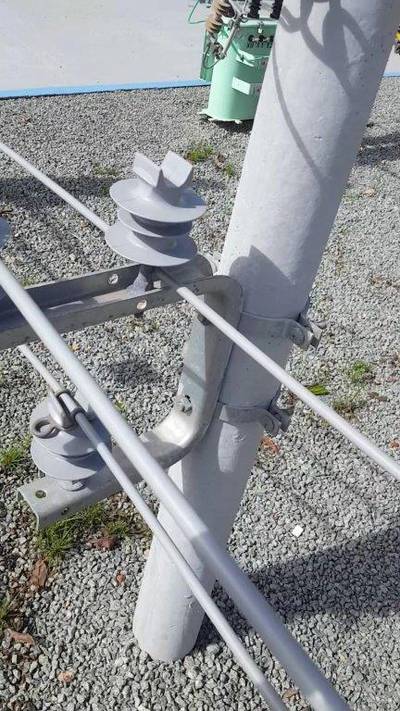
The authors’ study specifically focuses on two types of components, namely, insulators and electrical cables, and three common types of failures: (1) cable out of insulator; (2) cable out of spacer; and (3) insulator without ring.
Furthermore, it’s worth noting that these three common defects are frequently encountered along our power distribution network adjacent to the railway. These components are manually repositioned under the supervision of a railway expert with an electrical engineering background, effectively replicating real-world scenarios found within the company’s railway network. This approach allows us to capture images for constructing a dataset that closely mimics real situations.
 Homepage
 Research Paper
Summary #
Defects in Power Distribution Components is a dataset for an object detection task. It is used in the energy industry.
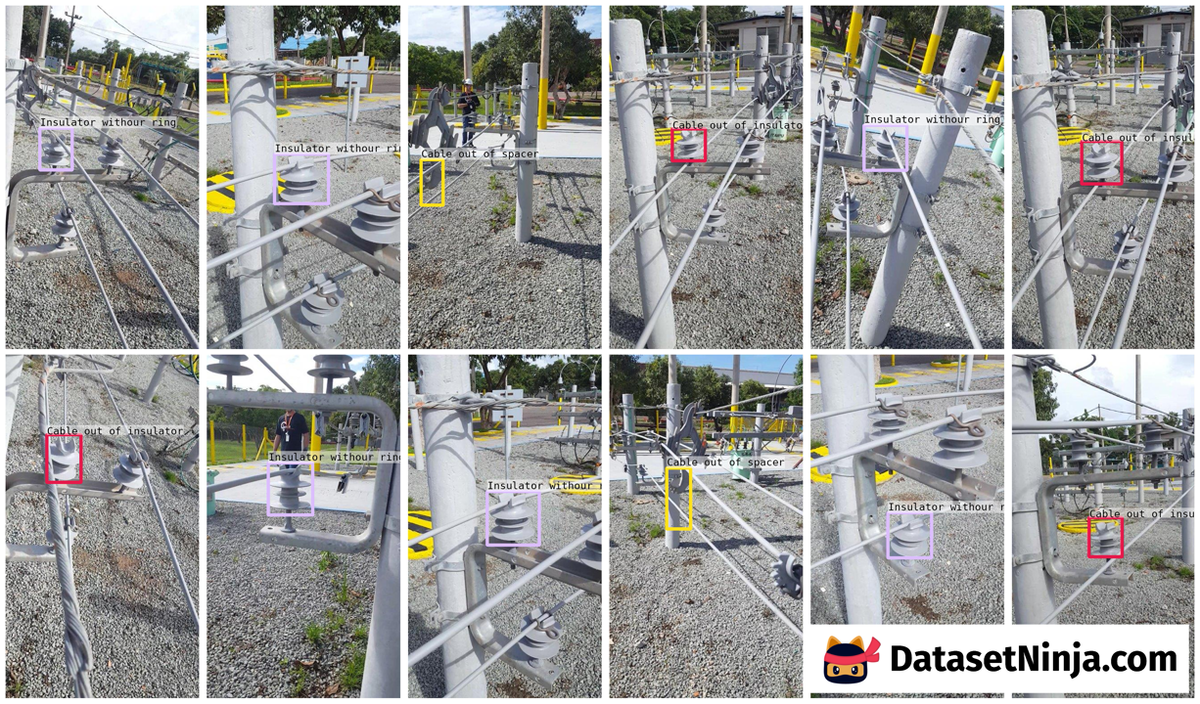
The dataset consists of 708 images with 707 labeled objects belonging to 3 different classes including cable out of insulator, cable out of spacer, and insulator withour ring.
Images in the Defects in Power Distribution Components dataset have bounding box annotations. There is 1 unlabeled image (i.e. without annotations). There are no pre-defined train/val/test splits in the dataset. The dataset was released in 2020 by the State University of Maranhão, Brazil.
Here is the visualized example grid with annotations:
Explore #
Defects in Power Distribution Components dataset has 708 images. Click on one of the examples below or open "Explore" tool anytime you need to view dataset images with annotations. This tool has extended visualization capabilities like zoom, translation, objects table, custom filters and more. Hover the mouse over the images to hide or show annotations.


Class balance #
There are 3 annotation classes in the dataset. Find the general statistics and balances for every class in the table below. Click any row to preview images that have labels of the selected class. Sort by column to find the most rare or prevalent classes.

Class ㅤ | Images ㅤ | Objects ㅤ | Count on image average | Area on image average |
|---|---|---|---|---|
Cable out of insulator➔ Unknown | 355 | 355 | 1 | 2.75% |
Cable out of spacer➔ Unknown | 180 | 180 | 1 | 2.92% |
Insulator withour ring➔ Unknown | 172 | 172 | 1 | 2.79% |
Co-occurrence matrix #
Co-occurrence matrix is an extremely valuable tool that shows you the images for every pair of classes: how many images have objects of both classes at the same time. If you click any cell, you will see those images. We added the tooltip with an explanation for every cell for your convenience, just hover the mouse over a cell to preview the description.
Images #
Explore every single image in the dataset with respect to the number of annotations of each class it has. Click a row to preview selected image. Sort by any column to find anomalies and edge cases. Use horizontal scroll if the table has many columns for a large number of classes in the dataset.
Object distribution #
Interactive heatmap chart for every class with object distribution shows how many images are in the dataset with a certain number of objects of a specific class. Users can click cell and see the list of all corresponding images.
Class sizes #
The table below gives various size properties of objects for every class. Click a row to see the image with annotations of the selected class. Sort columns to find classes with the smallest or largest objects or understand the size differences between classes.
Class | Object count | Avg area | Max area | Min area | Min height | Min height | Max height | Max height | Avg height | Avg height | Min width | Min width | Max width | Max width |
|---|---|---|---|---|---|---|---|---|---|---|---|---|---|---|
Cable out of insulator Unknown | 355 | 2.75% | 14.65% | 0.17% | 27px | 3.52% | 220px | 28.65% | 97px | 12.68% | 21px | 4.86% | 221px | 51.16% |
Cable out of spacer Unknown | 180 | 2.92% | 35.7% | 0.29% | 29px | 3.78% | 417px | 54.3% | 108px | 14.07% | 29px | 6.71% | 287px | 66.44% |
Insulator withour ring Unknown | 172 | 2.79% | 14.14% | 0.71% | 48px | 6.25% | 211px | 27.47% | 97px | 12.67% | 43px | 9.95% | 262px | 60.65% |
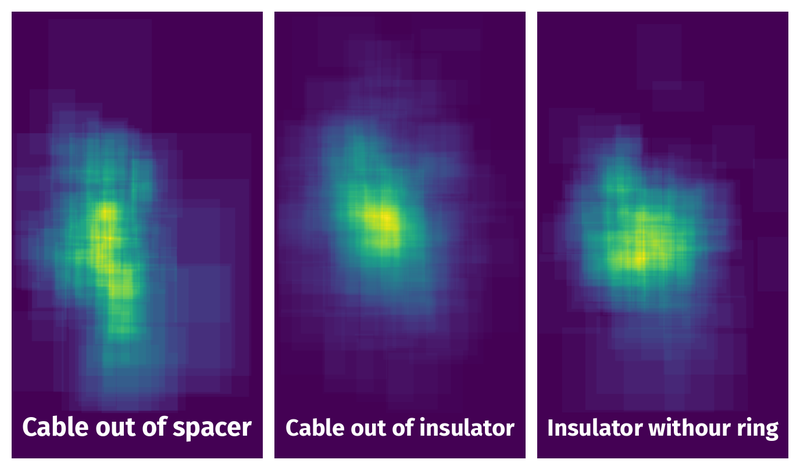
Spatial Heatmap #
The heatmaps below give the spatial distributions of all objects for every class. These visualizations provide insights into the most probable and rare object locations on the image. It helps analyze objects' placements in a dataset.
Objects #
Table contains all 707 objects. Click a row to preview an image with annotations, and use search or pagination to navigate. Sort columns to find outliers in the dataset.
Object ID ㅤ | Class ㅤ | Image name click row to open | Image size height x width | Height ㅤ | Height ㅤ | Width ㅤ | Width ㅤ | Area ㅤ |
|---|---|---|---|---|---|---|---|---|
1➔ | Cable out of insulator Unknown | 20190301_151605 080.jpg | 768 x 432 | 72px | 9.38% | 63px | 14.58% | 1.37% |
2➔ | Cable out of spacer Unknown | 20190301_150450 079.jpg | 768 x 432 | 73px | 9.51% | 48px | 11.11% | 1.06% |
3➔ | Cable out of spacer Unknown | 20190301_150215 076.jpg | 768 x 432 | 104px | 13.54% | 63px | 14.58% | 1.97% |
4➔ | Insulator withour ring Unknown | 20190301_151845 027.jpg | 768 x 432 | 66px | 8.59% | 67px | 15.51% | 1.33% |
5➔ | Insulator withour ring Unknown | 20190301_151845 096.jpg | 768 x 432 | 112px | 14.58% | 99px | 22.92% | 3.34% |
6➔ | Cable out of insulator Unknown | 20190301_150806 080.jpg | 768 x 432 | 100px | 13.02% | 88px | 20.37% | 2.65% |
7➔ | Cable out of insulator Unknown | 20190301_151410 005.jpg | 768 x 432 | 73px | 9.51% | 66px | 15.28% | 1.45% |
8➔ | Insulator withour ring Unknown | 20190301_151201 037.jpg | 768 x 432 | 52px | 6.77% | 49px | 11.34% | 0.77% |
9➔ | Cable out of insulator Unknown | 20190301_151410 004.jpg | 768 x 432 | 71px | 9.24% | 60px | 13.89% | 1.28% |
10➔ | Insulator withour ring Unknown | 20190301_151845 051.jpg | 768 x 432 | 87px | 11.33% | 85px | 19.68% | 2.23% |
License #
Citation #
If you make use of the Defects in Power Distribution Components data, please cite the following reference:
@dataset{joao_pedro_augusto_costa_2020_3972451,
  author       = {João Pedro Augusto Costa and
                  Omar Andres Carmona Cortes and
                  Jose Israel de Almondes},
  title        = {Defects in Power Distribution Components},
  month        = aug,
  year         = 2020,
  publisher    = {Zenodo},
  version      = 1,
  doi          = {10.5281/zenodo.3972451},
  url          = {https://doi.org/10.5281/zenodo.3972451}
}
If you are happy with Dataset Ninja and use provided visualizations and tools in your work, please cite us:
@misc{ visualization-tools-for-defects-power-distribution-dataset,
  title = { Visualization Tools for Defects in Power Distribution Components Dataset },
  type = { Computer Vision Tools },
  author = { Dataset Ninja },
  howpublished = { \url{ https://datasetninja.com/defects-power-distribution } },
  url = { https://datasetninja.com/defects-power-distribution },
  journal = { Dataset Ninja },
  publisher = { Dataset Ninja },
  year = { 2026 },
  month = { jul },
  note = { visited on 2026-07-15 },
}
Download #
Dataset Defects in Power Distribution Components can be downloaded in Supervisely format:
As an alternative, it can be downloaded with dataset-tools package:
pip install --upgrade dataset-tools
… using following python code:
import dataset_tools as dtools

dtools.download(dataset='Defects in Power Distribution Components', dst_dir='~/dataset-ninja/')
Make sure not to overlook the python code example available on the Supervisely Developer Portal. It will give you a clear idea of how to effortlessly work with the downloaded dataset.
The data in original format can be downloaded here.
Disclaimer #
Our gal from the legal dep told us we need to post this:
Dataset Ninja provides visualizations and statistics for some datasets that can be found online and can be downloaded by general audience. Dataset Ninja is not a dataset hosting platform and can only be used for informational purposes. The platform does not claim any rights for the original content, including images, videos, annotations and descriptions. Joint publishing is prohibited.
You take full responsibility when you use datasets presented at Dataset Ninja, as well as other information, including visualizations and statistics we provide. You are in charge of compliance with any dataset license and all other permissions. You are required to navigate datasets homepage and make sure that you can use it. In case of any questions, get in touch with us at hello@datasetninja.com.