

Introduction #
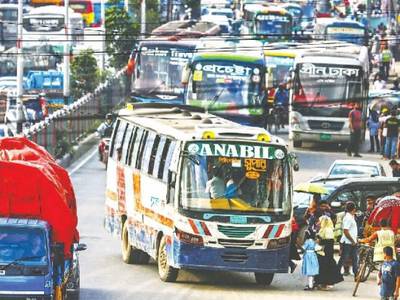
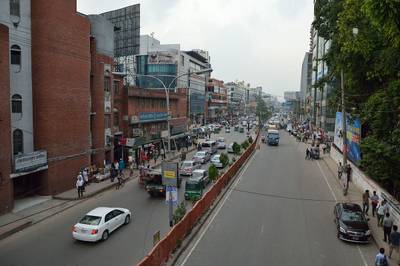
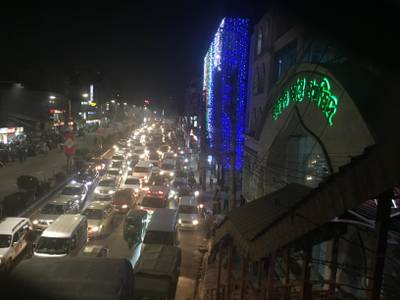
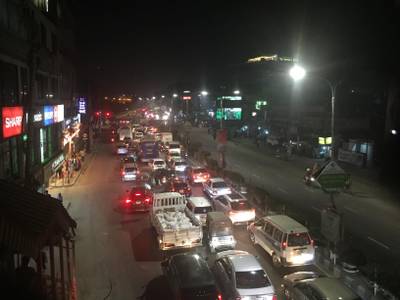
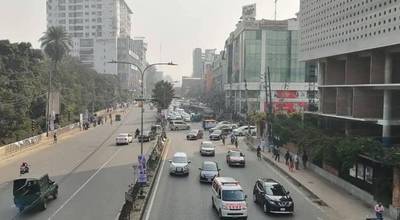
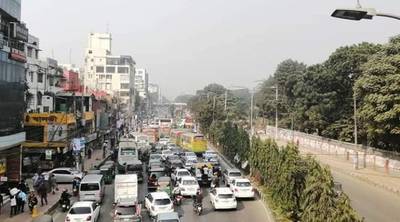
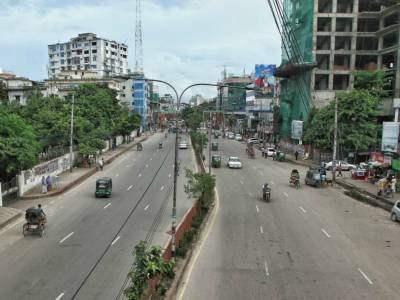
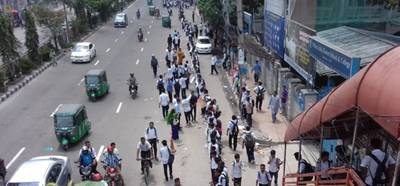
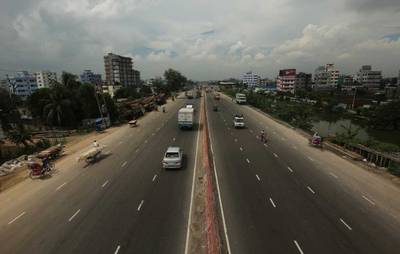
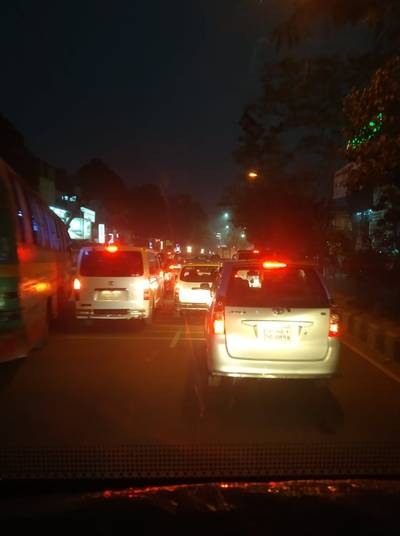
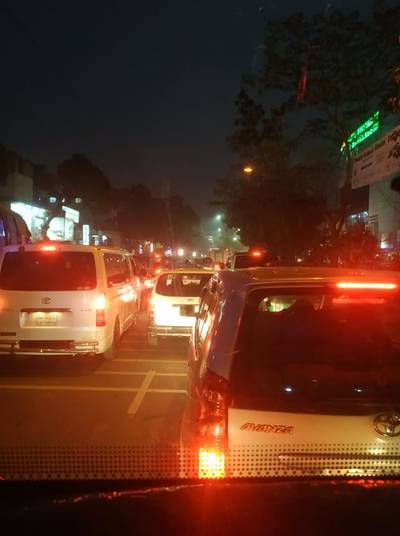
The creators of the Dhaka-AI: Dhaka Traffic Detection Challenge Dataset emphasize the distinctive traffic conditions in Dhaka city. Although it’s a city of significant size, only 7% of its roads meet urban standards. However, it contends with a staggering 8 million daily commuters, all within a 306 square kilometer area. In response to this complex challenge, they introduced the AI-based Dhaka Traffic Detection Challenge.
The primary objective of this challenge is to evaluate the effectiveness of advanced techniques in automated traffic detection using AI and ICT solutions, especially in the context of a diverse urban environment like Dhaka. Furthermore, the challenge seeks to encourage collaboration among experts in the region and establish a thriving AI-based community in South-East Asia.
 Homepage
 Kaggle
Summary #
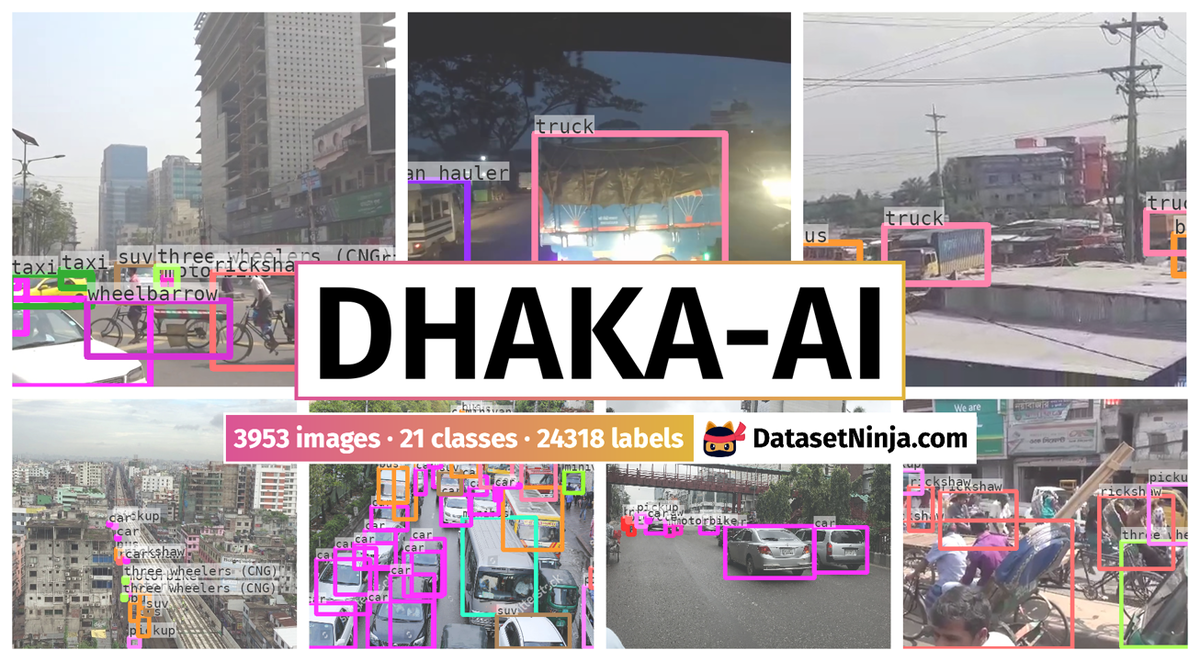
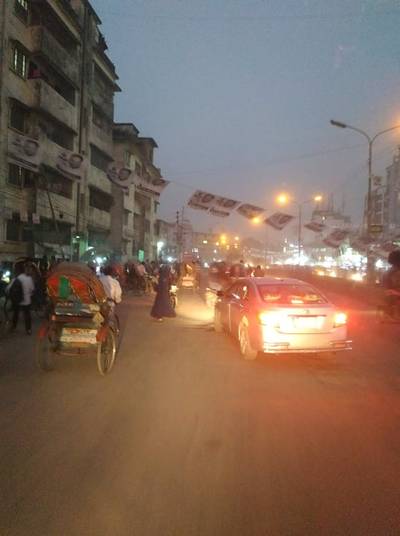
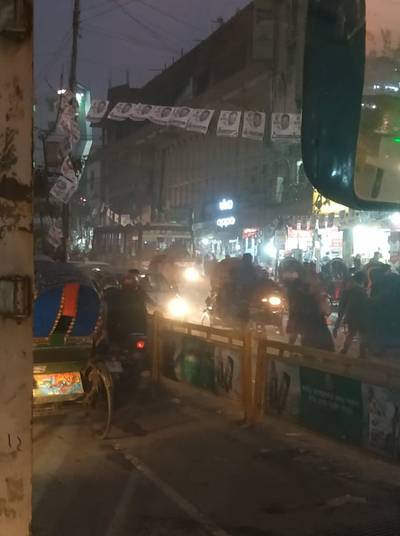
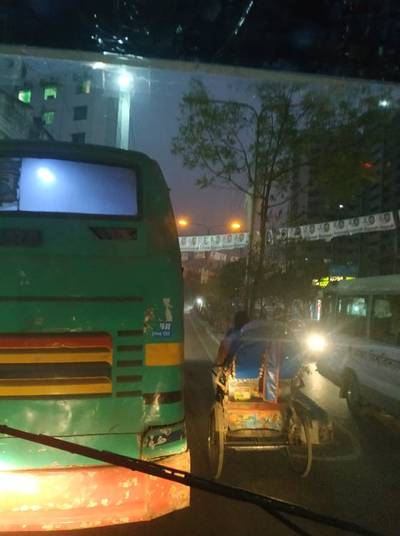
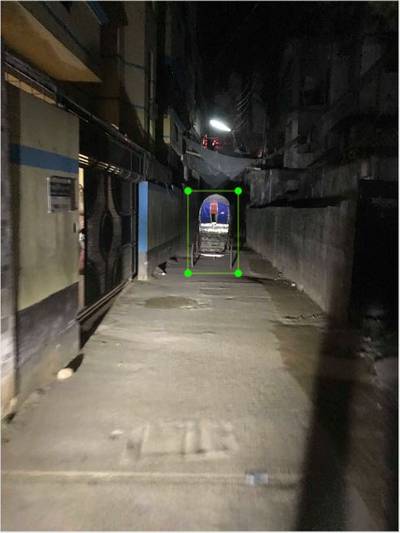
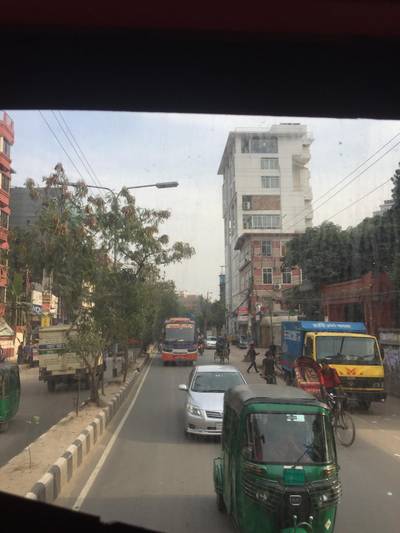
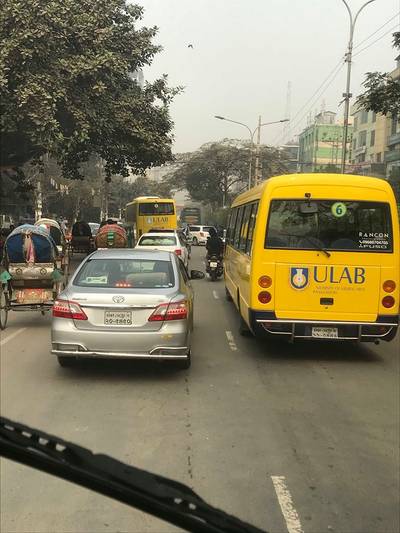
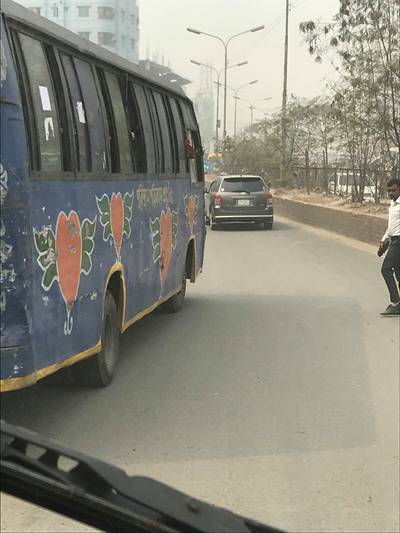
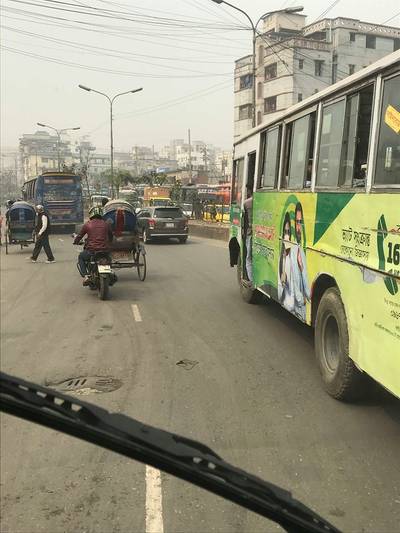
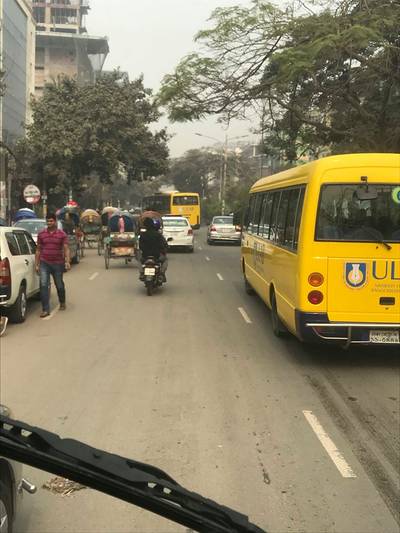
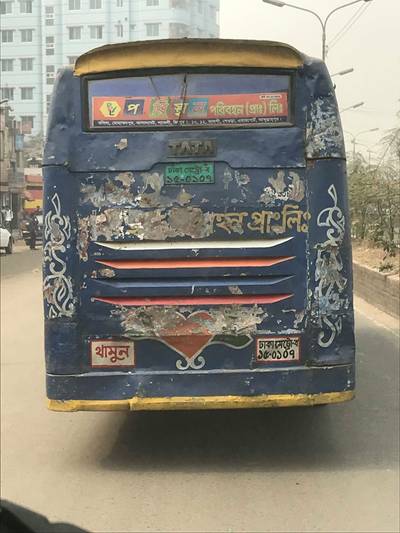
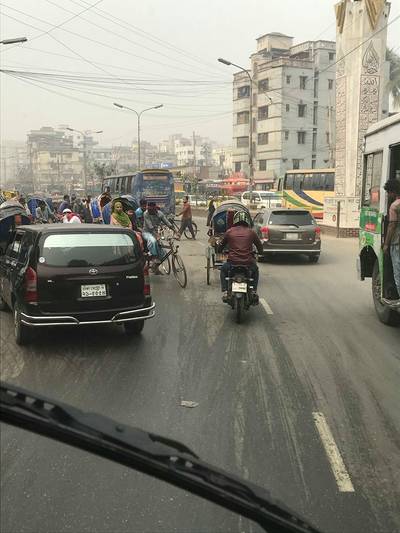
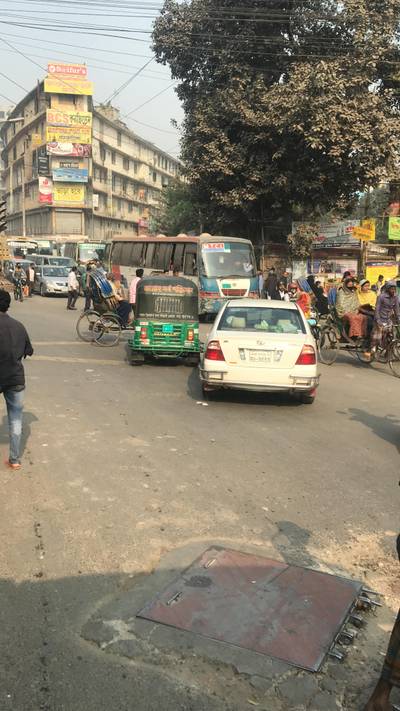
Dhaka-AI: Dhaka Traffic Detection Challenge Dataset is a dataset for an object detection task. It is used in the urban planning research. Possible applications of the dataset could be in the vehicle detection domain.
The dataset consists of 3953 images with 24318 labeled objects belonging to 21 different classes including car, bus, motorbike, and other: three wheelers (CNG), rickshaw, truck, pickup, minivan, suv, van, bicycle, auto rickshaw, human hauler, wheelbarrow, ambulance, minibus, taxi, army vehicle, scooter, policecar, and garbagevan.
Images in the Dhaka-AI dataset have bounding box annotations. There are 956 (24% of the total) unlabeled images (i.e. without annotations). There are 3 splits in the dataset: train (3003 images), test (500 images), and test2 (450 images). The dataset was released in 2020.
Explore #
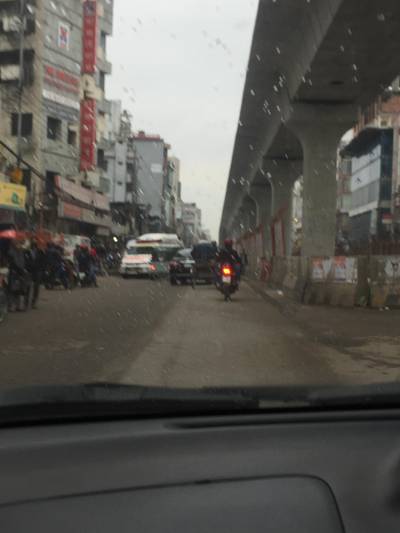
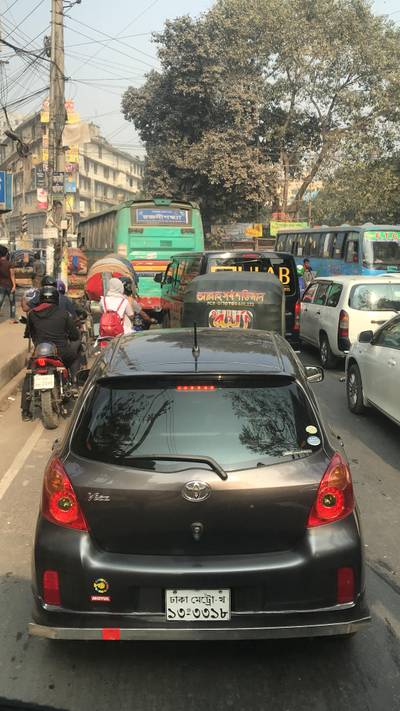
Dhaka-AI dataset has 3953 images. Click on one of the examples below or open "Explore" tool anytime you need to view dataset images with annotations. This tool has extended visualization capabilities like zoom, translation, objects table, custom filters and more. Hover the mouse over the images to hide or show annotations.


Class balance #
There are 21 annotation classes in the dataset. Find the general statistics and balances for every class in the table below. Click any row to preview images that have labels of the selected class. Sort by column to find the most rare or prevalent classes.

Class ㅤ | Images ㅤ | Objects ㅤ | Count on image average | Area on image average |
|---|---|---|---|---|
car➔ rectangle | 1618 | 5467 | 3.38 | 5.47% |
bus➔ rectangle | 1554 | 3327 | 2.14 | 10.37% |
motorbike➔ rectangle | 1184 | 2280 | 1.93 | 4.23% |
three wheelers (CNG)➔ rectangle | 1167 | 2986 | 2.56 | 3.78% |
rickshaw➔ rectangle | 1019 | 3536 | 3.47 | 8.3% |
truck➔ rectangle | 842 | 1492 | 1.77 | 10.49% |
pickup➔ rectangle | 792 | 1224 | 1.55 | 5.67% |
minivan➔ rectangle | 575 | 934 | 1.62 | 3.33% |
suv➔ rectangle | 536 | 857 | 1.6 | 3.06% |
van➔ rectangle | 448 | 755 | 1.69 | 3.24% |
Co-occurrence matrix #
Co-occurrence matrix is an extremely valuable tool that shows you the images for every pair of classes: how many images have objects of both classes at the same time. If you click any cell, you will see those images. We added the tooltip with an explanation for every cell for your convenience, just hover the mouse over a cell to preview the description.
Images #
Explore every single image in the dataset with respect to the number of annotations of each class it has. Click a row to preview selected image. Sort by any column to find anomalies and edge cases. Use horizontal scroll if the table has many columns for a large number of classes in the dataset.
Object distribution #
Interactive heatmap chart for every class with object distribution shows how many images are in the dataset with a certain number of objects of a specific class. Users can click cell and see the list of all corresponding images.
Class sizes #
The table below gives various size properties of objects for every class. Click a row to see the image with annotations of the selected class. Sort columns to find classes with the smallest or largest objects or understand the size differences between classes.
Class | Object count | Avg area | Max area | Min area | Min height | Min height | Max height | Max height | Avg height | Avg height | Min width | Min width | Max width | Max width |
|---|---|---|---|---|---|---|---|---|---|---|---|---|---|---|
car rectangle | 5467 | 1.71% | 53.59% | 0% | 7px | 0.67% | 2093px | 75.56% | 99px | 10.15% | 7px | 0.42% | 2539px | 96.67% |
rickshaw rectangle | 3536 | 2.57% | 77.87% | 0.01% | 7px | 0.57% | 2675px | 98.61% | 158px | 15.87% | 7px | 0.48% | 1914px | 99.06% |
bus rectangle | 3327 | 4.91% | 94.66% | 0.01% | 8px | 0.77% | 2641px | 99.91% | 191px | 20.18% | 9px | 0.62% | 3295px | 99.95% |
three wheelers (CNG) rectangle | 2986 | 1.57% | 44.19% | 0% | 8px | 0.64% | 2047px | 76.39% | 122px | 11.48% | 5px | 0.32% | 1542px | 76.35% |
motorbike rectangle | 2280 | 2.22% | 84.25% | 0% | 8px | 0.5% | 1568px | 89.12% | 131px | 11.37% | 4px | 0.24% | 1917px | 99.84% |
truck rectangle | 1492 | 6% | 98.84% | 0.01% | 7px | 1.05% | 3086px | 99.83% | 215px | 22.52% | 10px | 0.72% | 3735px | 99.58% |
pickup rectangle | 1224 | 3.71% | 83.89% | 0.01% | 8px | 1.06% | 2187px | 99.69% | 148px | 17.73% | 10px | 0.5% | 3692px | 95.82% |
minivan rectangle | 934 | 2.06% | 47.62% | 0.01% | 11px | 0.69% | 894px | 82.13% | 110px | 11.79% | 12px | 0.75% | 1368px | 71.25% |
suv rectangle | 857 | 1.92% | 75.32% | 0.01% | 11px | 0.64% | 1205px | 98.98% | 133px | 11.11% | 11px | 0.67% | 1558px | 82.55% |
van rectangle | 755 | 1.95% | 54.1% | 0.01% | 8px | 0.93% | 1251px | 80.37% | 117px | 11.54% | 10px | 0.6% | 1518px | 79.06% |
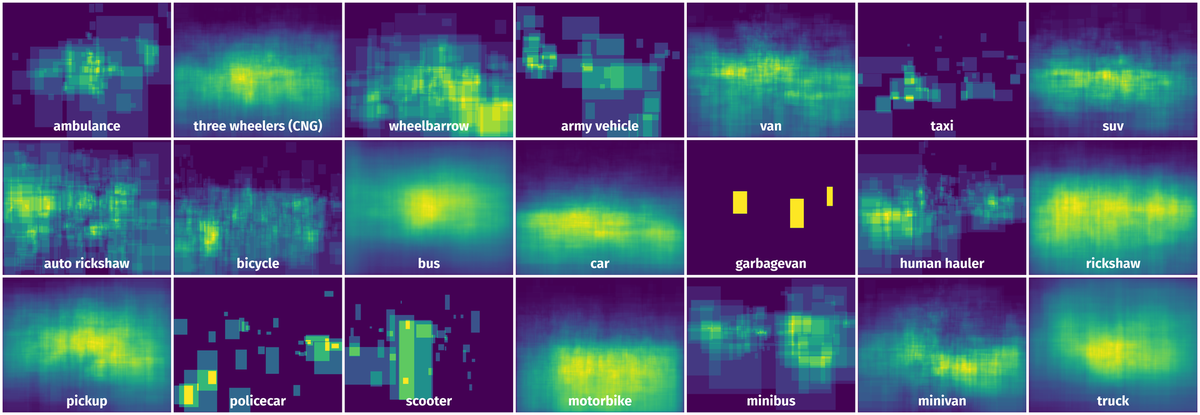
Spatial Heatmap #
The heatmaps below give the spatial distributions of all objects for every class. These visualizations provide insights into the most probable and rare object locations on the image. It helps analyze objects' placements in a dataset.
Objects #
Table contains all 24318 objects. Click a row to preview an image with annotations, and use search or pagination to navigate. Sort columns to find outliers in the dataset.
Object ID ㅤ | Class ㅤ | Image name click row to open | Image size height x width | Height ㅤ | Height ㅤ | Width ㅤ | Width ㅤ | Area ㅤ |
|---|---|---|---|---|---|---|---|---|
1➔ | motorbike rectangle | Navid_239.jpg | 1080 x 1920 | 157px | 14.54% | 115px | 5.99% | 0.87% |
2➔ | motorbike rectangle | Navid_239.jpg | 1080 x 1920 | 86px | 7.96% | 91px | 4.74% | 0.38% |
3➔ | motorbike rectangle | Navid_239.jpg | 1080 x 1920 | 70px | 6.48% | 54px | 2.81% | 0.18% |
4➔ | motorbike rectangle | Navid_239.jpg | 1080 x 1920 | 86px | 7.96% | 60px | 3.12% | 0.25% |
5➔ | bicycle rectangle | Navid_239.jpg | 1080 x 1920 | 126px | 11.67% | 117px | 6.09% | 0.71% |
6➔ | car rectangle | Navid_239.jpg | 1080 x 1920 | 132px | 12.22% | 150px | 7.81% | 0.95% |
7➔ | car rectangle | Navid_239.jpg | 1080 x 1920 | 93px | 8.61% | 185px | 9.64% | 0.83% |
8➔ | suv rectangle | Navid_239.jpg | 1080 x 1920 | 108px | 10% | 173px | 9.01% | 0.9% |
9➔ | truck rectangle | Pias (382).jpg | 720 x 1280 | 237px | 32.92% | 251px | 19.61% | 6.45% |
10➔ | bus rectangle | Navid_292.jpg | 720 x 1280 | 211px | 29.31% | 188px | 14.69% | 4.3% |
License #
Dhaka Traffic Detection Challenge Dataset is under GNU GPL 2.0 license.
Citation #
If you make use of the Dhaka-AI data, please cite the following reference:
@dataset{Dhaka-AI,
  author={ASM Shihavuddin and Mohammad Rifat Ahmmad Rashid},
  title={Dhaka Traffic Detection Challenge Dataset},
  year={2020},
  url={https://www.kaggle.com/datasets/rifat963/dhakaai-dhaka-based-traffic-detection-dataset}
}
If you are happy with Dataset Ninja and use provided visualizations and tools in your work, please cite us:
@misc{ visualization-tools-for-dhaka-ai-dataset,
  title = { Visualization Tools for Dhaka-AI Dataset },
  type = { Computer Vision Tools },
  author = { Dataset Ninja },
  howpublished = { \url{ https://datasetninja.com/dhaka-ai } },
  url = { https://datasetninja.com/dhaka-ai },
  journal = { Dataset Ninja },
  publisher = { Dataset Ninja },
  year = { 2026 },
  month = { jul },
  note = { visited on 2026-07-30 },
}
Download #
Dataset Dhaka-AI can be downloaded in Supervisely format:
As an alternative, it can be downloaded with dataset-tools package:
pip install --upgrade dataset-tools
… using following python code:
import dataset_tools as dtools

dtools.download(dataset='Dhaka-AI', dst_dir='~/dataset-ninja/')
Make sure not to overlook the python code example available on the Supervisely Developer Portal. It will give you a clear idea of how to effortlessly work with the downloaded dataset.
The data in original format can be downloaded here.
Disclaimer #
Our gal from the legal dep told us we need to post this:
Dataset Ninja provides visualizations and statistics for some datasets that can be found online and can be downloaded by general audience. Dataset Ninja is not a dataset hosting platform and can only be used for informational purposes. The platform does not claim any rights for the original content, including images, videos, annotations and descriptions. Joint publishing is prohibited.
You take full responsibility when you use datasets presented at Dataset Ninja, as well as other information, including visualizations and statistics we provide. You are in charge of compliance with any dataset license and all other permissions. You are required to navigate datasets homepage and make sure that you can use it. In case of any questions, get in touch with us at hello@datasetninja.com.