

Introduction #
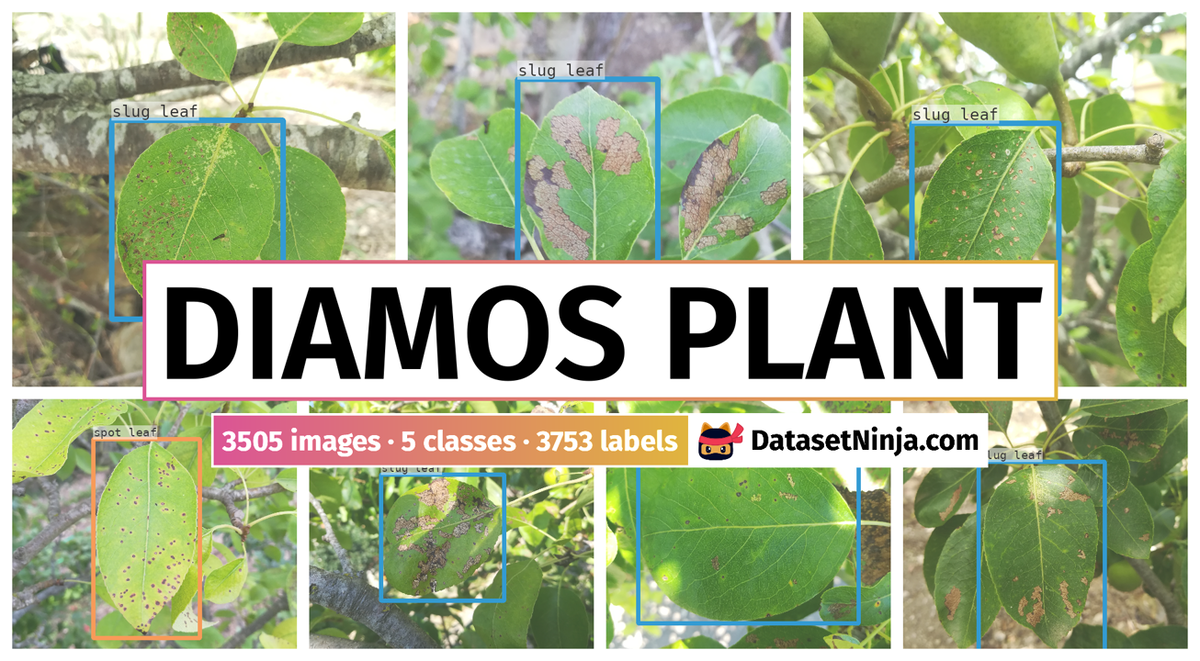
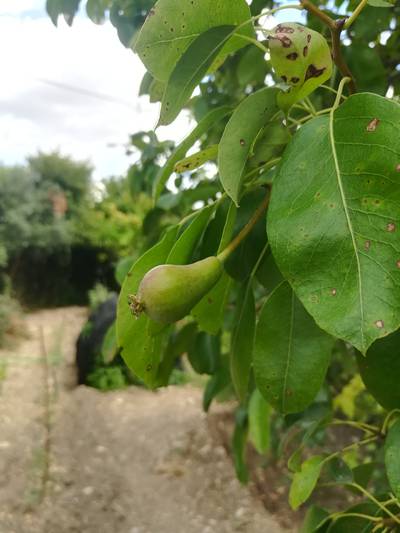
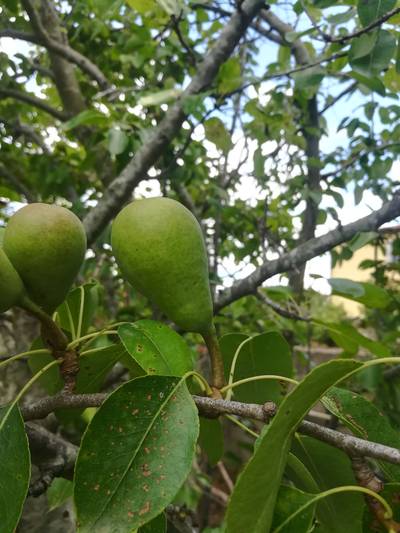
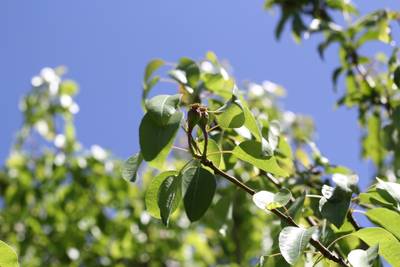
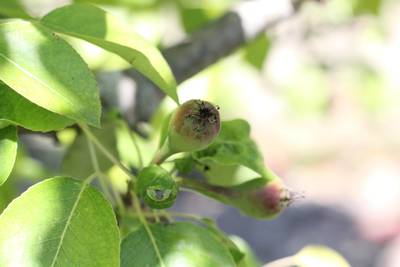
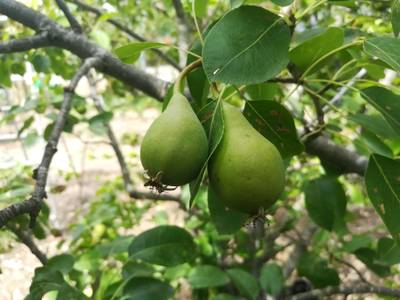
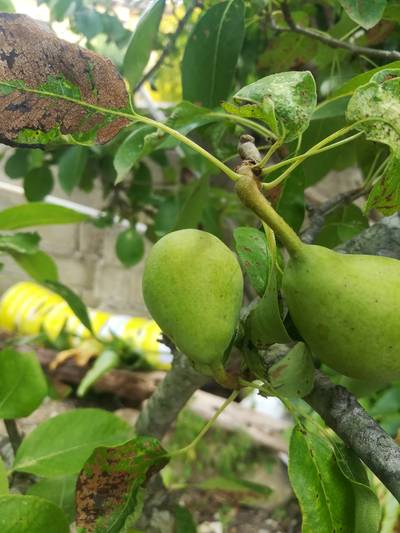
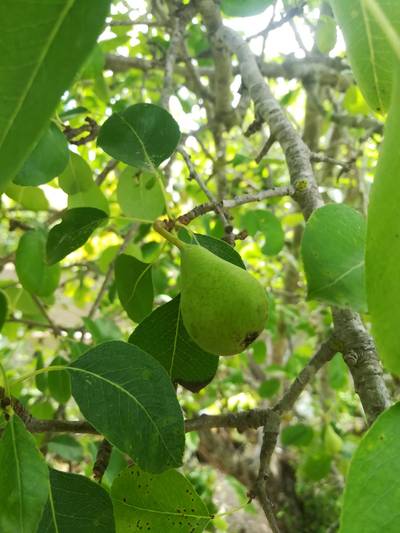
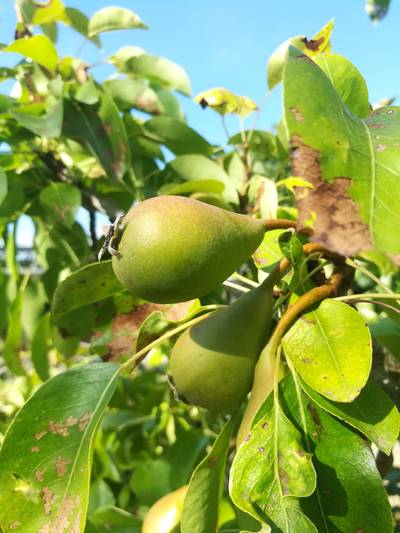
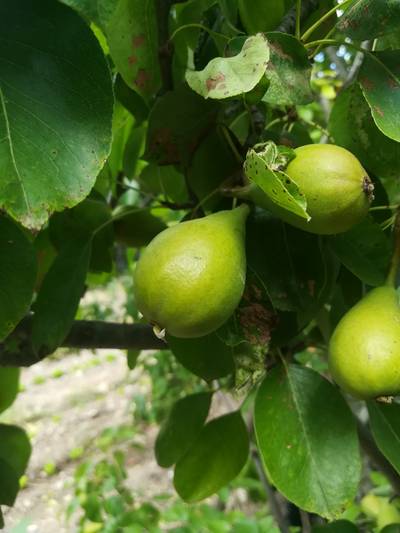
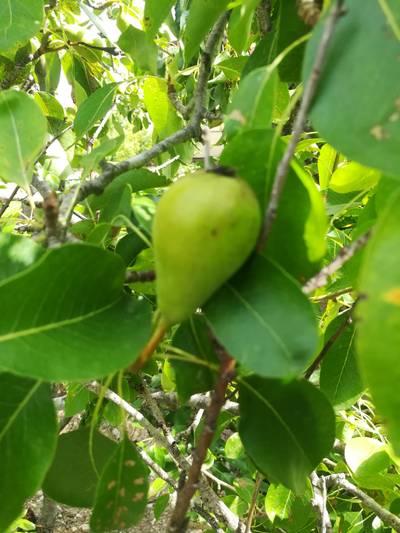
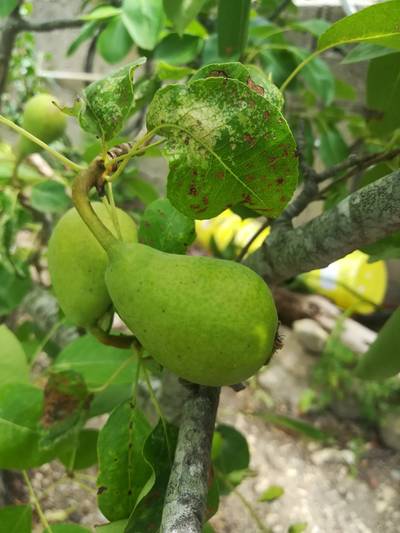
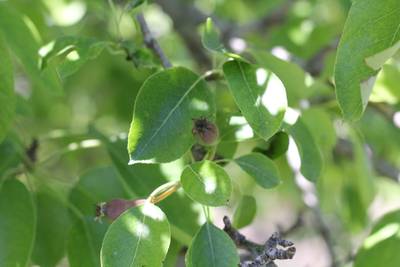
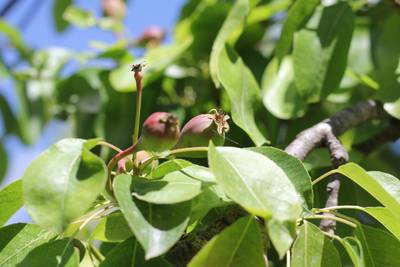
The authors of the DiaMOS Plant: A Dataset for Diagnosis and Monitoring Plant Disease contribute to the evolving field of foliar disease classification and recognition through the utilization of machine and deep learning concepts. It has 3505 images of pear fruit and leaves affected by four diseases: slug leaf, spot leaf, curl leaf, and healthy leaf. The study offers valuable guidelines for the research community to select and construct further datasets.
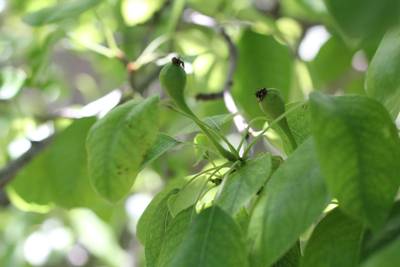
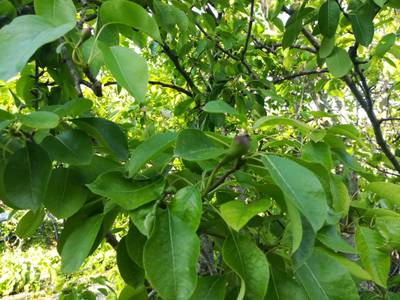
The direct visual examination of leaves serves as a crucial source of information for assessing plant health. Leaf symptoms are early indicators of various diseases, infections, parasites, and deficiencies that impact plant development and life cycles. Biotic and abiotic stresses, significant factors limiting agricultural productivity, necessitate innovative and sustainable cultivation practices.
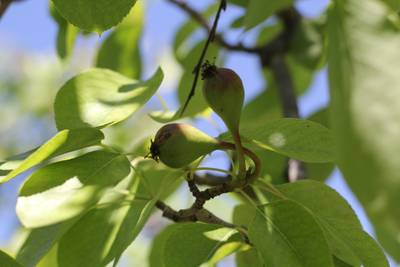
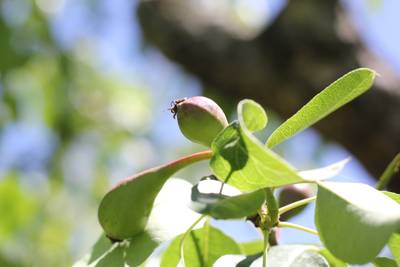
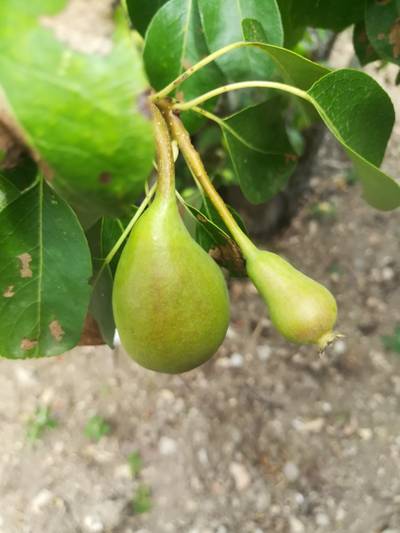
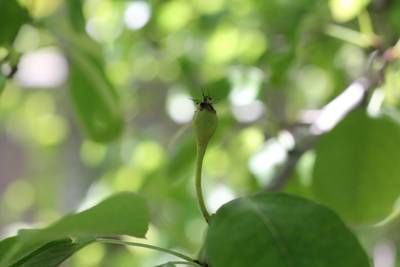
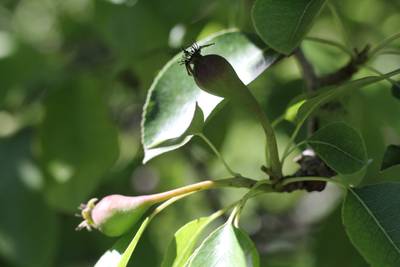
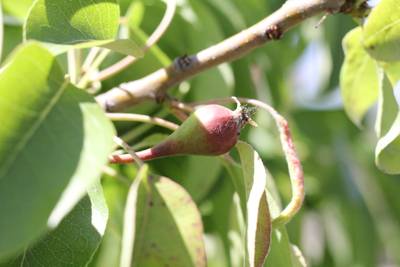
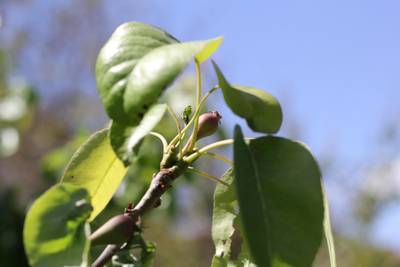
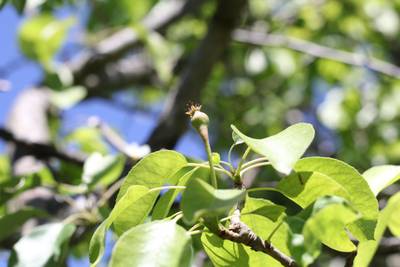
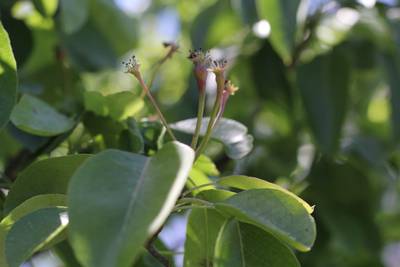
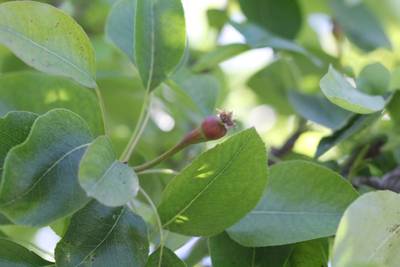
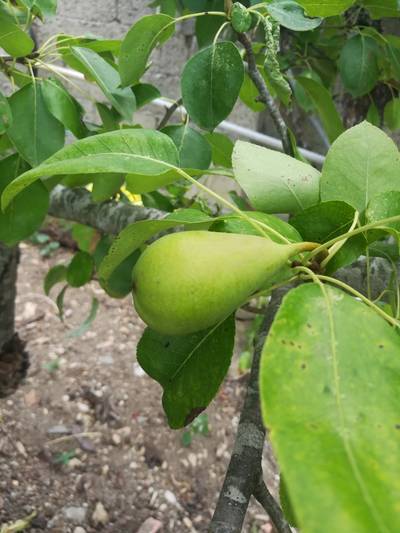
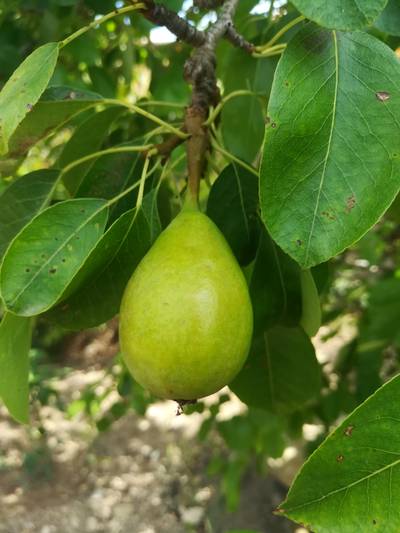
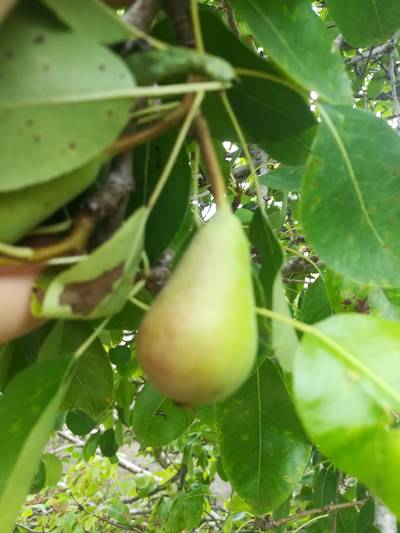
DiaMOS Plant is introduced as a field dataset for diagnosing and monitoring plant symptoms. It covers an entire growing season of a pear tree, containing 3505 images depicting four leaf stresses and three stages of fruit development. The dataset, suitable for machine and deep learning methods, includes detailed information on fruit and leaf images, resolution variations, and acquisition devices.
| DiaMOS Plant Dataset | |
|---|---|
| Plant | Pear |
| Cultivar | Septoria Piricola |
| Data Source Location | Sardegna, Italy |
| Type of Data | RGB Images |
| ROI (Region of Interest) | Leaf, Fruit |
| Total Size | 3505 images |
Dataset description
The authors of the dataset comprise images captured using different devices, including smartphones and DSLR cameras. Two resolutions, 2976 × 3968 and 3456 × 5184, add complexity and value to the dataset. Multiple devices were employed to simulate real-world scenarios where operators have diverse technical characteristics in their devices. Leaves were captured from the adaxial side under various realistic conditions, including different lighting, angles, backgrounds, and noise levels. This approach allowed for the representation of leaves under diverse lighting conditions and the observation of symptom evolution over time.
| Smartphone Camera | DSRL Camera | |
|---|---|---|
| Image size | 2976 × 3968 | 3456 × 5184 |
| Model device | Honor 6× | Canon EOS 60D |
| Focal length | 3.83 mm | 50 mm |
| Focal ratio | f/2.2 | f/4.5 |
| Color space | RGB | RGB |
Dataset annotation
The dataset labeling process involved manual annotation using the LabelImg software. An expert assisted in disease recognition, and severity levels were assigned for specific classes. Severity levels ranged from no risk (0%) to high risk (>50%), providing detailed information on the affected leaf area.
The dataset’s representativeness, complexity, and detailed annotations contribute to its potential for advancing research in the field of plant symptom diagnosis and monitoring. Some annotations are of poor quality: the bounding boxes do not correspond to the location of objects in the image.
 Homepage
 Research Paper 1 (main)Research Paper 2
 GitHub
Summary #
DiaMOS Plant: A Dataset for Diagnosis and Monitoring Plant Disease is a dataset for an object detection task. It is used in the agricultural industry.
The dataset consists of 3505 images with 3753 labeled objects belonging to 5 different classes including slug leaf, spot leaf, pear, and other: curl leaf and healthy leaf.
Images in the DiaMOS Plant dataset have bounding box annotations. There are 13 (0% of the total) unlabeled images (i.e. without annotations). There are no pre-defined train/val/test splits in the dataset. Additionally, the images have severity level and source tags. The severity level is determined based on the percentage of leaf area affected, source - identifies the device with which the image was taken. The dataset was released in 2021 by the University of Cagliari, Italy.
Explore #
DiaMOS Plant dataset has 3505 images. Click on one of the examples below or open "Explore" tool anytime you need to view dataset images with annotations. This tool has extended visualization capabilities like zoom, translation, objects table, custom filters and more. Hover the mouse over the images to hide or show annotations.


Class balance #
There are 5 annotation classes in the dataset. Find the general statistics and balances for every class in the table below. Click any row to preview images that have labels of the selected class. Sort by column to find the most rare or prevalent classes.

Class ㅤ | Images ㅤ | Objects ㅤ | Count on image average | Area on image average |
|---|---|---|---|---|
slug leaf➔ rectangle | 2025 | 2028 | 1 | 26.69% |
spot leaf➔ rectangle | 884 | 885 | 1 | 26.73% |
pear➔ rectangle | 486 | 734 | 1.51 | 14.73% |
curl leaf➔ rectangle | 54 | 63 | 1.17 | 20.28% |
healthy leaf➔ rectangle | 43 | 43 | 1 | 27.87% |
Co-occurrence matrix #
Co-occurrence matrix is an extremely valuable tool that shows you the images for every pair of classes: how many images have objects of both classes at the same time. If you click any cell, you will see those images. We added the tooltip with an explanation for every cell for your convenience, just hover the mouse over a cell to preview the description.
Images #
Explore every single image in the dataset with respect to the number of annotations of each class it has. Click a row to preview selected image. Sort by any column to find anomalies and edge cases. Use horizontal scroll if the table has many columns for a large number of classes in the dataset.
Object distribution #
Interactive heatmap chart for every class with object distribution shows how many images are in the dataset with a certain number of objects of a specific class. Users can click cell and see the list of all corresponding images.
Class sizes #
The table below gives various size properties of objects for every class. Click a row to see the image with annotations of the selected class. Sort columns to find classes with the smallest or largest objects or understand the size differences between classes.
Class | Object count | Avg area | Max area | Min area | Min height | Min height | Max height | Max height | Avg height | Avg height | Min width | Min width | Max width | Max width |
|---|---|---|---|---|---|---|---|---|---|---|---|---|---|---|
slug leaf rectangle | 2028 | 26.7% | 55.62% | 8.01% | 864px | 26.94% | 3343px | 84.25% | 2009px | 52.27% | 732px | 24.6% | 3082px | 91.7% |
spot leaf rectangle | 885 | 26.73% | 73.33% | 4.12% | 836px | 24.14% | 3773px | 95.09% | 2077px | 53.09% | 582px | 14.67% | 3882px | 77.45% |
pear rectangle | 734 | 10.29% | 31.07% | 0% | 7px | 0.18% | 3069px | 74.71% | 1326px | 37.27% | 27px | 0.91% | 2992px | 59.88% |
curl leaf rectangle | 63 | 17.47% | 44.51% | 3.76% | 574px | 16.61% | 4160px | 80.25% | 1860px | 46.4% | 607px | 11.98% | 3292px | 63.69% |
healthy leaf rectangle | 43 | 27.87% | 58.77% | 9.51% | 1275px | 33.87% | 3122px | 79.64% | 2144px | 55.38% | 811px | 27.25% | 2597px | 74.7% |
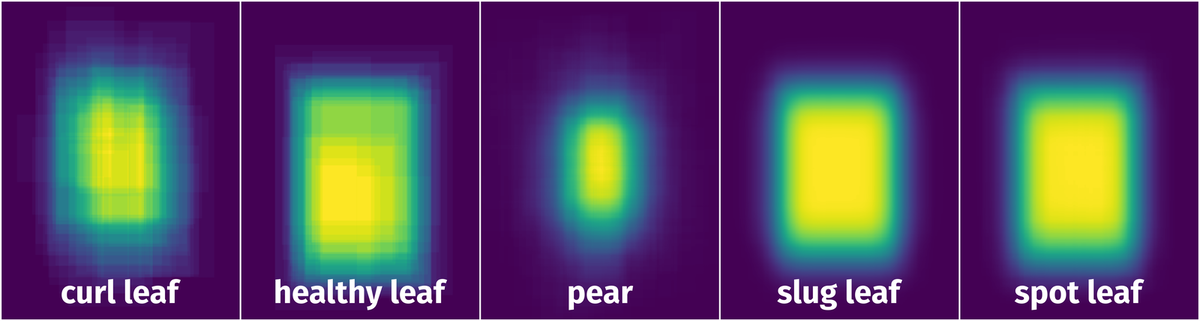
Spatial Heatmap #
The heatmaps below give the spatial distributions of all objects for every class. These visualizations provide insights into the most probable and rare object locations on the image. It helps analyze objects' placements in a dataset.
Objects #
Table contains all 3753 objects. Click a row to preview an image with annotations, and use search or pagination to navigate. Sort columns to find outliers in the dataset.
Object ID ㅤ | Class ㅤ | Image name click row to open | Image size height x width | Height ㅤ | Height ㅤ | Width ㅤ | Width ㅤ | Area ㅤ |
|---|---|---|---|---|---|---|---|---|
1➔ | slug leaf rectangle | u1711.jpg | 3968 x 2976 | 2401px | 60.51% | 1666px | 55.98% | 33.87% |
2➔ | curl leaf rectangle | u3117.jpg | 3456 x 5184 | 1775px | 51.36% | 1828px | 35.26% | 18.11% |
3➔ | slug leaf rectangle | u1623.jpg | 3968 x 2976 | 1801px | 45.39% | 1549px | 52.05% | 23.62% |
4➔ | slug leaf rectangle | u1519.jpg | 3968 x 2976 | 1891px | 47.66% | 1406px | 47.24% | 22.52% |
5➔ | slug leaf rectangle | u1478.jpg | 3968 x 2976 | 2487px | 62.68% | 1220px | 40.99% | 25.69% |
6➔ | slug leaf rectangle | u2286.jpg | 3968 x 2976 | 2340px | 58.97% | 1657px | 55.68% | 32.83% |
7➔ | pear rectangle | 234.jpg | 3456 x 5184 | 2137px | 61.83% | 1129px | 21.78% | 13.47% |
8➔ | slug leaf rectangle | u2417.jpg | 3968 x 2976 | 2375px | 59.85% | 1641px | 55.14% | 33% |
9➔ | slug leaf rectangle | u1782.jpg | 3968 x 2976 | 2367px | 59.65% | 1224px | 41.13% | 24.53% |
10➔ | spot leaf rectangle | u2118.jpg | 3968 x 2976 | 2406px | 60.64% | 1453px | 48.82% | 29.6% |
License #
Citation #
If you make use of the DiaMOS Plant data, please cite the following reference:
@dataset{gianni_fenu_2021_5557313,
  author       = {Gianni Fenu and
                  Francesca Maridina Malloci},
  title        = {{DiaMOS Plant Dataset: A Dataset for Diagnosis and
                   Monitoring Plant Disease}},
  month        = oct,
  year         = 2021,
  publisher    = {Zenodo},
  version      = 1,
  doi          = {10.5281/zenodo.5557313},
  url          = {https://doi.org/10.5281/zenodo.5557313}
}
If you are happy with Dataset Ninja and use provided visualizations and tools in your work, please cite us:
@misc{ visualization-tools-for-diamos-plant-dataset,
  title = { Visualization Tools for DiaMOS Plant Dataset },
  type = { Computer Vision Tools },
  author = { Dataset Ninja },
  howpublished = { \url{ https://datasetninja.com/diamos-plant } },
  url = { https://datasetninja.com/diamos-plant },
  journal = { Dataset Ninja },
  publisher = { Dataset Ninja },
  year = { 2026 },
  month = { aug },
  note = { visited on 2026-08-01 },
}
Download #
Dataset DiaMOS Plant can be downloaded in Supervisely format:
As an alternative, it can be downloaded with dataset-tools package:
pip install --upgrade dataset-tools
… using following python code:
import dataset_tools as dtools

dtools.download(dataset='DiaMOS Plant', dst_dir='~/dataset-ninja/')
Make sure not to overlook the python code example available on the Supervisely Developer Portal. It will give you a clear idea of how to effortlessly work with the downloaded dataset.
The data in original format can be downloaded here:
Disclaimer #
Our gal from the legal dep told us we need to post this:
Dataset Ninja provides visualizations and statistics for some datasets that can be found online and can be downloaded by general audience. Dataset Ninja is not a dataset hosting platform and can only be used for informational purposes. The platform does not claim any rights for the original content, including images, videos, annotations and descriptions. Joint publishing is prohibited.
You take full responsibility when you use datasets presented at Dataset Ninja, as well as other information, including visualizations and statistics we provide. You are in charge of compliance with any dataset license and all other permissions. You are required to navigate datasets homepage and make sure that you can use it. In case of any questions, get in touch with us at hello@datasetninja.com.