

Introduction #
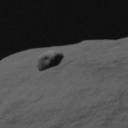
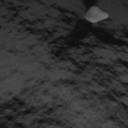
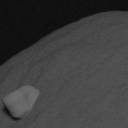
The authors provide the DOORS: Dataset fOr bOuldeRs Segmentation - the synthetic dataset about boulders on small space bodies. It is publicly available. The dataset is meticulously curated, with carefully crafted artificial environments designed to generate large quantities of synthetic labeled images showcasing boulders on small celestial bodies. Utilizing these artificially generated environments, two distinct datasets are formed, referred to as ds1 and ds2 for ease of reference. Although originally tailored for specific research objectives, these datasets possess the versatility to find utility across a spectrum of applications in diverse contexts.
Motivation
Data-driven Image Processing (IP) algorithms offer a precise, robust, and versatile alternative to traditional methods in vision-based applications concerning small objects. These algorithms find utility in navigation tasks and enable on-board autonomous capabilities.
However, the scarcity of publicly accessible labeled datasets, whether synthetic or obtained from real missions, presents a significant obstacle to the advancement of such algorithms. In the absence of these datasets, algorithm designers face two options: either creating one themselves or resorting to unsupervised learning methods. The former necessitates interdisciplinary skills, including the ability to generate realistic renderings in artificial environments, while the latter restricts the algorithm design space.
Nevertheless, developing a dataset generator is a complex endeavor that demands considerable effort, potentially diverting attention from algorithmic design. Furthermore, as exclusive access to artificial dataset generators confers strategic advantages in both industrial and research contexts, they are often kept proprietary. The same rationale applies to the datasets themselves.
Dataset creation
In the authors’ study, artificial environments are meticulously crafted to produce substantial volumes of synthetic labeled images featuring boulders on small celestial bodies. Blender is the chosen tool for this purpose, owing to its user-friendly interface, extensive prior adoption, robust support community, and open-source licensing. Leveraging these artificially generated environments, two distinct datasets are created, denoted as ds1 and ds2 for simplicity. While initially crafted for the specific research outlined, these datasets hold potential for broader applications across various contexts.
Pipeline used for the dataset generation.
The illumination conditions are defined by the orientation and intensity of the Sun’s lamp in Blender. The intensity is handled by a random uniform value I ∈ [35, 65]. For what concern the orientation, the light is constrained to be directed from the equatorial plane of the Blender reference frame. The angle between
the camera position’s vector projection on the equatorial plane and a line-of-sight vector on the equatorial plane generated by a random uniformly generated angle θs ∈ [−90, 90] is computed.
Example between a balanced and unbalanced distributions respectively of 5044 and 25000 samples.
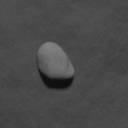
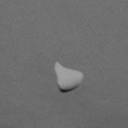
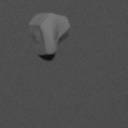
Using the Rock Generator add-on in Blender, a set of 30 boulder archetype shapes is generated. These are divided into three classes defined within the Rock Generator add-on, characterized by different default settings. These are the ice, river, asteroid classes. For each sample, one of the 30 boulders is randomly selected with a uniform random sample ID ∈ [0, 29] and positioned in the origin of the reference frame.
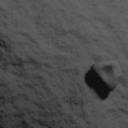
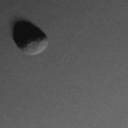
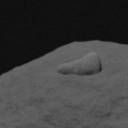
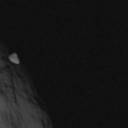
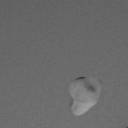
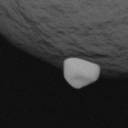
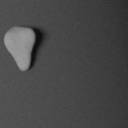
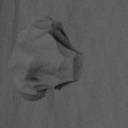
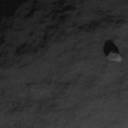
The 30 archetype shapes that represent single instances of boulders in ds1. From top to bottom the ice, river, and asteroid classes are shown.
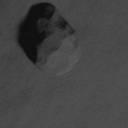
The rendering process involves iterating through the different rows of each input file. By assigning distinct pass indices to the surface and boulders and employing Cycles as the rendering engine, its advanced ray-tracing capabilities facilitate the generation of grayscale images along with their corresponding ground truth masks delineating surface and boulders. By incorporating these masks with the specified illumination conditions, masks with shadows can also be generated for both the boulder and surface layers. Throughout rendering, the image-masks sets are produced at a resolution of 256×256 pixels. However, a post-processing pipeline is implemented to execute random cropping and introduce artificial noise.
Post-processing pipeline used in ds1.
Post-processing pipeline used in ds2.
 Homepage
 Research Paper
Summary #
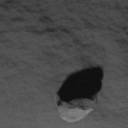
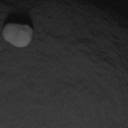
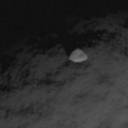
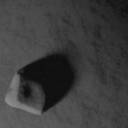
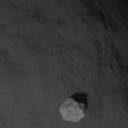
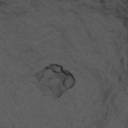
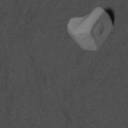
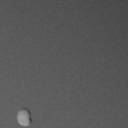
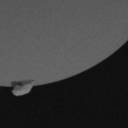
DOORS: Dataset fOr bOuldeRs Segmentation is a dataset for semantic segmentation and object detection tasks. It is used in the space research, and in the safety industry.
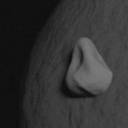
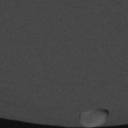
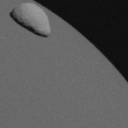
The dataset consists of 80452 images with 80345 labeled objects belonging to 1 single class (boulder).
Images in the DOORS dataset have pixel-level semantic segmentation annotations. There are 107 (0% of the total) unlabeled images (i.e. without annotations). There are 8 splits in the dataset: ds1 train (30181 images), ds2 train (20095 images), ds1 test1 (5044 images), ds1 val (5044 images), ds2 test1 (5044 images), ds2 val (5044 images), ds1 test2 (5000 images), and ds2 test2 (5000 images). Alternatively, the dataset could be split into 5 rendering params: albedo of the boulder (45269 images), albedo of the surface (45269 images), boulder id (45269 images), boulder scale (45269 images), and intensity of the sun (45269 images). The dataset was released in 2022 by the Department of Aerospace Science and Technology, Italy.
Explore #
DOORS dataset has 80452 images. Click on one of the examples below or open "Explore" tool anytime you need to view dataset images with annotations. This tool has extended visualization capabilities like zoom, translation, objects table, custom filters and more. Hover the mouse over the images to hide or show annotations.


Class balance #
There are 1 annotation classes in the dataset. Find the general statistics and balances for every class in the table below. Click any row to preview images that have labels of the selected class. Sort by column to find the most rare or prevalent classes.

Class ㅤ | Images ㅤ | Objects ㅤ | Count on image average | Area on image average |
|---|---|---|---|---|
boulder➔ mask | 80345 | 80345 | 1 | 14.35% |
Images #
Explore every single image in the dataset with respect to the number of annotations of each class it has. Click a row to preview selected image. Sort by any column to find anomalies and edge cases. Use horizontal scroll if the table has many columns for a large number of classes in the dataset.
Object distribution #
Interactive heatmap chart for every class with object distribution shows how many images are in the dataset with a certain number of objects of a specific class. Users can click cell and see the list of all corresponding images.
Class sizes #
The table below gives various size properties of objects for every class. Click a row to see the image with annotations of the selected class. Sort columns to find classes with the smallest or largest objects or understand the size differences between classes.
Class | Object count | Avg area | Max area | Min area | Min height | Min height | Max height | Max height | Avg height | Avg height | Min width | Min width | Max width | Max width |
|---|---|---|---|---|---|---|---|---|---|---|---|---|---|---|
boulder mask | 80345 | 14.35% | 69.7% | 0.01% | 1px | 0.78% | 128px | 100% | 72px | 55.95% | 1px | 0.78% | 128px | 100% |
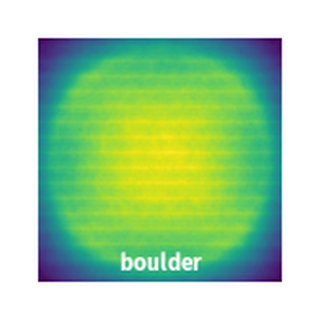
Spatial Heatmap #
The heatmaps below give the spatial distributions of all objects for every class. These visualizations provide insights into the most probable and rare object locations on the image. It helps analyze objects' placements in a dataset.
Objects #
Table contains all 80345 objects. Click a row to preview an image with annotations, and use search or pagination to navigate. Sort columns to find outliers in the dataset.
Object ID ㅤ | Class ㅤ | Image name click row to open | Image size height x width | Height ㅤ | Height ㅤ | Width ㅤ | Width ㅤ | Area ㅤ |
|---|---|---|---|---|---|---|---|---|
1➔ | boulder mask | DS1_TR_003064.png | 128 x 128 | 30px | 23.44% | 42px | 32.81% | 5.41% |
2➔ | boulder mask | DS1_TR_016447.png | 128 x 128 | 15px | 11.72% | 10px | 7.81% | 0.56% |
3➔ | boulder mask | DS1_TR_003519.png | 128 x 128 | 24px | 18.75% | 27px | 21.09% | 3.15% |
4➔ | boulder mask | DS1_TR_028134.png | 128 x 128 | 20px | 15.62% | 14px | 10.94% | 1.25% |
5➔ | boulder mask | DS1_TR_018005.png | 128 x 128 | 16px | 12.5% | 27px | 21.09% | 1.43% |
6➔ | boulder mask | DS1_TR_017690.png | 128 x 128 | 12px | 9.38% | 12px | 9.38% | 0.48% |
7➔ | boulder mask | DS1_TR_003824.png | 128 x 128 | 17px | 13.28% | 23px | 17.97% | 1.32% |
8➔ | boulder mask | DS1_TR_029217.png | 128 x 128 | 15px | 11.72% | 19px | 14.84% | 1.34% |
9➔ | boulder mask | DS1_TR_021474.png | 128 x 128 | 23px | 17.97% | 36px | 28.12% | 3.77% |
10➔ | boulder mask | DS1_TR_018245.png | 128 x 128 | 27px | 21.09% | 21px | 16.41% | 2.15% |
License #
Citation #
If you make use of the Doors data, please cite the following reference:
@dataset{mattia_pugliatti_2022_7107409,
  author       = {Mattia Pugliatti and
                  Francesco Topputo},
  title        = {DOORS: Dataset fOr bOuldeRs Segmentation},
  month        = oct,
  year         = 2022,
  publisher    = {Zenodo},
  version      = {1.0},
  doi          = {10.5281/zenodo.7107409},
  url          = {https://doi.org/10.5281/zenodo.7107409}
}
If you are happy with Dataset Ninja and use provided visualizations and tools in your work, please cite us:
@misc{ visualization-tools-for-doors-dataset,
  title = { Visualization Tools for DOORS Dataset },
  type = { Computer Vision Tools },
  author = { Dataset Ninja },
  howpublished = { \url{ https://datasetninja.com/doors } },
  url = { https://datasetninja.com/doors },
  journal = { Dataset Ninja },
  publisher = { Dataset Ninja },
  year = { 2026 },
  month = { jul },
  note = { visited on 2026-07-23 },
}
Download #
Dataset DOORS can be downloaded in Supervisely format:
As an alternative, it can be downloaded with dataset-tools package:
pip install --upgrade dataset-tools
… using following python code:
import dataset_tools as dtools

dtools.download(dataset='DOORS', dst_dir='~/dataset-ninja/')
Make sure not to overlook the python code example available on the Supervisely Developer Portal. It will give you a clear idea of how to effortlessly work with the downloaded dataset.
The data in original format can be downloaded here.
Disclaimer #
Our gal from the legal dep told us we need to post this:
Dataset Ninja provides visualizations and statistics for some datasets that can be found online and can be downloaded by general audience. Dataset Ninja is not a dataset hosting platform and can only be used for informational purposes. The platform does not claim any rights for the original content, including images, videos, annotations and descriptions. Joint publishing is prohibited.
You take full responsibility when you use datasets presented at Dataset Ninja, as well as other information, including visualizations and statistics we provide. You are in charge of compliance with any dataset license and all other permissions. You are required to navigate datasets homepage and make sure that you can use it. In case of any questions, get in touch with us at hello@datasetninja.com.