

Introduction #
The EBHI-Seg: Enteroscope Biopsy Histopathological Hematoxylin and Eosin Image Dataset for Image Segmentation Tasks contains 2228 electron microscopic images of histopathological colorectal cancer sections that encompass six tumor differentiation stages: normal, polyp, low-grade intraepithelial neoplasia, high-grade intraepithelial neoplasia, serrated adenoma, and adenocarcinoma.
Colon cancer is a common deadly malignant tumor, the fourth most common cancer in men, and the third most common cancer in women worldwide. Colon cancer is responsible for 10% of all cancer cases. According to prior research, colon and rectal tumors share many of the same or similar characteristics. Hence, they are often classified collectively. The authors’ study categorizes rectal and colon cancers into one colorectal cancer category. Histopathological examination of the intestinal tract is both the gold standard for the diagnosis of colorectal cancer and a prerequisite for disease treatment.
The intestinal biopsy method, employed to extract a portion of intestinal tissue for histopathological analysis in order to ascertain the patient’s true condition, offers the notable advantage of significantly minimizing bodily harm and promoting swift wound healing. Subsequently, the histopathology sample undergoes segmentation and processing with Hematoxylin and Eosin (H&E). The application of H&E is a standard technique for staining tissue sections, revealing nuances between the nucleus and cytoplasm and accentuating intricate structures within tissues.
During colon examinations, pathologists initially scrutinize histopathological sections to assess eligibility and pinpoint lesion locations. The pathology sections are subsequently examined and diagnosed using a low-magnification microscope. Should a closer examination be required to observe finer structures, the microscope is adjusted for higher magnification to facilitate further analysis. Nevertheless, the diagnostic process often encounters certain challenges: varying diagnostic outcomes due to subjective interpretations by different physicians, the potential oversight of information amid extensive test data, and the difficulty in effectively analyzing large volumes of previously collected data. Hence, there is a pressing need to address these issues comprehensively.
Dataset description
The dataset comprises a total of 4,456 histopathology images, featuring 2,228 histopathology section images and an equal number of corresponding ground truth images. These encompass various categories, including normal (76 images and 76 ground truth images), polyp (474 images and 474 ground truth images), low-grade intraepithelial neoplasia (639 images and 639 ground truth images), high-grade intraepithelial neoplasia (186 images and 186 ground truth images), serrated adenoma (58 images and 58 ground truth images), and adenocarcinoma (795 images and 795 ground truth images).
The dataset’s source is the H&E-treated histopathological sections of colon tissues, utilized for assessing image segmentation. Acquired from two histopathologists at the Cancer Hospital of China Medical University, the dataset is meticulously curated by 12 biomedical researchers following specific guidelines. In cases where an image contains a single differentiation stage and the remainder of the image is intact, that differentiation stage is assigned as the image label. If multiple differentiation stages are present, the most conspicuous one is selected as the image label. In general, the image label reflects the most severe and prominent differentiation observed.
The dataset is derived from intestinal biopsies, employing a magnification of 400× for the data slices, with an eyepiece magnification of 10× and an objective magnification of 40×. The imaging process utilizes a Nissan Olympus microscope and NewUsbCamera acquisition software. The image input size is standardized at 224 × 224 pixels, and the file format is *.png.
Dataset classes description
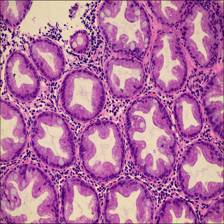
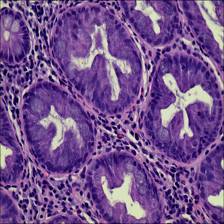
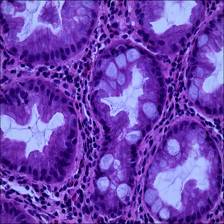
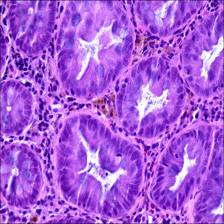
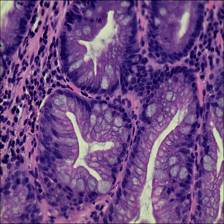
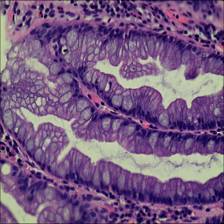
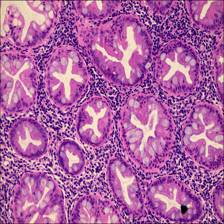
- Normal Colorectal tissue sections of the standard category are made-up of consistently ordered tubular structures and that does not appear infected when viewed under a light microscope.
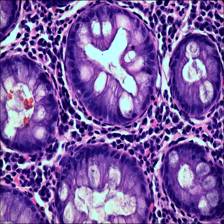
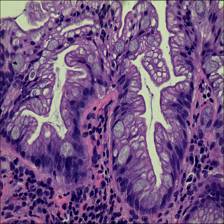
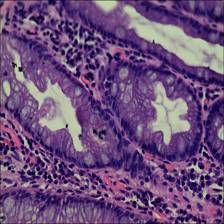
- Polyp Colorectal polyps are similar in shape to the structures in the normal category, but have a completely different histological structure. A polyp is a redundant mass that grows on the surface of the body’s cells. Modern medicine usually refers to polyps as unwanted growths on the mucosal surface of the body. The pathological section of the polyp category also has an intact luminal structure with essentially no nuclear division of the cells. Only the atomic mass is slightly higher than that in the normal category.
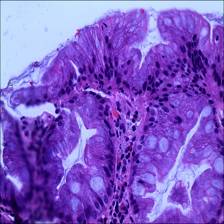
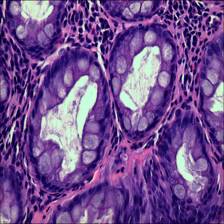
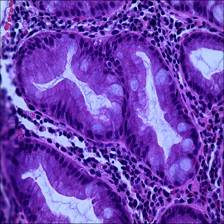
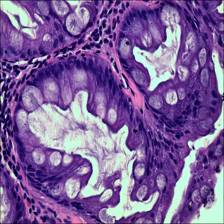
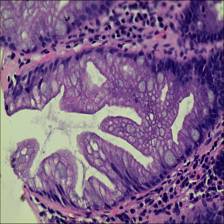
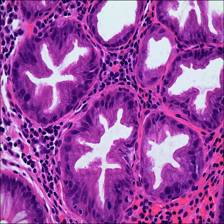
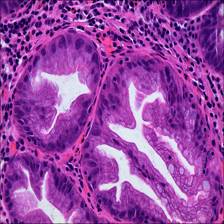
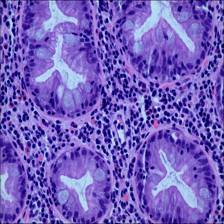
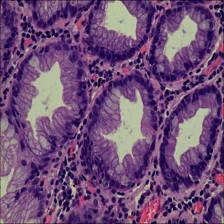
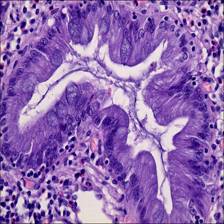
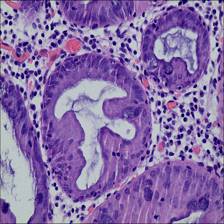
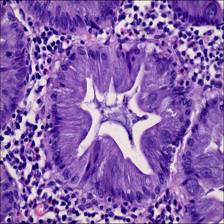
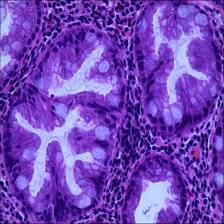
- Intraepithelial neoplasia Intraepithelial neoplasia (IN) is the most critical precancerous lesion. Compared to the normal category, its histological images show increased branching of adenoid structures, dense arrangement, and different luminal sizes and shapes. In terms of cellular morphology, the nuclei are enlarged and vary in size, while nuclear division increases. The standard Padova classification currently classifies intraepithelial neoplasia into low-grade and high-grade INs. High-grade IN demonstrate more pronounced structural changes in the lumen and nuclear enlargement compared to low-grade IN.
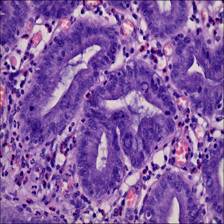
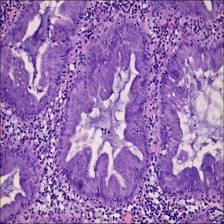
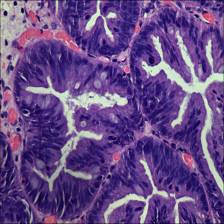
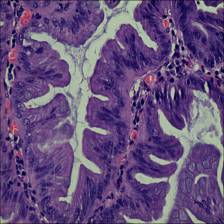
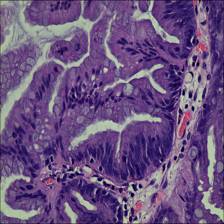
- Adenocarcinoma Adenocarcinoma is a malignant digestive tract tumor with a very irregular distribution of luminal structures. It is difficult to identify its border structures during observation, and the nuclei are significantly enlarged at this stage.
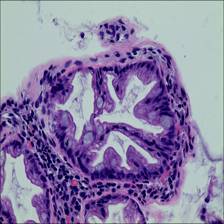
- Serrated adenoma Serrated adenomas are uncommon lesions, accounting for 1% of all colonic polyps. The endoscopic surface appearance of serrated adenomas is not well characterized but is thought to be similar to that of colonic adenomas with tubular or cerebral crypt openings.
An example of histopathological images database. (A) Normal and ground truth, (B) Polyp and ground truth, (C) High-grade Intraepithelial Neoplasia and ground truth, (D) Low-grade Intraepithelial Neoplasia and ground truth, (E) Adenocarcinoma and ground truth, and (F) Serrated adenoma and ground truth.
 Homepage
 Research Paper
Summary #
EBHI-Seg: Enteroscope Biopsy Histopathological Hematoxylin and Eosin Image Dataset for Image Segmentation Tasks is a dataset for instance segmentation, semantic segmentation, and object detection tasks. It is used in the medical industry.
The dataset consists of 2228 images with 12985 labeled objects belonging to 6 different classes including andadenocarcinoma, low-grade intraepithelial neoplasia, polyp, and other: high-grade intraepithelial neoplasia, normal, and serrated adenoma.
Images in the EBHI-Seg dataset have pixel-level instance segmentation annotations. Due to the nature of the instance segmentation task, it can be automatically transformed into a semantic segmentation (only one mask for every class) or object detection (bounding boxes for every object) tasks. There are 2 (0% of the total) unlabeled images (i.e. without annotations). There are no pre-defined train/val/test splits in the dataset. The dataset was released in 11 by the MIaMIA research group, China.
Here are the visualized examples for the classes:
Explore #
EBHI-Seg dataset has 2228 images. Click on one of the examples below or open "Explore" tool anytime you need to view dataset images with annotations. This tool has extended visualization capabilities like zoom, translation, objects table, custom filters and more. Hover the mouse over the images to hide or show annotations.


Class balance #
There are 6 annotation classes in the dataset. Find the general statistics and balances for every class in the table below. Click any row to preview images that have labels of the selected class. Sort by column to find the most rare or prevalent classes.

Class ㅤ | Images ㅤ | Objects ㅤ | Count on image average | Area on image average |
|---|---|---|---|---|
andadenocarcinoma➔ mask | 795 | 2545 | 3.2 | 68.83% |
low-grade intraepithelial neoplasia➔ mask | 637 | 4285 | 6.73 | 68.08% |
polyp➔ mask | 474 | 4234 | 8.93 | 56.18% |
high-grade intraepithelial neoplasia➔ mask | 186 | 797 | 4.28 | 70.85% |
normal➔ mask | 76 | 771 | 10.14 | 63.63% |
serrated adenoma➔ mask | 58 | 353 | 6.09 | 65.77% |
Co-occurrence matrix #
Co-occurrence matrix is an extremely valuable tool that shows you the images for every pair of classes: how many images have objects of both classes at the same time. If you click any cell, you will see those images. We added the tooltip with an explanation for every cell for your convenience, just hover the mouse over a cell to preview the description.
Images #
Explore every single image in the dataset with respect to the number of annotations of each class it has. Click a row to preview selected image. Sort by any column to find anomalies and edge cases. Use horizontal scroll if the table has many columns for a large number of classes in the dataset.
Object distribution #
Interactive heatmap chart for every class with object distribution shows how many images are in the dataset with a certain number of objects of a specific class. Users can click cell and see the list of all corresponding images.
Class sizes #
The table below gives various size properties of objects for every class. Click a row to see the image with annotations of the selected class. Sort columns to find classes with the smallest or largest objects or understand the size differences between classes.
Class | Object count | Avg area | Max area | Min area | Min height | Min height | Max height | Max height | Avg height | Avg height | Min width | Min width | Max width | Max width |
|---|---|---|---|---|---|---|---|---|---|---|---|---|---|---|
low-grade intraepithelial neoplasia mask | 4285 | 10.12% | 90.82% | 0.06% | 6px | 2.68% | 224px | 100% | 83px | 37.25% | 2px | 0.89% | 224px | 100% |
polyp mask | 4234 | 6.29% | 63.46% | 0.06% | 1px | 0.45% | 224px | 100% | 70px | 31.03% | 3px | 1.34% | 224px | 100% |
andadenocarcinoma mask | 2545 | 21.5% | 100% | 0.06% | 1px | 0.45% | 224px | 100% | 109px | 48.56% | 1px | 0.45% | 224px | 100% |
high-grade intraepithelial neoplasia mask | 797 | 16.54% | 91.55% | 0.06% | 1px | 0.45% | 224px | 100% | 106px | 47.4% | 1px | 0.45% | 224px | 100% |
normal mask | 771 | 6.27% | 72.13% | 0.07% | 5px | 2.23% | 224px | 100% | 69px | 30.97% | 4px | 1.79% | 224px | 100% |
serrated adenoma mask | 353 | 10.81% | 76.6% | 0.09% | 7px | 3.12% | 224px | 100% | 88px | 39.37% | 1px | 0.45% | 224px | 100% |
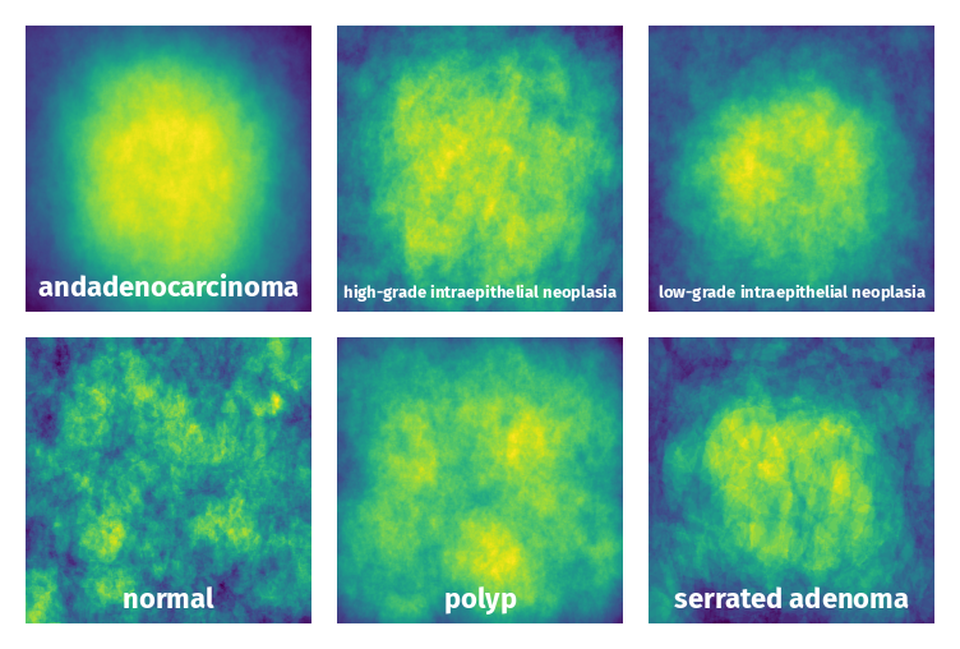
Spatial Heatmap #
The heatmaps below give the spatial distributions of all objects for every class. These visualizations provide insights into the most probable and rare object locations on the image. It helps analyze objects' placements in a dataset.
Objects #
Table contains all 12985 objects. Click a row to preview an image with annotations, and use search or pagination to navigate. Sort columns to find outliers in the dataset.
Object ID ㅤ | Class ㅤ | Image name click row to open | Image size height x width | Height ㅤ | Height ㅤ | Width ㅤ | Width ㅤ | Area ㅤ |
|---|---|---|---|---|---|---|---|---|
1➔ | low-grade intraepithelial neoplasia mask | Low-grade IN_GTXC2012096-2-400-002.png | 224 x 224 | 57px | 25.45% | 80px | 35.71% | 5.79% |
2➔ | low-grade intraepithelial neoplasia mask | Low-grade IN_GTXC2012096-2-400-002.png | 224 x 224 | 185px | 82.59% | 170px | 75.89% | 37.54% |
3➔ | low-grade intraepithelial neoplasia mask | Low-grade IN_GTXC2012096-2-400-002.png | 224 x 224 | 51px | 22.77% | 15px | 6.7% | 1.18% |
4➔ | low-grade intraepithelial neoplasia mask | Low-grade IN_GTXC2012096-2-400-002.png | 224 x 224 | 135px | 60.27% | 16px | 7.14% | 2.37% |
5➔ | low-grade intraepithelial neoplasia mask | Low-grade IN_GTXC2012096-2-400-002.png | 224 x 224 | 50px | 22.32% | 12px | 5.36% | 0.79% |
6➔ | low-grade intraepithelial neoplasia mask | Low-grade IN_GTXC2012096-2-400-002.png | 224 x 224 | 45px | 20.09% | 10px | 4.46% | 0.65% |
7➔ | low-grade intraepithelial neoplasia mask | Low-grade IN_GTXC2012096-2-400-002.png | 224 x 224 | 30px | 13.39% | 176px | 78.57% | 5.75% |
8➔ | polyp mask | Polyp_GTxc2014153-1-400-003.png | 224 x 224 | 77px | 34.38% | 86px | 38.39% | 9.07% |
9➔ | polyp mask | Polyp_GTxc2014153-1-400-003.png | 224 x 224 | 78px | 34.82% | 74px | 33.04% | 8.99% |
10➔ | polyp mask | Polyp_GTxc2014153-1-400-003.png | 224 x 224 | 67px | 29.91% | 50px | 22.32% | 5.34% |
License #
Citation #
If you make use of the EBHI-Seg data, please cite the following reference:
@article{Group2022,
  author = "MIaMIA Group",
  title = "{EBHI-SEG}",
  year = "2022",
  month = "11",
  url = "https://figshare.com/articles/dataset/EBHI-SEG/21540159",
  doi = "10.6084/m9.figshare.21540159.v1"
}
If you are happy with Dataset Ninja and use provided visualizations and tools in your work, please cite us:
@misc{ visualization-tools-for-ebhi-seg-dataset,
  title = { Visualization Tools for EBHI-Seg Dataset },
  type = { Computer Vision Tools },
  author = { Dataset Ninja },
  howpublished = { \url{ https://datasetninja.com/ebhi-seg } },
  url = { https://datasetninja.com/ebhi-seg },
  journal = { Dataset Ninja },
  publisher = { Dataset Ninja },
  year = { 2026 },
  month = { jul },
  note = { visited on 2026-07-25 },
}
Download #
Dataset EBHI-Seg can be downloaded in Supervisely format:
As an alternative, it can be downloaded with dataset-tools package:
pip install --upgrade dataset-tools
… using following python code:
import dataset_tools as dtools

dtools.download(dataset='EBHI-Seg', dst_dir='~/dataset-ninja/')
Make sure not to overlook the python code example available on the Supervisely Developer Portal. It will give you a clear idea of how to effortlessly work with the downloaded dataset.
The data in original format can be downloaded here.
Disclaimer #
Our gal from the legal dep told us we need to post this:
Dataset Ninja provides visualizations and statistics for some datasets that can be found online and can be downloaded by general audience. Dataset Ninja is not a dataset hosting platform and can only be used for informational purposes. The platform does not claim any rights for the original content, including images, videos, annotations and descriptions. Joint publishing is prohibited.
You take full responsibility when you use datasets presented at Dataset Ninja, as well as other information, including visualizations and statistics we provide. You are in charge of compliance with any dataset license and all other permissions. You are required to navigate datasets homepage and make sure that you can use it. In case of any questions, get in touch with us at hello@datasetninja.com.