

Introduction #
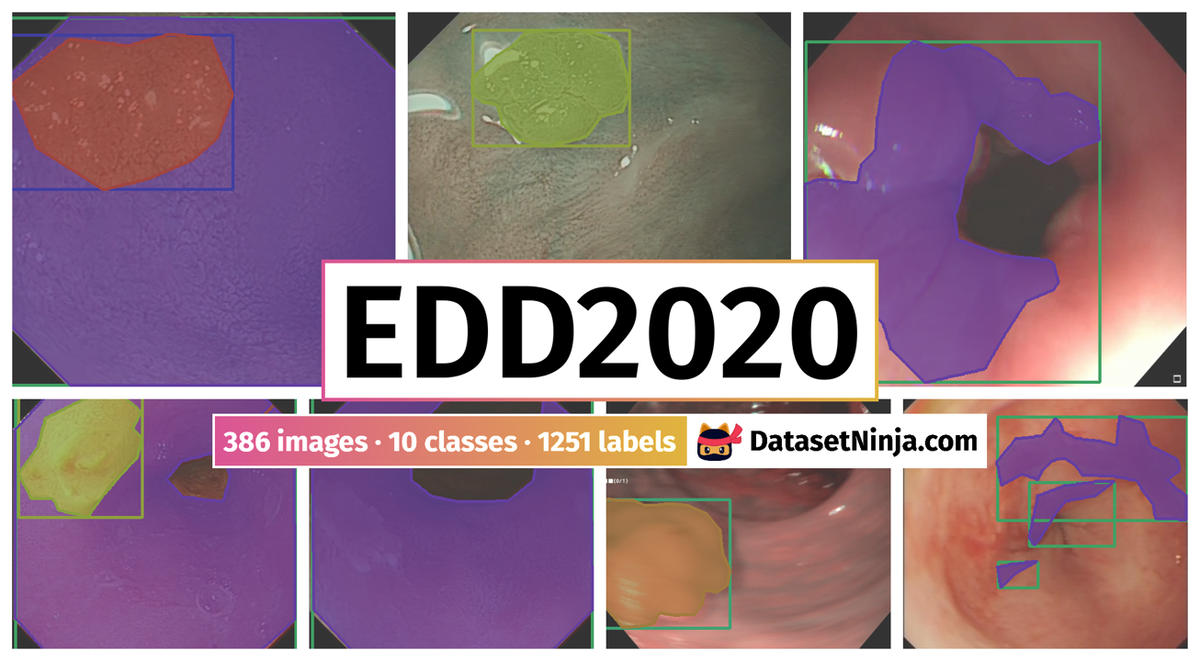
The EDD2020: Endoscopy Disease Detection and Segmentation dataset comprises 380 annotated video frames sourced from various international centers, encompassing different gastrointestinal tract organs and endoscopy modalities. The dataset addresses multiple organ categories, such as the colon, esophagus, and stomach, each linked to specific diseases. EDD2020 includes five classes for both detection and segmentation tasks, with a focus on gastrointestinal organs. Patient data has been anonymized and collected with informed consent, while annotations were performed by clinical experts and post-doctoral researchers, accounting for some variability in annotations due to the subjective nature of interpretation.
Endoscopy is crucial for early cancer detection in organs like the esophagus, stomach, colon, and bladder. Accurate localization and segmentation of diseased regions in clinical endoscopy videos are vital for precise diagnosis and surgical planning. Publicly available datasets for disease detection in endoscopy have been historically limited in scope, often concentrating on specific tasks and imaging modalities.
The authors introduce the EDD2020 challenge, which encompasses multi-class, multi-organ, and multi-population disease detection and segmentation in clinical endoscopy. The challenge evaluates disease region localization using bounding boxes and precise pixel-level segmentation, with a strong emphasis on clinical applicability for real-time monitoring and offline performance assessment. Their network of clinical and computational experts collaboratively gathered, curated, and annotated gastrointestinal endoscopy video frames. Released as part of the EDD2020 challenge, this dataset aims to overcome limitations in disease detection and segmentation. The EDD2020 initiative represents a crowd-sourced effort to assess recent deep learning methods and foster robust technology development.
The dataset in question features the following classes:
- BE (Barrett’s Oesophagus)
- suspicious
- HGD (high-grade dysplasia)
- cancer (adenocarcinoma)
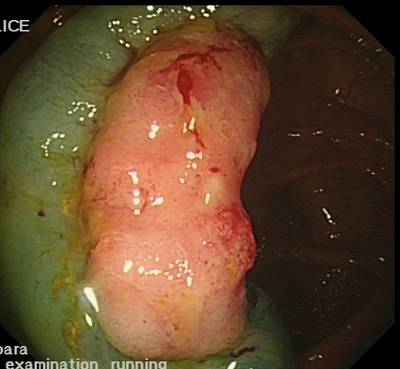
- polyp
 Homepage
 Research Paper
 GitHubIEEE
Summary #
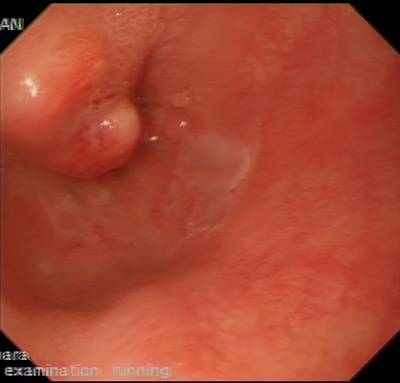
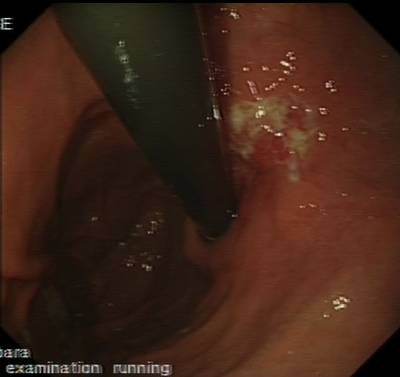
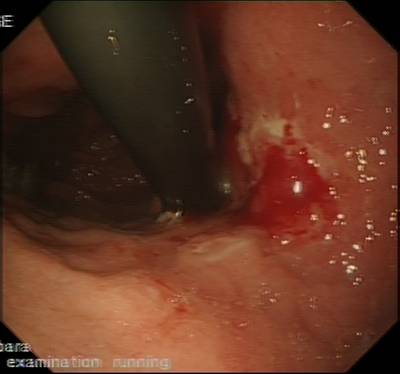
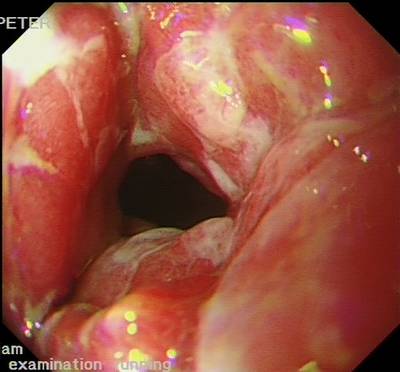
EDD2020: Endoscopy Disease Detection and Segmentation is a dataset for instance segmentation, semantic segmentation, and object detection tasks. It is used in the medical industry.
The dataset consists of 386 images with 1251 labeled objects belonging to 10 different classes including BE_bbox, BE, polyp_bbox, and other: polyp, suspicious_bbox, suspicious, HGD_bbox, HGD, cancer_bbox, and cancer.
Images in the EDD2020 dataset have pixel-level instance segmentation and bounding box annotations. Due to the nature of the instance segmentation task, it can be automatically transformed into a semantic segmentation task (only one mask for every class). All images are labeled (i.e. with annotations). There are no pre-defined train/val/test splits in the dataset. The dataset was released in 2020 by the UK-IT-FR joint research team.
Explore #
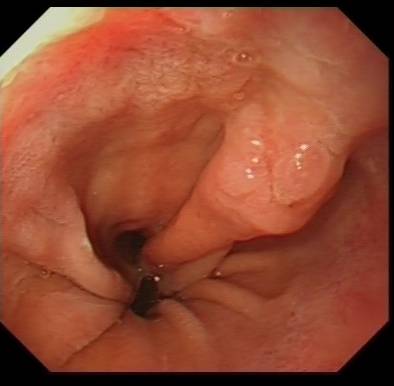
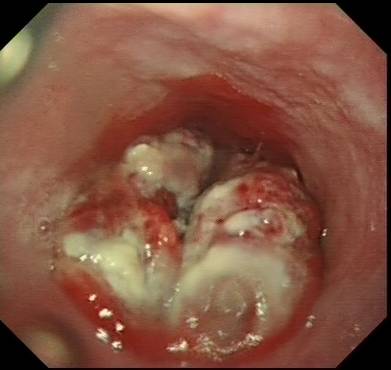
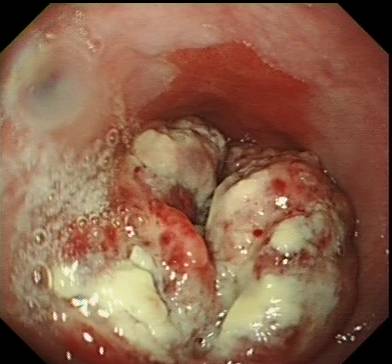
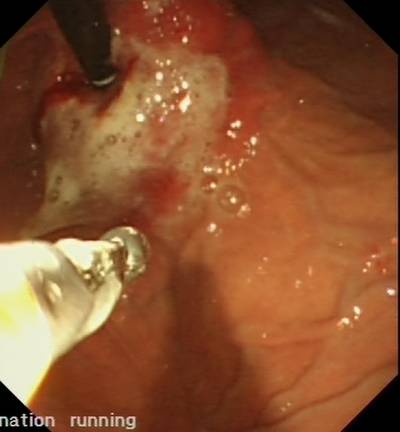
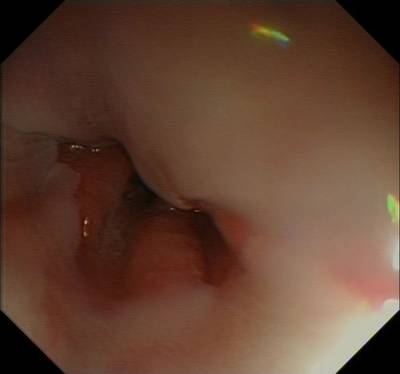
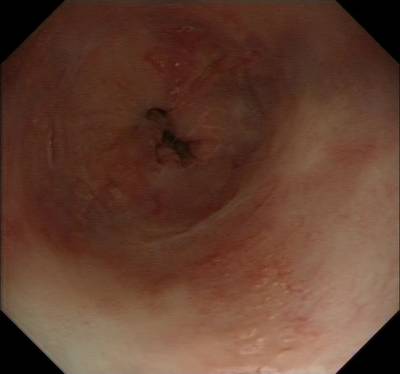
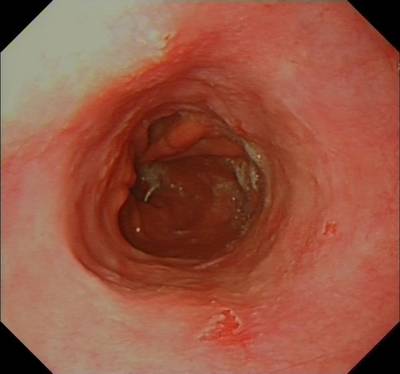
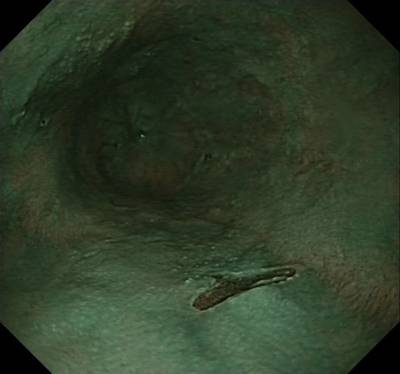
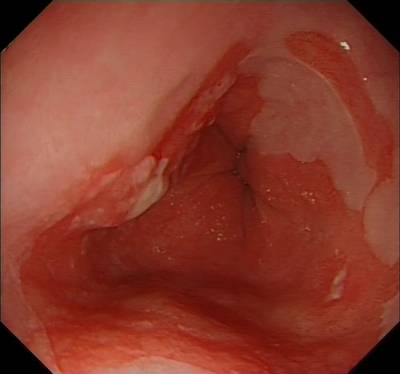
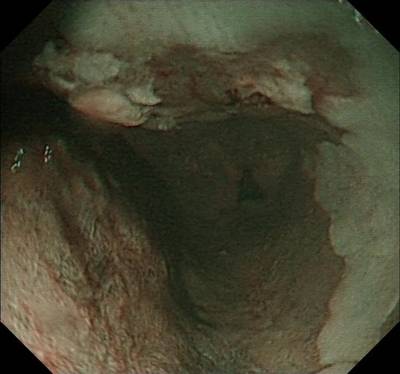
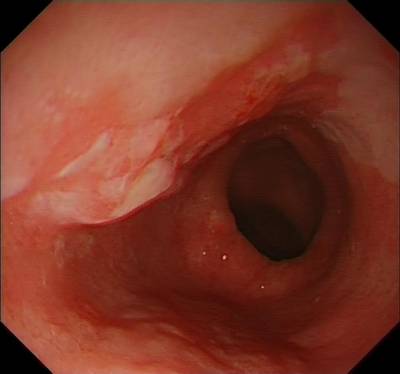
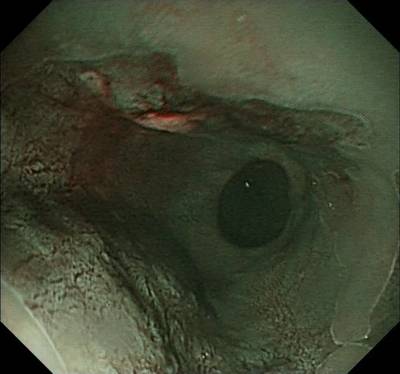
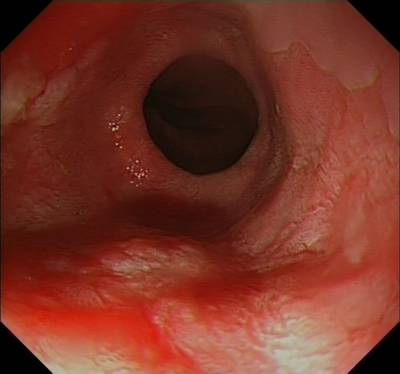
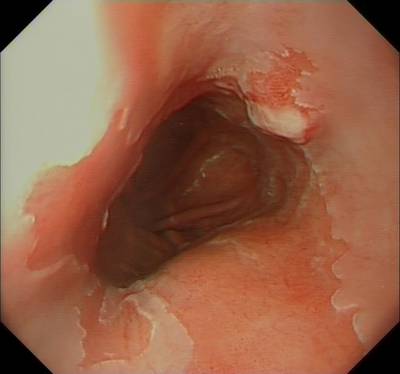
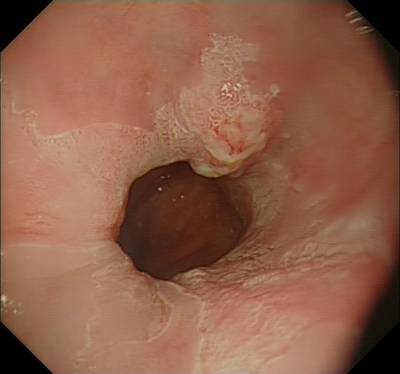
EDD2020 dataset has 386 images. Click on one of the examples below or open "Explore" tool anytime you need to view dataset images with annotations. This tool has extended visualization capabilities like zoom, translation, objects table, custom filters and more. Hover the mouse over the images to hide or show annotations.


Class balance #
There are 10 annotation classes in the dataset. Find the general statistics and balances for every class in the table below. Click any row to preview images that have labels of the selected class. Sort by column to find the most rare or prevalent classes.

Class ㅤ | Images ㅤ | Objects ㅤ | Count on image average | Area on image average |
|---|---|---|---|---|
BE_bbox➔ rectangle | 160 | 286 | 1.79 | 66.51% |
BE➔ mask | 160 | 160 | 1 | 42.18% |
polyp_bbox➔ rectangle | 127 | 228 | 1.8 | 29.34% |
polyp➔ mask | 127 | 127 | 1 | 20.2% |
suspicious_bbox➔ rectangle | 88 | 98 | 1.11 | 19.08% |
suspicious➔ mask | 88 | 88 | 1 | 12.33% |
HGD_bbox➔ rectangle | 74 | 80 | 1.08 | 23.15% |
HGD➔ mask | 74 | 74 | 1 | 15.17% |
cancer_bbox➔ rectangle | 53 | 57 | 1.08 | 30.29% |
cancer➔ mask | 53 | 53 | 1 | 19.18% |
Co-occurrence matrix #
Co-occurrence matrix is an extremely valuable tool that shows you the images for every pair of classes: how many images have objects of both classes at the same time. If you click any cell, you will see those images. We added the tooltip with an explanation for every cell for your convenience, just hover the mouse over a cell to preview the description.
Images #
Explore every single image in the dataset with respect to the number of annotations of each class it has. Click a row to preview selected image. Sort by any column to find anomalies and edge cases. Use horizontal scroll if the table has many columns for a large number of classes in the dataset.
Object distribution #
Interactive heatmap chart for every class with object distribution shows how many images are in the dataset with a certain number of objects of a specific class. Users can click cell and see the list of all corresponding images.
Class sizes #
The table below gives various size properties of objects for every class. Click a row to see the image with annotations of the selected class. Sort columns to find classes with the smallest or largest objects or understand the size differences between classes.
Class | Object count | Avg area | Max area | Min area | Min height | Min height | Max height | Max height | Avg height | Avg height | Min width | Min width | Max width | Max width |
|---|---|---|---|---|---|---|---|---|---|---|---|---|---|---|
BE_bbox rectangle | 286 | 38.11% | 99.2% | 0.11% | 7px | 1.97% | 511px | 99.61% | 249px | 53.17% | 11px | 2.14% | 512px | 99.61% |
polyp_bbox rectangle | 228 | 16.78% | 97.75% | 0.14% | 15px | 3.01% | 1066px | 98.83% | 337px | 34.05% | 20px | 2.67% | 1356px | 99.48% |
BE mask | 160 | 42.18% | 93.01% | 0.36% | 51px | 9.94% | 511px | 99.61% | 389px | 82.97% | 20px | 3.89% | 512px | 99.61% |
polyp mask | 127 | 20.2% | 82.64% | 0.26% | 80px | 12.5% | 1066px | 99.71% | 552px | 54.7% | 72px | 6.44% | 1356px | 99.65% |
suspicious_bbox rectangle | 98 | 17.26% | 98.41% | 0.54% | 50px | 10.42% | 1035px | 99.38% | 267px | 40.79% | 24px | 4.67% | 983px | 99.03% |
suspicious mask | 88 | 12.33% | 52.32% | 1.2% | 50px | 10.42% | 1035px | 99.38% | 292px | 44.51% | 54px | 10.51% | 983px | 99.03% |
HGD_bbox rectangle | 80 | 21.61% | 80.9% | 0.32% | 24px | 4.68% | 782px | 91.81% | 300px | 44.96% | 35px | 6.82% | 858px | 98.05% |
HGD mask | 74 | 15.17% | 53.48% | 1.49% | 65px | 13.54% | 782px | 91.81% | 318px | 47.48% | 67px | 13.06% | 858px | 98.44% |
cancer_bbox rectangle | 57 | 28.61% | 93.33% | 1.68% | 63px | 13.12% | 880px | 98.34% | 290px | 50.84% | 60px | 11.67% | 947px | 96.59% |
cancer mask | 53 | 19.18% | 54.25% | 1.54% | 69px | 14.38% | 880px | 98.8% | 299px | 51.86% | 118px | 17.5% | 947px | 96.59% |
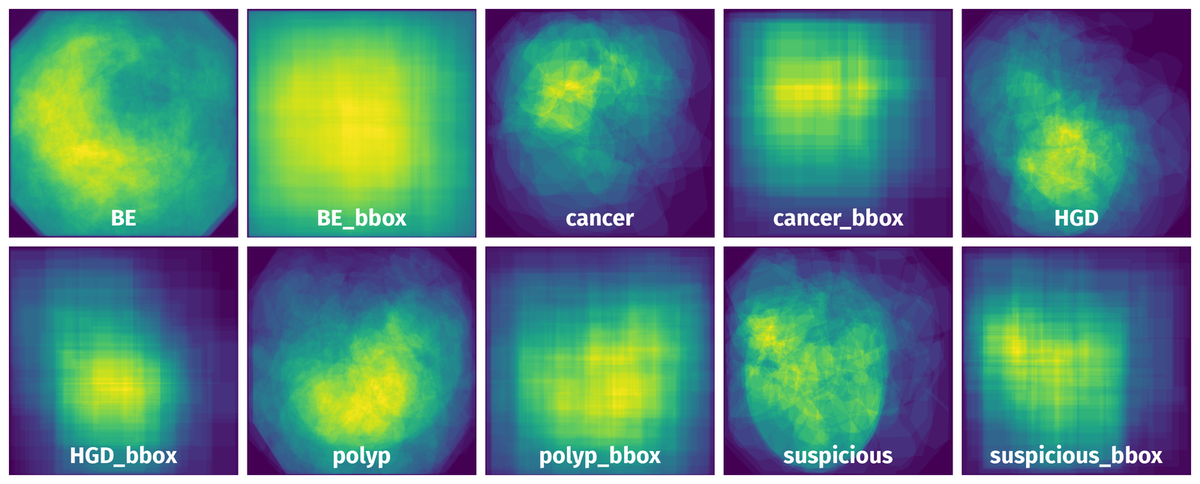
Spatial Heatmap #
The heatmaps below give the spatial distributions of all objects for every class. These visualizations provide insights into the most probable and rare object locations on the image. It helps analyze objects' placements in a dataset.
Objects #
Table contains all 1251 objects. Click a row to preview an image with annotations, and use search or pagination to navigate. Sort columns to find outliers in the dataset.
Object ID ㅤ | Class ㅤ | Image name click row to open | Image size height x width | Height ㅤ | Height ㅤ | Width ㅤ | Width ㅤ | Area ㅤ |
|---|---|---|---|---|---|---|---|---|
1➔ | BE_bbox rectangle | EDD2020_B0051.jpeg | 480 x 474 | 471px | 98.12% | 462px | 97.47% | 95.64% |
2➔ | BE mask | EDD2020_B0051.jpeg | 480 x 474 | 471px | 98.12% | 462px | 97.47% | 85.46% |
3➔ | BE_bbox rectangle | EDD2020_B0065.jpeg | 365 x 391 | 357px | 97.81% | 385px | 98.47% | 96.31% |
4➔ | BE_bbox rectangle | EDD2020_B0065.jpeg | 365 x 391 | 148px | 40.55% | 229px | 58.57% | 23.75% |
5➔ | BE mask | EDD2020_B0065.jpeg | 365 x 391 | 363px | 99.45% | 385px | 98.47% | 47.55% |
6➔ | BE_bbox rectangle | EDD2020_AJ0011.jpeg | 480 x 514 | 471px | 98.12% | 510px | 99.22% | 97.36% |
7➔ | cancer_bbox rectangle | EDD2020_AJ0011.jpeg | 480 x 514 | 101px | 21.04% | 249px | 48.44% | 10.19% |
8➔ | BE mask | EDD2020_AJ0011.jpeg | 480 x 514 | 471px | 98.12% | 510px | 99.22% | 87.16% |
9➔ | cancer mask | EDD2020_AJ0011.jpeg | 480 x 514 | 101px | 21.04% | 249px | 48.44% | 8.05% |
10➔ | BE_bbox rectangle | EDD2020_B0067.jpeg | 372 x 345 | 78px | 20.97% | 104px | 30.14% | 6.32% |
License #
EDD2020: Endoscopy Disease Detection and Segmentation is under CC BY-NC 4.0 license.
Citation #
If you make use of the EDD2020 data, please cite the following reference:
@misc{https://doi.org/10.21227/f8xg-wb80,
  doi = {10.21227/F8XG-WB80},
  url = {https://ieee-dataport.org/competitions/endoscopy-disease-detection-and-segmentation-edd2020},
  author = {Ali, Sharib  and Braden, Barbara and Lamarque, Dominique and Realdon, Stefano and Bailey, Adam and Cannizzaro, Renato and Ghatwary, Noha and Rittscher, Jens  and Daul, Christian  and East , James },
  keywords = {Artificial Intelligence, Computer Vision, Image Processing, Machine Learning, Biomedical and Health Sciences, Medical Imaging, Detection, localisation, Semantic Segmentation, out-of-sample detection},
  title = {Endoscopy Disease Detection and Segmentation (EDD2020)},
  publisher = {IEEE DataPort},
  year = {2020},
  copyright = {Creative Commons Attribution}
}
If you are happy with Dataset Ninja and use provided visualizations and tools in your work, please cite us:
@misc{ visualization-tools-for-edd2020-dataset,
  title = { Visualization Tools for EDD2020 Dataset },
  type = { Computer Vision Tools },
  author = { Dataset Ninja },
  howpublished = { \url{ https://datasetninja.com/edd2020 } },
  url = { https://datasetninja.com/edd2020 },
  journal = { Dataset Ninja },
  publisher = { Dataset Ninja },
  year = { 2026 },
  month = { jul },
  note = { visited on 2026-07-20 },
}
Download #
Dataset EDD2020 can be downloaded in Supervisely format:
As an alternative, it can be downloaded with dataset-tools package:
pip install --upgrade dataset-tools
… using following python code:
import dataset_tools as dtools

dtools.download(dataset='EDD2020', dst_dir='~/dataset-ninja/')
Make sure not to overlook the python code example available on the Supervisely Developer Portal. It will give you a clear idea of how to effortlessly work with the downloaded dataset.
The data in original format can be downloaded here.
Disclaimer #
Our gal from the legal dep told us we need to post this:
Dataset Ninja provides visualizations and statistics for some datasets that can be found online and can be downloaded by general audience. Dataset Ninja is not a dataset hosting platform and can only be used for informational purposes. The platform does not claim any rights for the original content, including images, videos, annotations and descriptions. Joint publishing is prohibited.
You take full responsibility when you use datasets presented at Dataset Ninja, as well as other information, including visualizations and statistics we provide. You are in charge of compliance with any dataset license and all other permissions. You are required to navigate datasets homepage and make sure that you can use it. In case of any questions, get in touch with us at hello@datasetninja.com.