

Introduction #
The authors developed the EMDS-6: Environmental Microorganism Image Dataset Sixth Version, which contains 21 types of environmental microorganism (EMs). Each type of EM contains 40 original and 40 GT images, in total 1680 EM images. In their study, in order to test the effectiveness of EMDS-6. They choose the classic algorithms of image processing methods such as image denoising, image segmentation and target detection. The experimental result shows that EMDS-6 can be used to evaluate the performance of image denoising, image segmentation, image feature extraction, image classification, and object detection methods.
Motivation
Environmental microorganisms (EMs) are minuscule life forms that exist in nature, invisible to the naked eye and detectable only through microscopic observation. Despite their size, EMs wield significant influence on human existence. Certain beneficial bacteria contribute to the production of fermented foods such as cheese and bread, offering a positive perspective. Conversely, some EMs aid in plastic degradation, industrial waste gas treatment, and soil enhancement. However, viewed in a negative light, EMs contribute to food spoilage, diminished crop yields, and serve as major contributors to the spread of infectious diseases.
To leverage the advantages of environmental microorganisms while mitigating their detrimental effects, numerous scientific researchers have dedicated themselves to studying EMs. Fundamental to this endeavor is the analysis of EM images. EMs typically range in size from 0.1 to 100 microns, presenting challenges in detection and identification. Traditional morphological methods necessitate direct microscopic examination, followed by interpretation based on shape characteristics. However, this conventional approach is labor and time-intensive. Therefore, employing computer-assisted feature extraction and analysis of EM images empowers researchers to make accurate decisions efficiently, leveraging minimal professional expertise and time investment.
Collecting samples of environmental microorganisms (EMs) typically occurs outdoors. However, during transportation to the laboratory for observation, significant environmental and temperature fluctuations can compromise the quality of EM samples. Additionally, when researchers observe EMs under a traditional optical microscope, subjective errors are common due to prolonged visual processing. Consequently, creating datasets of environmental microorganism images poses a significant challenge. Furthermore, the majority of existing EM image datasets are not publicly accessible, impeding progress in related scientific research.
Dataset description
EMDS-6 stands out among other environmental microorganism image datasets due to several notable advantages. Firstly, it encompasses a diverse range of microorganisms, offering ample opportunities for multi-classification of EM images. Moreover, each image within the EMDS-6 dataset is accompanied by a corresponding ground truth (GT) image. These GT images serve as valuable benchmarks for evaluating the performance of tasks like image segmentation and target detection. Furthermore, unlike many existing datasets, EMDS-6 includes GT images, enhancing its utility in various applications such as denoising, image segmentation, feature extraction, image classification, and object detection. As a result, EMDS-6 provides robust data support for a wide array of research endeavors in the field of environmental microorganisms.
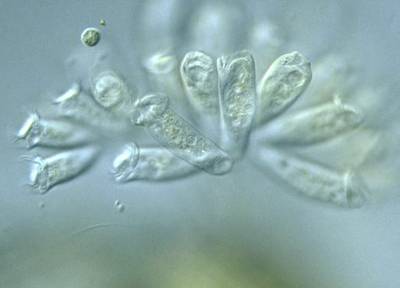
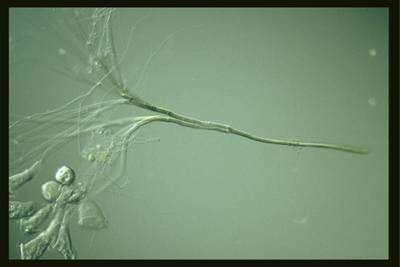
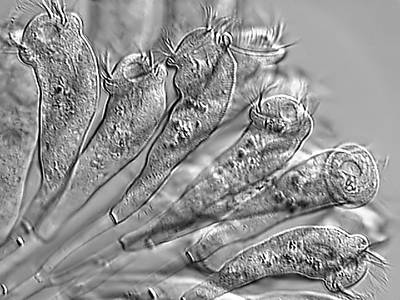
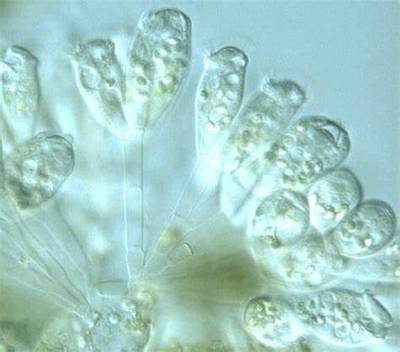
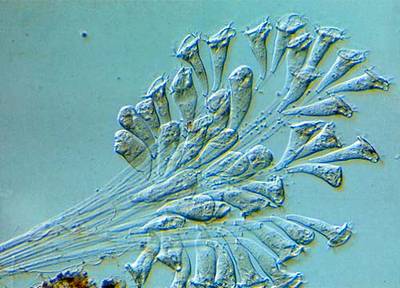
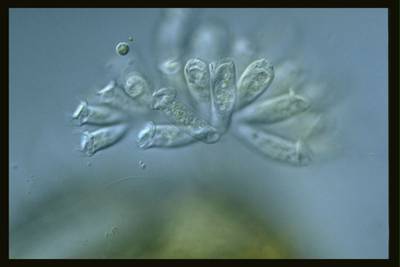
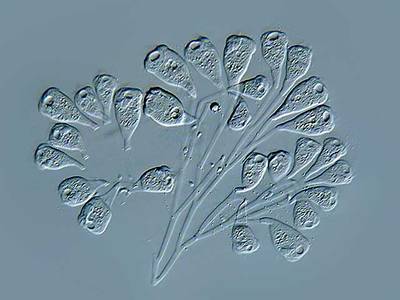
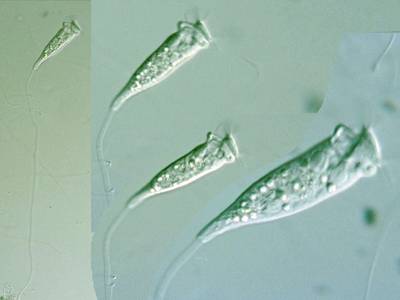
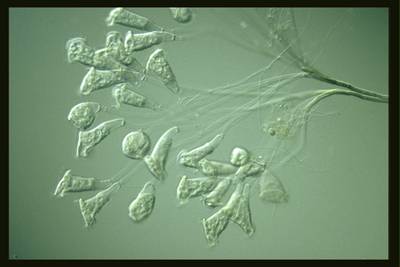
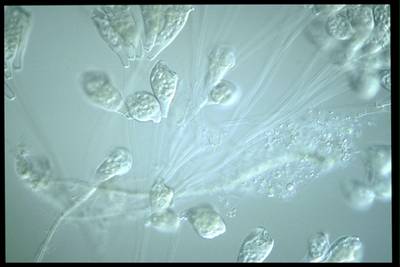
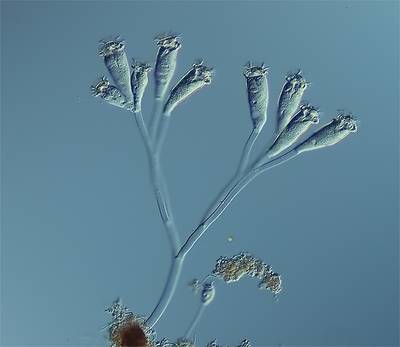
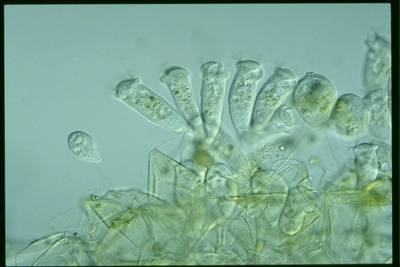
An example of EMDS-6, including original images and GT images.
The EMDS-6 dataset comprises 1680 images, featuring 21 distinct classes of original EM images, each class containing 40 images. This totals 840 original images, with each accompanied by a corresponding GT image, also totaling 840. The image collection for EMDS-6 spanned from 2012 to 2020.
The authors introduced four types of noise—Poisson, multiplicative, Gaussian, and pretzel noise—into their study. By manipulating parameters such as mean, variance, and density, they generated a total of 13 specific noise types. These include multiplicative noise with variances of 0.2 and 0.04, salt and pepper noise with densities of 0.01 and 0.03 (SPN:0.01, SPN:0.03), pepper noise (PpN), salt noise (SN), Brightness Gaussian noise (BGN), Positional Gaussian noise (PGN), Gaussian noise with variances of 0.01 and mean of 0 (GN 0.01-0), Gaussian noise with variances of 0.01 and mean of 0.5 (GN 0.01-0.5), Gaussian noise with variances of 0.03 and mean of 0 (GN 0.03-0), Gaussian noise with variances of 0.03 and mean of 0.5 (GN 0.03-0.5), and Poisson noise (PN). Simultaneously, nine types of filters were applied, including the Two-Dimensional Rank Order Filter (TROF), 3×3 Wiener Filter (WF (3×3)), 5×5 Wiener Filter (WF (5×5)), 3×3 Window Mean Filter (MF (3×3)), Mean Filter with 5×5 Window (MF (5×5)), Minimum Filtering (MinF), Maximum Filtering (MaxF), Geometric Mean Filtering (GMF), and Arithmetic Mean Filtering (AMF). In the experimental setup, the 13 types of noise were added to the EMDS-6 dataset images, followed by filtering using the nine specified filters.
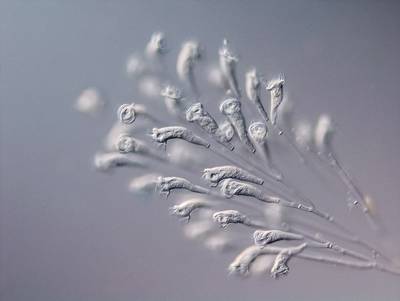
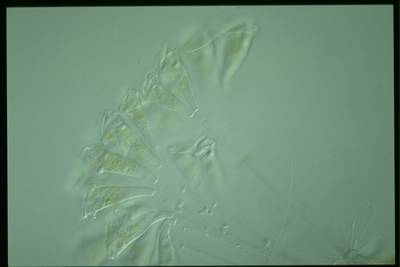
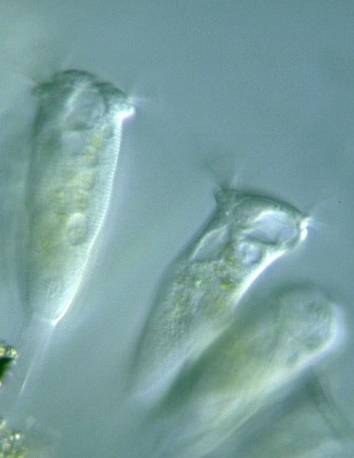
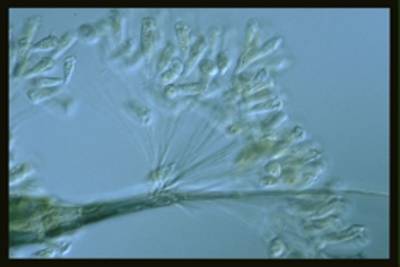
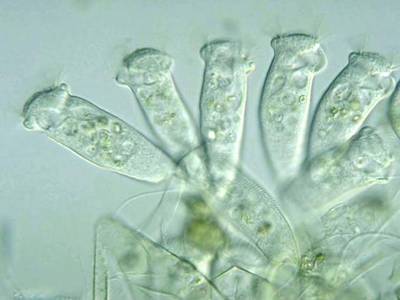
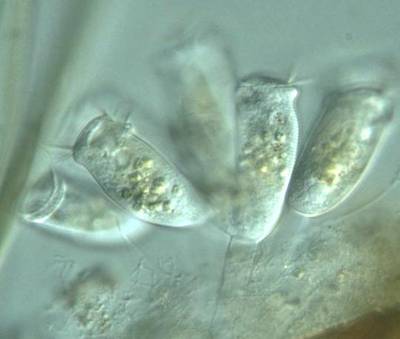
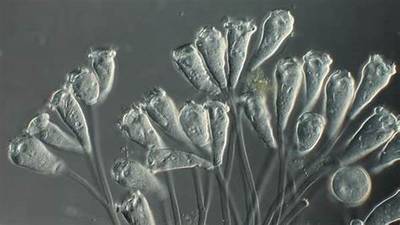
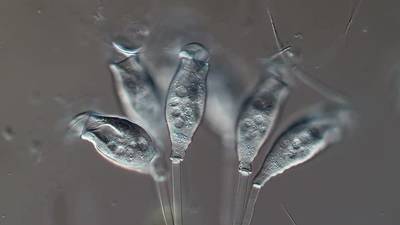
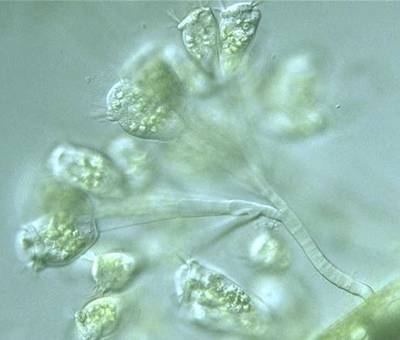
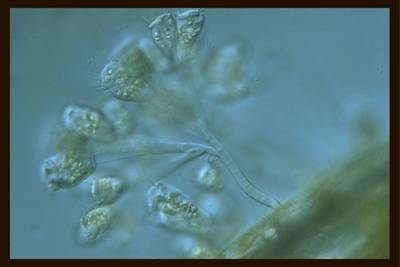
An example of EMDS-6, including original images and GT images.
 Homepage
 Research Paper
Summary #
EMDS-6: Environmental Microorganism Image Dataset Sixth Version is a dataset for semantic segmentation and object detection tasks. It is used in the biomedical research.
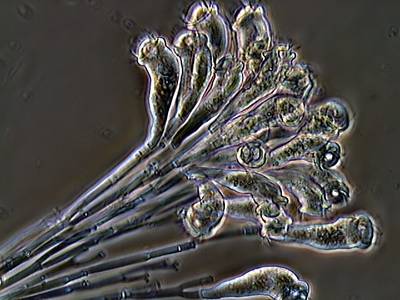
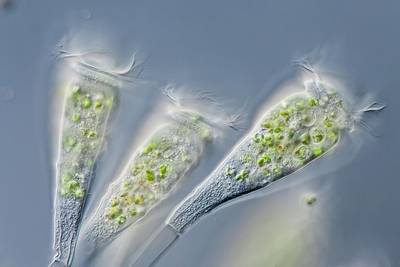
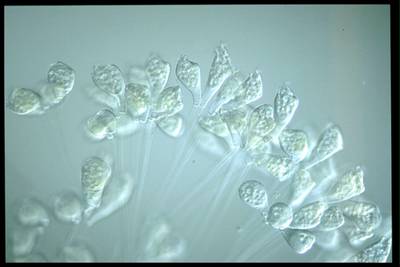
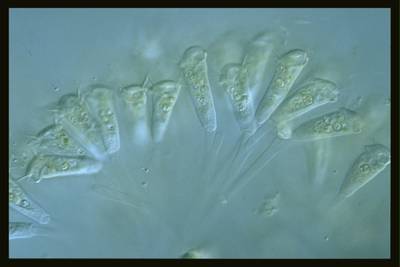
The dataset consists of 840 images with 840 labeled objects belonging to 21 different classes including actinophrys, arcella, aspidisca, and other: codosiga, colpoda, epistylis, euglypha, paramecium, rotifera, vorticella, noctiluca, ceratium, stentor, siprostomum, keratella quadrala, euglena, gymnodinium, gonyaulax, phacus, stylongchia, and synchaeta.
Images in the EMDS-6 dataset have pixel-level semantic segmentation annotations. All images are labeled (i.e. with annotations). There are no pre-defined train/val/test splits in the dataset. The dataset was released in 2021 by the CN-GER-AU joint research group.
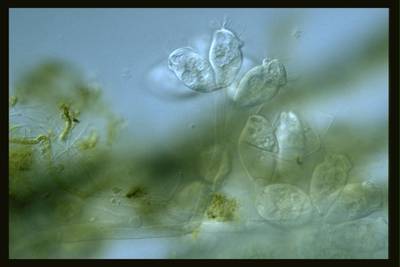
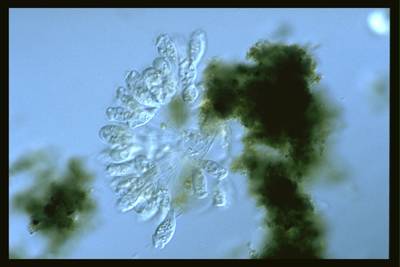
Here are the visualized examples for the classes:
Explore #
EMDS-6 dataset has 840 images. Click on one of the examples below or open "Explore" tool anytime you need to view dataset images with annotations. This tool has extended visualization capabilities like zoom, translation, objects table, custom filters and more. Hover the mouse over the images to hide or show annotations.


Class balance #
There are 21 annotation classes in the dataset. Find the general statistics and balances for every class in the table below. Click any row to preview images that have labels of the selected class. Sort by column to find the most rare or prevalent classes.

Class ㅤ | Images ㅤ | Objects ㅤ | Count on image average | Area on image average |
|---|---|---|---|---|
vorticella➔ mask | 40 | 40 | 1 | 10.54% |
synchaeta➔ mask | 40 | 40 | 1 | 29.06% |
stylongchia➔ mask | 40 | 40 | 1 | 22.63% |
stentor➔ mask | 40 | 40 | 1 | 18.56% |
siprostomum➔ mask | 40 | 40 | 1 | 11.92% |
rotifera➔ mask | 40 | 40 | 1 | 13.85% |
phacus➔ mask | 40 | 40 | 1 | 17.02% |
paramecium➔ mask | 40 | 40 | 1 | 21.28% |
noctiluca➔ mask | 40 | 40 | 1 | 46.41% |
keratella quadrala➔ mask | 40 | 40 | 1 | 20.09% |
Co-occurrence matrix #
Co-occurrence matrix is an extremely valuable tool that shows you the images for every pair of classes: how many images have objects of both classes at the same time. If you click any cell, you will see those images. We added the tooltip with an explanation for every cell for your convenience, just hover the mouse over a cell to preview the description.
Images #
Explore every single image in the dataset with respect to the number of annotations of each class it has. Click a row to preview selected image. Sort by any column to find anomalies and edge cases. Use horizontal scroll if the table has many columns for a large number of classes in the dataset.
Object distribution #
Interactive heatmap chart for every class with object distribution shows how many images are in the dataset with a certain number of objects of a specific class. Users can click cell and see the list of all corresponding images.
Class sizes #
The table below gives various size properties of objects for every class. Click a row to see the image with annotations of the selected class. Sort columns to find classes with the smallest or largest objects or understand the size differences between classes.
Class | Object count | Avg area | Max area | Min area | Min height | Min height | Max height | Max height | Avg height | Avg height | Min width | Min width | Max width | Max width |
|---|---|---|---|---|---|---|---|---|---|---|---|---|---|---|
vorticella mask | 40 | 10.54% | 33.59% | 2.04% | 90px | 26.63% | 760px | 100% | 247px | 60.57% | 73px | 10.68% | 572px | 100% |
synchaeta mask | 40 | 29.06% | 50.47% | 14% | 102px | 44.93% | 833px | 95.59% | 325px | 74.8% | 100px | 33.33% | 683px | 95.56% |
stylongchia mask | 40 | 22.63% | 43% | 5.07% | 155px | 32.23% | 1390px | 95.16% | 343px | 68.63% | 139px | 24.09% | 723px | 100% |
stentor mask | 40 | 18.56% | 38.29% | 5.99% | 96px | 32.27% | 1423px | 96.16% | 314px | 79.93% | 72px | 27.6% | 816px | 98.01% |
siprostomum mask | 40 | 11.93% | 28.58% | 2.78% | 36px | 22.82% | 418px | 96.86% | 197px | 69.08% | 116px | 36.5% | 748px | 100% |
rotifera mask | 40 | 13.85% | 26.4% | 2.8% | 72px | 34.25% | 745px | 99.8% | 249px | 66.03% | 57px | 14.69% | 811px | 96.62% |
phacus mask | 40 | 17.02% | 43.02% | 2.14% | 93px | 21.88% | 565px | 96.09% | 241px | 60.91% | 104px | 13.54% | 546px | 92.39% |
paramecium mask | 40 | 21.28% | 51.85% | 4.33% | 97px | 28.7% | 1240px | 99.38% | 338px | 65.06% | 97px | 19.13% | 1496px | 95.47% |
noctiluca mask | 40 | 46.41% | 68.72% | 17.5% | 80px | 55.37% | 515px | 97.33% | 207px | 81.1% | 71px | 39.31% | 531px | 97.22% |
keratella quadrala mask | 40 | 20.09% | 33.32% | 7.45% | 84px | 28.74% | 685px | 96.67% | 249px | 76.67% | 106px | 29.73% | 670px | 91.79% |
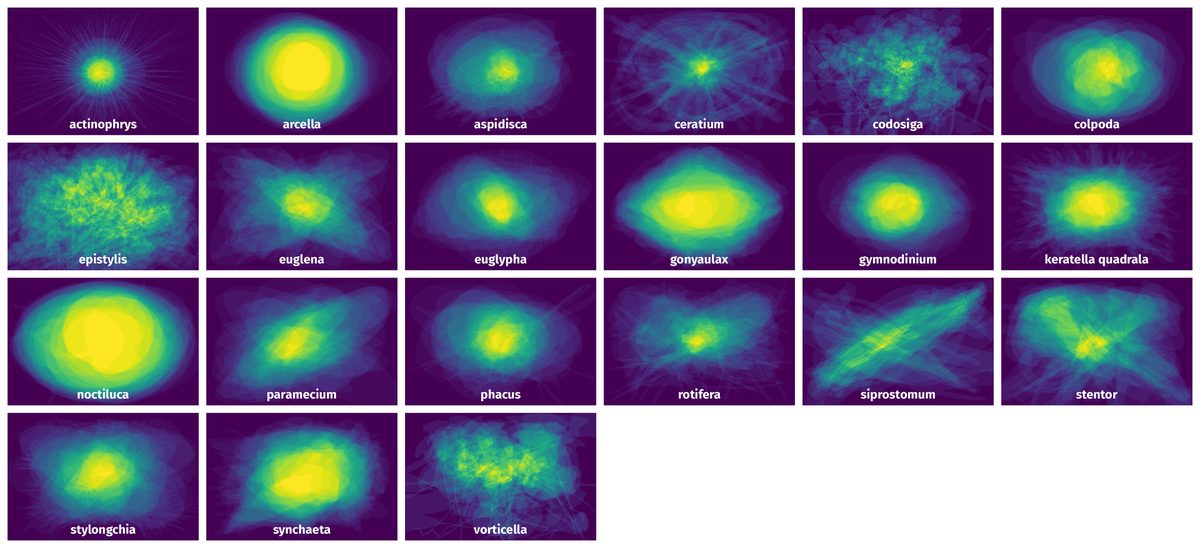
Spatial Heatmap #
The heatmaps below give the spatial distributions of all objects for every class. These visualizations provide insights into the most probable and rare object locations on the image. It helps analyze objects' placements in a dataset.
Objects #
Table contains all 840 objects. Click a row to preview an image with annotations, and use search or pagination to navigate. Sort columns to find outliers in the dataset.
Object ID ㅤ | Class ㅤ | Image name click row to open | Image size height x width | Height ㅤ | Height ㅤ | Width ㅤ | Width ㅤ | Area ㅤ |
|---|---|---|---|---|---|---|---|---|
1➔ | siprostomum mask | EMDS5-g14-21.png | 198 x 561 | 121px | 61.11% | 418px | 74.51% | 17.72% |
2➔ | actinophrys mask | EMDS5-g01-29.png | 480 x 640 | 428px | 89.17% | 453px | 70.78% | 11.28% |
3➔ | stentor mask | EMDS5-g13-19.png | 248 x 330 | 103px | 41.53% | 278px | 84.24% | 13.41% |
4➔ | gymnodinium mask | EMDS5-g17-18.png | 338 x 507 | 133px | 39.35% | 161px | 31.76% | 9.82% |
5➔ | euglena mask | EMDS5-g16-20.png | 512 x 768 | 366px | 71.48% | 355px | 46.22% | 6.94% |
6➔ | euglena mask | EMDS5-g16-07.png | 533 x 800 | 184px | 34.52% | 549px | 68.62% | 8.51% |
7➔ | stentor mask | EMDS5-g13-21.png | 347 x 355 | 311px | 89.63% | 317px | 89.3% | 32.16% |
8➔ | arcella mask | EMDS5-g02-11.png | 338 x 507 | 225px | 66.57% | 223px | 43.98% | 22.52% |
9➔ | ceratium mask | EMDS5-g12-04.png | 250 x 316 | 164px | 65.6% | 218px | 68.99% | 6.65% |
10➔ | synchaeta mask | EMDS5-g21-25.png | 480 x 640 | 348px | 72.5% | 470px | 73.44% | 20.16% |
License #
Citation #
If you make use of the Environmental Microorganism Image Dataset data, please cite the following reference:
@article{Group2021,
  author = "MIaMIA Group",
  title = "{EMDS-6}",
  year = "2021",
  month = "12",
  url = "https://figshare.com/articles/dataset/EMDS-6/17125025",
  doi = "10.6084/m9.figshare.17125025.v1"
}
If you are happy with Dataset Ninja and use provided visualizations and tools in your work, please cite us:
@misc{ visualization-tools-for-emds-dataset,
  title = { Visualization Tools for EMDS-6 Dataset },
  type = { Computer Vision Tools },
  author = { Dataset Ninja },
  howpublished = { \url{ https://datasetninja.com/emds-6 } },
  url = { https://datasetninja.com/emds-6 },
  journal = { Dataset Ninja },
  publisher = { Dataset Ninja },
  year = { 2026 },
  month = { jul },
  note = { visited on 2026-07-25 },
}
Download #
Dataset EMDS-6 can be downloaded in Supervisely format:
As an alternative, it can be downloaded with dataset-tools package:
pip install --upgrade dataset-tools
… using following python code:
import dataset_tools as dtools

dtools.download(dataset='EMDS-6', dst_dir='~/dataset-ninja/')
Make sure not to overlook the python code example available on the Supervisely Developer Portal. It will give you a clear idea of how to effortlessly work with the downloaded dataset.
The data in original format can be downloaded here.
Disclaimer #
Our gal from the legal dep told us we need to post this:
Dataset Ninja provides visualizations and statistics for some datasets that can be found online and can be downloaded by general audience. Dataset Ninja is not a dataset hosting platform and can only be used for informational purposes. The platform does not claim any rights for the original content, including images, videos, annotations and descriptions. Joint publishing is prohibited.
You take full responsibility when you use datasets presented at Dataset Ninja, as well as other information, including visualizations and statistics we provide. You are in charge of compliance with any dataset license and all other permissions. You are required to navigate datasets homepage and make sure that you can use it. In case of any questions, get in touch with us at hello@datasetninja.com.