

Introduction #
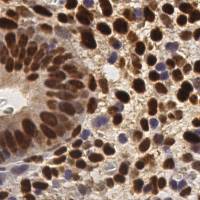
The authors present EndoNuke: Nuclei Detection in Endometrium Samples, an open dataset consisting of tiles from endometrium immunohistochemistry slides with the nuclei annotated as keypoints. Several experts with various experience levels have annotated the dataset. Apart from gathering the data and creating the annotations, the authors have performed an agreement study and analyzed the distribution of nuclei staining intensity.
Motivation
One of the key problems in medical research and medical decision-making is the subjective assessment of clinical data, especially of a visual nature. Additionally, an integrated approach to the assessment of biomedical data is often required: it is necessary to compare the results of several studies, and as their number grows, the complexity of this process increases. Both problems can be addressed by creating software tools that support medical or clinical decision-making. One area where such tools are especially needed is histological examinations, which are often required in patients diagnosed with infertility. Infertility is a disease of the reproductive system (ICD-10: N97), defined as the inability to achieve a clinical pregnancy after 12 months or more of regular unprotected intercourse. Infertility affects a large proportion of humanity, impacting over 186 million couples worldwide.
Methodology and Analysis
One of the methods to evaluate these reactions is to calculate a histological score—a cumulative quantity representing the receptivity of a sample to a given hormone. Calculating such quantities requires the painstaking calculation of the nuclei of different staining responses. When done manually, this calculation is prone to errors, as only a limited amount of the fields of view are analyzed, and the subjectiveness of an expert is always present. The automation of such tasks may solve these problems and improve the speed and availability of such analysis.
To create models capable of calculating histological scores, rich, representative, and well-labeled datasets are required. The first step for computing histological scores is detecting and counting nuclei. The corresponding dataset should have information about their positions and stoma/epithelium classes for various patches taken from histological slides. EndoNuke is presented as the first open dataset dedicated to automating the scoring process of endometrium immunohistochemistry (IHC) slides. The authors also performed an expert agreement study, which is essential not only for developing detection models but also for estimating the representability of the histological scores themselves. Finally, they performed a simple analysis of the staining properties of the labeled nuclei.
Sample Collection
Inclusion criteria were reproductive age and the presence of ovarian endometrial cysts, confirmed morphologically after cystectomy. All included patients had secondary infertility, decreased ovarian reserve, and unilateral or bilateral ovarian endometrial cysts. The 12 patients (aged 26 to 40 years) included in the study underwent an aspiration endometrial pipelle biopsy in the middle stage of the proliferation and secretion phases. The biopsy was placed in 10% formalin for fixation.
Slide Preparation
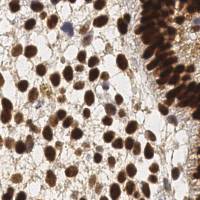
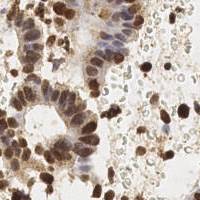
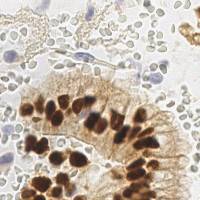
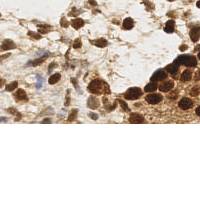
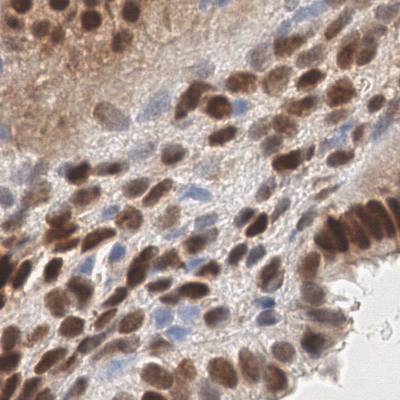
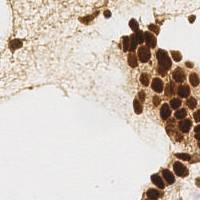
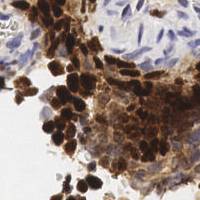
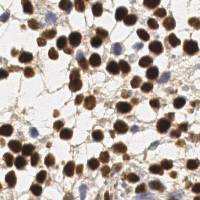
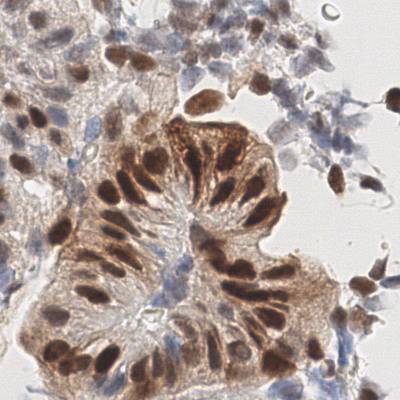
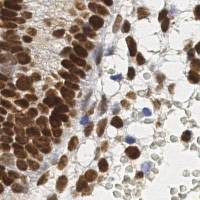
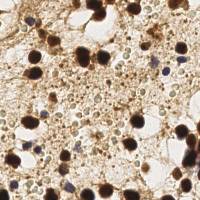
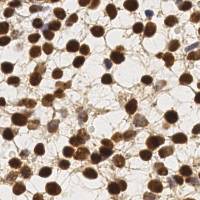
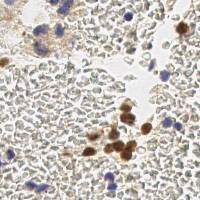
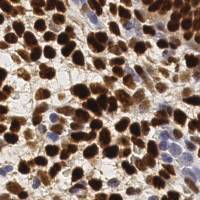
Formalin-fixed pipelle endometrial biopsy underwent routine histological processing using the automatic histoprocessor Leica ASP30 and the station for embedding in paraffin Leica EG1150. A series of endometrial biopsy sections (4 μm) for visualization of general tissue structure and for immunohistochemical analysis were obtained from each patient. Sections were placed in polylysine glass slides and were dried in a drying chamber at 70 °C for at least 2 hours. For immunohistochemical analysis, paraffin sections were deparaffinized in a series of containers with xylene, passed through alcohols of descending strength, followed by water and the appropriate buffer solution. Then, antigen unmasking and blocking procedures were performed and sections were transferred to APK Wash buffer and stained in immunohistostainer Ventana BenchMark Ultra using various antibodies: Ventana CONFIRM anti-Progesterone Receptor (PR) Rabbit Monoclonal Primary Antibody, PR-A and PR-B, and Ventana CONFIRM anti-Estrogen Receptor Rabbit Monoclonal Primary Antibody and immunoperoxidase-conjugated secondary antibodies in dilutions recommended by the manufacturers. Labeling was visualized by reaction with DAB (diaminobenzidine tetrahydro-chloride), and counterstained with hematoxylin. Each section was scanned with a Leica Aperio AT2.
Tiles Sampling and Preparation
After the slides were prepared, the authors sampled tiles of fixed physical sizes of 100 × 100 μm. Due to the differing magnifications on the scanner, the pixel sizes of the images are also different: 200 × 200 pixels for 0.5 μm/pixel resolution and 400 × 400 pixels for 0.25 μm/pixel resolution. The tiles are stored in their original sizes; however, for the research presented in this paper, they were rescaled to a unified size of 256 × 256.
The sampling process was as follows: first, a grid was created on the slide, then the tiles were uniformly sampled from the grid. A simple script detected whether the tile was predominantly a background one—these tiles were excluded from the resulting set. As many tiles did not contain any information about the nuclei, the authors decided to manually filter some of the tiles before labeling. As this process can skew the distribution of the images, they filtered only one-third of the dataset. The filtered and unfiltered parts of the dataset can be easily restored from the file IDs (see instructions on the dataset website).
Each tile is supplemented with a context image—the image of a physical size of 300 × 300 μm, with the tile of interest put into the contrast frame. This context is not assumed to be labeled, as it serves only to provide information about the larger tissue structure.
Annotation Protocol
The annotation was conducted in three phases with the help of the CVAT web application tool. For labels, the “points” tool was used—although it gives only information about nuclei location, it reduces the annotation time, as the expert does not have to draw a bounding box or a mask.
In the first phase, all experts were gathered together in a virtual room, and a briefing from a senior pathologist was provided. After a Q&A session, a fixed set of 10 tiles was labeled by each expert. All seven experts could not communicate with each other during this process. After the labeling was completed, an additional Q&A session was conducted. The annotation gathered in this phase was used in what the authors call the “preliminary” agreement study.
In the second phase, the bulk of the dataset was created. Each expert annotated their own tiles, grouped in tasks of 20 tiles. As a task was finished, a new task was provided. The experts were able to communicate with each other via a chatroom. There was an additional set of 10 tiles, which were mixed among the first few tasks of each expert. These 10 tiles were used to estimate agreement after the second Q&A session in phase 1 and construct the “hidden” agreement study.
The third phase was somewhat similar to the first phase. The experts were given 20 tiles each, but there was no briefing or Q&A session. They were also not informed about this study. This study was performed to estimate the agreement after all raters gained some experience and communication was almost absent. These tiles are the basis for the “posterior” agreement study.
After the third phase, the experts continued to annotate the dataset according to the protocol of phase 2. In total, the experts annotated the dataset over one month. The CVAT web application was hosted on the ISPRAS server and was available during the entire annotation period, allowing the experts to access the data at any time they found convenient.
Generation of the Masks
Although the annotation does not have any information about nuclei shapes, it is possible to restore them using classical computer vision algorithms. To generate these masks, the authors utilized a watershed algorithm from the skiimage library. Around each nucleus, a window of fixed size is created, then all keypoints in the scope of the window are used as seed points. To find the seeds for the background, the MultiOtsu method with three classes was used.
In most cases, this method allows for accurate determination of the nuclei borders. However, if a nucleus almost merges with another object (i.e., another nucleus) or the nucleus boundary is fuzzy, the algorithm fails to correctly determine its shape. As the misshapen masks usually have areas that are too large or too small, they were treated as outliers and found by determining two thresholds: for the small and large nuclei.
To define these thresholds, the authors used the following methodology. First, the raw distribution was aggregated without any thresholds, leaving all masks as they were generated by the watershed algorithm. A smooth peak in the middle of the distribution and a sharp peak on the left corresponding to small outliers were observed. By estimating a probability density using a Gaussian kernel, the center of the well between the peaks was found and treated as a threshold for small outliers. To find the threshold for large outliers, the right 99th-percentile was found, starting from the center of the smooth peak.
Expression Rate Analysis
After the masks were generated, it was possible to calculate the expression rate of a nucleus. A basic technique of color deconvolution was used to extract the DAB optical densities (OD), as described in the literature. For all pixels inside the mask, the DAB OD values were calculated and the mean value was taken.
As the masks are not perfect, another approach to estimate the expression rate, called the probe approach, was also tried. Instead of generating the masks with a watershed algorithm, a circular mask around each keypoint with a radius smaller than an average nuclei radius was made. This allowed only a limited amount of pixels into a “probe”, which, generally, are not close to the boundary of the nucleus and thus may better represent the staining. The masks generated by the probe method have a physical radius of 1 μm.
Agreement Study
The first step in studying agreement is to define the objects of interest. In this case, the objects are nuclei, so they had to be treated as individual samples. This implies two problems: the first is that the nuclei, found by different experts on the same tiles, are not at the exact same positions, and the second is that a given nucleus can be labeled by one expert and not labeled by another. These problems were addressed calculating the keypoints similarity measure.
Dataset Description
The resulting dataset consists of two separate parts. The first part consists of 40 tiles with 34,701 nuclei keypoints, labeled by all experts who participated in the study (three pathologists and four medical students). This part was used for the agreement study and can also be utilized as a test dataset with high-quality labels obtained by merging the keypoints from the experienced pathologists.
The second part consists of 1,740 tiles with 210,419 nuclei labels. Each of these tiles was labeled by a single expert. Of these, 268 tiles were labeled by experienced pathologists, while the rest of the dataset was created by medical students.
Annotation Quality
The primary goal of the authors of the dataset was to create a rich and well-labeled dataset that could be used for creating models for nuclei detection on endometrium slides. The main benchmark for annotation quality was expert agreement, making it important to track how this changed during the dataset’s creation. In the preliminary agreement study, the pathologists demonstrated decent agreement, while the students’ agreement was poor, both with each other and with the pathologists. This indicates that the briefing and Q&A session conducted before that phase was insufficient for creating consistent annotations.
However, during the preliminary agreement phase, the students accumulated new questions and gained experience. After an additional Q&A session, the agreement noticeably increased—the hidden agreement study.
Finally, the posterior agreement study, conducted roughly in the middle of the annotation process, showed further improvement. At that time, communication between the experts was not intensive, so the overestimation factor should not be significant. Notably, in that phase, the agreement between the pathologists was close to the agreement between most of the students and the pathologists, indicating that the students had acquired sufficient experience.
Although the task of annotating the nuclei seems relatively simple, the agreement between any pair of experts rarely reaches 0.8 (for the method without dropping missed nuclei), including the pathologist-pathologist pairs. This indicates that even annotation in such tasks requires a thoughtful agreement study. The preliminary agreement study shows that annotations created by inexperienced personnel trained only by briefing are likely to be incomplete, and the class labels may often be incorrect.
Moreover, since the agreement between even experienced specialists is not perfect, it indicates that histological scores obtained manually are also affected by object interpretation (nuclei/not nuclei) errors. If an end-to-end model is trained on a dataset with histological scores as annotations, it will likely inherit these errors, not to mention the errors caused by the subjectivity of staining interpretation. Thus, the authors believe that scoring tasks on histological data should not be solved in an end-to-end manner, and object detection models with subsequent object counting should be used, as they provide more interpretable results.
 Homepage
 Research Paper
Summary #
EndoNuke: Nuclei Detection in Endometrium Samples is a dataset for instance segmentation, semantic segmentation, and object detection tasks. It is used in the medical industry, and in the biomedical research.
The dataset consists of 1780 images with 215758 labeled objects belonging to 3 different classes including stroma, epithelium, and other nuclei.
Images in the EndoNuke dataset have pixel-level instance segmentation annotations. Due to the nature of the instance segmentation task, it can be automatically transformed into a semantic segmentation (only one mask for every class) or object detection (bounding boxes for every object) tasks. All images are labeled (i.e. with annotations). There are no pre-defined train/val/test splits in the dataset. Alternatively, the dataset could be split into 7 annotators: stud2 (90456 instances), stud1 (37797 instances), stud3 (37655 instances), ptg2 (16297 instances), stud4 (13480 instances), ptg1 (11649 instances), and ptg3 (8424 instances). The dataset was released in 2022 by the Institute for System Programming of the Russian Academy of Sciences (ISP RAS).

Explore #
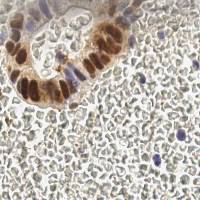
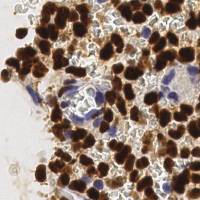
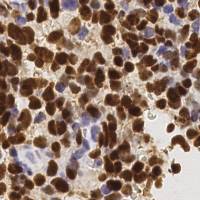
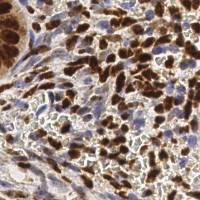
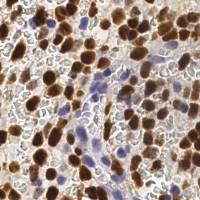
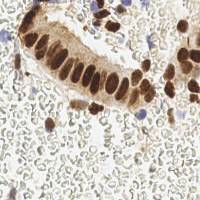
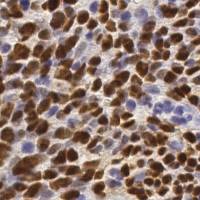
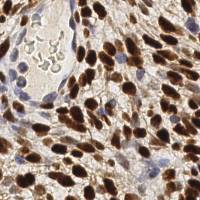
EndoNuke dataset has 1780 images. Click on one of the examples below or open "Explore" tool anytime you need to view dataset images with annotations. This tool has extended visualization capabilities like zoom, translation, objects table, custom filters and more. Hover the mouse over the images to hide or show annotations.


Class balance #
There are 3 annotation classes in the dataset. Find the general statistics and balances for every class in the table below. Click any row to preview images that have labels of the selected class. Sort by column to find the most rare or prevalent classes.

Class ㅤ | Images ㅤ | Objects ㅤ | Count on image average | Area on image average |
|---|---|---|---|---|
stroma➔ point | 1726 | 175384 | 101.61 | 0.24% |
epithelium➔ point | 1071 | 38574 | 36.02 | 0.08% |
other nuclei➔ point | 95 | 1800 | 18.95 | 0.05% |
Co-occurrence matrix #
Co-occurrence matrix is an extremely valuable tool that shows you the images for every pair of classes: how many images have objects of both classes at the same time. If you click any cell, you will see those images. We added the tooltip with an explanation for every cell for your convenience, just hover the mouse over a cell to preview the description.
Images #
Explore every single image in the dataset with respect to the number of annotations of each class it has. Click a row to preview selected image. Sort by any column to find anomalies and edge cases. Use horizontal scroll if the table has many columns for a large number of classes in the dataset.
Class sizes #
The table below gives various size properties of objects for every class. Click a row to see the image with annotations of the selected class. Sort columns to find classes with the smallest or largest objects or understand the size differences between classes.
Class | Object count | Avg area | Max area | Min area | Min height | Min height | Max height | Max height | Avg height | Avg height | Min width | Min width | Max width | Max width |
|---|---|---|---|---|---|---|---|---|---|---|---|---|---|---|
stroma point | 175384 | 0% | 0% | 0% | 1px | 0.25% | 1px | 0.5% | 1px | 0.48% | 1px | 0.25% | 1px | 0.5% |
epithelium point | 38574 | 0% | 0% | 0% | 1px | 0.25% | 1px | 0.5% | 1px | 0.46% | 1px | 0.25% | 1px | 0.5% |
other nuclei point | 1800 | 0% | 0% | 0% | 1px | 0.25% | 1px | 0.5% | 1px | 0.5% | 1px | 0.25% | 1px | 0.5% |
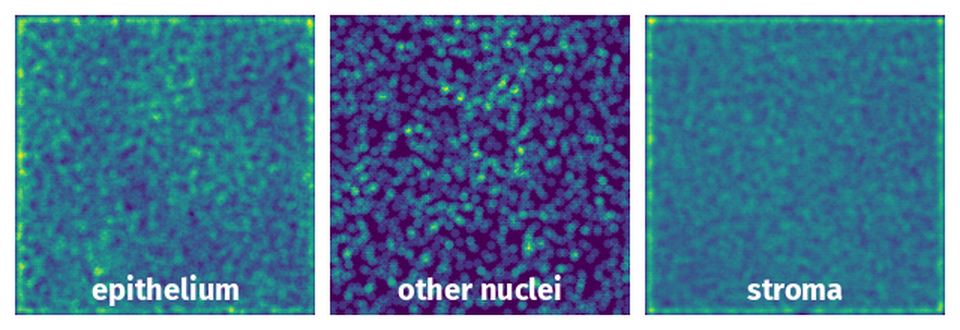
Spatial Heatmap #
The heatmaps below give the spatial distributions of all objects for every class. These visualizations provide insights into the most probable and rare object locations on the image. It helps analyze objects' placements in a dataset.
License #
Citation #
If you make use of the EndoNuke data, please cite the following reference:
@Article{data7060075,
    AUTHOR = {Naumov, Anton and Ushakov, Egor and Ivanov, Andrey and Midiber, Konstantin and Khovanskaya, Tatyana and Konyukova, Alexandra and Vishnyakova, Polina and Nora, Sergei and Mikhaleva, Liudmila and Fatkhudinov, Timur and Karpulevich, Evgeny},
    TITLE = {EndoNuke: Nuclei Detection Dataset for Estrogen and Progesterone Stained IHC Endometrium Scans},
    JOURNAL = {Data},
    VOLUME = {7},
    YEAR = {2022},
    NUMBER = {6},
    ARTICLE-NUMBER = {75},
    URL = {https://www.mdpi.com/2306-5729/7/6/75},
    ISSN = {2306-5729},
    ABSTRACT = {We present EndoNuke, an open dataset consisting of tiles from endometrium immunohistochemistry slides with the nuclei annotated as keypoints. Several experts with various experience have annotated the dataset. Apart from gathering the data and creating the annotation, we have performed an agreement study and analyzed the distribution of nuclei staining intensity.},
    DOI = {10.3390/data7060075}
}
If you are happy with Dataset Ninja and use provided visualizations and tools in your work, please cite us:
@misc{ visualization-tools-for-endonuke-dataset,
  title = { Visualization Tools for EndoNuke Dataset },
  type = { Computer Vision Tools },
  author = { Dataset Ninja },
  howpublished = { \url{ https://datasetninja.com/endonuke } },
  url = { https://datasetninja.com/endonuke },
  journal = { Dataset Ninja },
  publisher = { Dataset Ninja },
  year = { 2026 },
  month = { jul },
  note = { visited on 2026-07-20 },
}
Download #
Dataset EndoNuke can be downloaded in Supervisely format:
As an alternative, it can be downloaded with dataset-tools package:
pip install --upgrade dataset-tools
… using following python code:
import dataset_tools as dtools

dtools.download(dataset='EndoNuke', dst_dir='~/dataset-ninja/')
Make sure not to overlook the python code example available on the Supervisely Developer Portal. It will give you a clear idea of how to effortlessly work with the downloaded dataset.
The data in original format can be downloaded here.
Disclaimer #
Our gal from the legal dep told us we need to post this:
Dataset Ninja provides visualizations and statistics for some datasets that can be found online and can be downloaded by general audience. Dataset Ninja is not a dataset hosting platform and can only be used for informational purposes. The platform does not claim any rights for the original content, including images, videos, annotations and descriptions. Joint publishing is prohibited.
You take full responsibility when you use datasets presented at Dataset Ninja, as well as other information, including visualizations and statistics we provide. You are in charge of compliance with any dataset license and all other permissions. You are required to navigate datasets homepage and make sure that you can use it. In case of any questions, get in touch with us at hello@datasetninja.com.