

Introduction #
The authors unveiled the EPIC-KITCHENS VISOR: VIdeo Segmentations and Object Relations, a novel dataset featuring pixel annotations and a benchmark suite tailored for segmenting hands and dynamic objects in egocentric video footage. VISOR introduces an innovative annotation pipeline, incorporating AI-powered elements for enhanced scalability and annotation quality. In total, the authors have made publicly available 272,000 manually annotated semantic masks encompassing 257 object classes, along with 9.9 million interpolated dense masks and 67,000 hand-object relations. This comprehensive dataset covers 36 hours of untrimmed video footage spanning 179 sequences.
Motivation
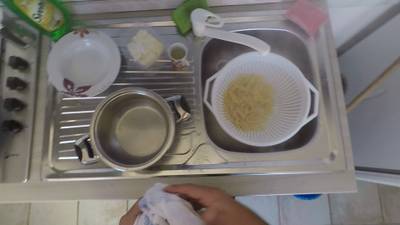
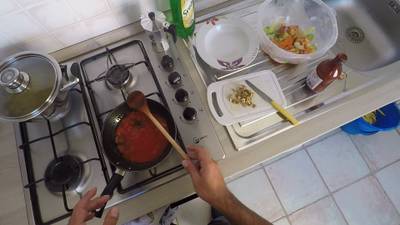
Consider a video capturing the tedious process of preparing bread, from obtaining, measuring and mixing ingredients to kneading and shaping dough. Despite being a routine task, the discrete nature of computer vision models, trained mostly from images, expects to recognise objects as either flour or dough. Capturing the transformation through pixel-level annotations has not been attempted to date. VISOR incorporates action labels and offers sparse segmentations of both hands and dynamic objects. The annotation rate is designed to represent a wide range of temporal actions, encompassing both short actions (e.g., ‘add salt’) and longer actions (e.g., ‘knead dough’). Rich pixel-level annotations have revolutionized tasks such as image understanding and autonomous driving. By integrating action labels with semantic segmentations, the authors aim to empower advanced video comprehension capabilities. Previous attempts to incorporate spatio-temporal annotations and object relations have typically relied on bounding boxes. While some pioneering video datasets provide pixel labels over time, they are often limited in duration and lack fine-grained action labels.
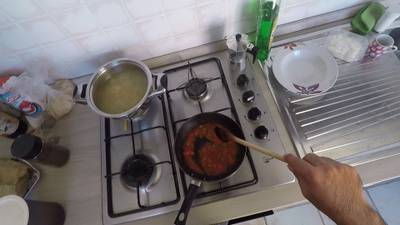
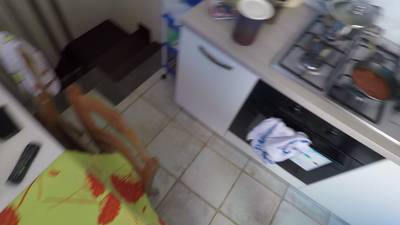
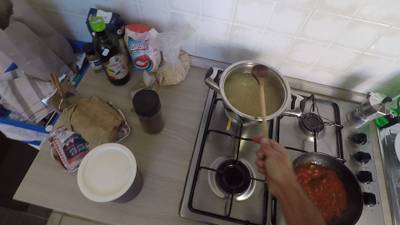
VISOR Annotations and Benchmarks. Sparse segmentations from one video (P06_03), where flour turns into dough over the course of over 11 minutes. The colours of the timeline represent the stages: flour→mixture→dough. By building off of the EPIC-KITCHENS dataset, the segments join a rich set of action labels.
Dataset description
The authors’ annotation pipeline comprises several stages. Initially, they identify the frames and active entities earmarked for annotation. Once determined, they proceed to obtain pixel-level annotations, significantly expedited through the use of an AI-powered tool. To ensure uniformity, annotators undergo extensive training and their work is meticulously verified manually. Additionally, the authors gather supplementary annotations essential for their challenges. Their efforts are based on the extensive egocentric EPIC-KITCHENS-100 dataset, collected under University of Bristol faculty ethics approval and participants’ signed consent (anonymized). Participants wear head-mounted cameras, initiating recording upon entering the kitchen and concluding when they exit. These recordings feature fine-grained action labels, including video file identification, action start and end times, succinct open-vocabulary action descriptions (e.g., ‘take mozzarella out of packet’), and closed-vocabulary verb and noun classifications (e.g., categorizing ‘mozzarella’ as ‘cheese’).
| Train | Val | Train+Val | Test | Total | |
|---|---|---|---|---|---|
| Kitchens | 33 | 24 (5 unseen) | 38 | 13 (4 unseen) | 42 |
| Untrimmed Videos | 115 | 43 | 158 | 21 | 179 |
| Images (and %) | 32,857 (64.8%) | 7,747 (15.3%) | 40,604 (80.0%) | 10,125 (20.0%) | 50,729 |
| Masks (and %) | 174,426 (64.2%) | 41,559 (15.3%) | 215,985 (79.5%) | 55,599 (20.5%) | 271,584 |
| Entity Classes | 242 | 182 (9 zero-shot) | 251 | 160 (6 zero-shot) | 257 |
VISOR splits statistics.
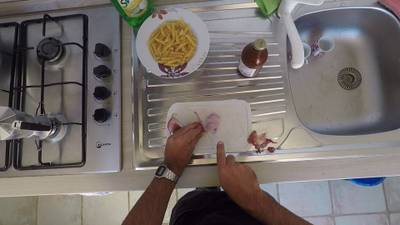
The initial stage of the authors’ process is dedicated to determining which data and entities necessitate annotation. Their data selection process focuses on identifying clear frames suitable for annotation and ensuring a balanced distribution of annotations across actions rather than time intervals, thus encompassing actions of varying durations. Regarding entity selection, the goal is to identify all active objects pertinent to the action, including tools, utensils, and appliances. This step is crucial as the narrations accompanying the videos may not explicitly mention objects implied by common sense, and the objects involved can vary from one sample to another. For instance, the action ‘peel carrot’ may involve a peeler and a bowl in one instance, while in another, a knife and chopping board may be used. It’s important to note that since the videos are filmed in domestic settings, frames may contain a high degree of clutter with background or irrelevant objects that do not require segmentation. The authors segment the untrimmed videos into sequences, each comprising three non-overlapping actions. This results in an average of 12 seconds of temporally consistent annotations. The choice of three actions was deliberate, aiming to introduce a moderate yet meaningful challenge compared to previous video segmentation datasets, which typically feature shorter sequence lengths ranging from 3 to 5 seconds. In each sequence, they annotate six frames, prioritizing clear frames to ensure better object delineation and avoiding blurred frames whenever feasible. To identify active entities for annotation, the authors employ a multi-step approach. They parse nouns from the narrations, correlate them with actions extracted from parsed verbs (e.g., matching ‘cut’ with ‘knife’), and incorporate manual annotations. From this comprehensive list, annotators then select the entities present in each frame.
Part of the VISOR Annotation Pipeline. The authors divide untrimmed videos to subsequences of 3 consecutive actions, sampling 6 frames/seq. We find entities to annotate via the union of automatic parsing of narrations, manual rules, and human annotations. These are then manually segmented.
During the project’s 22 months, the authors worked closely with 13 annotators: training, answering questions, and revising their annotations. To reduce the cost of pixel-level annotation, they used TORonto Annotation Suite, which uses interactive tools built from variants of the interface combines a mix of manual and AI-enhanced tools that dramatically improve the speed of obtaining accurate annotations. The AI models were trained on generic segmentation datasets like ADE-20K. The authors engaged freelance annotators who were provided with a comprehensive project overview, underwent training sessions on the annotation tool, and received a glossary of objects. They established guidelines to ensure uniform segmentations across frames, particularly regarding containers, packaging, transparency, and occlusion. For instance, a rule was implemented for ‘containers’ wherein inactive objects within cupboards were not segmented to maintain the integrity of the cupboard’s context. To maintain temporal consistency, each video was annotated by a single annotator. Furthermore, manual verification was conducted for each video, actively addressing any annotator uncertainties. An interface was developed to facilitate rapid correction of annotations, with a specific emphasis on preserving temporal coherence.
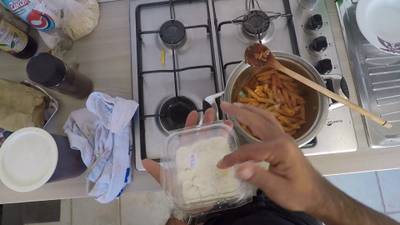
Segmentations from VISOR with entity names (legend) and ongoing action (above).
EPIC-KITCHENS-100 encompasses 300 noun classes, which categorize open-vocabulary entity names. Among these, VISOR segmentations encompass 252 classes observed within the annotated 36-hour dataset. VISOR also introduces 263 new entities spanning across 83 noun classes. To integrate these new entities seamlessly, they were manually re-clustered into the existing 300 EPIC-KITCHENS classes. These additional entities primarily consist of objects commonly manipulated in daily activities but not explicitly mentioned in narrations. For example, entities like ‘coffee package’ are grouped under the ‘package’ class. Additionally, five new classes were introduced, including left:hand, right:hand (previously grouped under ‘hand’), left:glove, right:glove (previously under ‘glove’), and foot. The activities captured in VISOR primarily revolve around hands interacting with the surroundings. To enhance the dataset’s utility, the authors augment each hand segmentation by incorporating contact information, indicating whether the hand is in contact with any object and, if so, which segment it is best described as contacting. Candidate segments are identified as those bordering the hand, from which human annotators make selections. Alternatively, annotators may identify the hand with in contact tag: “not in physical contact” with any object or choose “none of the above” for occluded hands. In cases where a consensus cannot be reached among annotators, the authors mark these instances as inconclusive. During training and evaluation, hands annotated with “none of the above” or deemed inconclusive are disregarded. In certain kitchen scenarios, hands may be obscured by gloves, such as during washing, cleaning, or handling hot surfaces with oven mitts. Consequently, the authors also annotate gloves to identify instances where they are worn on the hand. These gloves are further annotated along with their relations to active objects, mirroring the process applied to visible hands. Both hands and on-hand gloves are considered as acting hands for all relevant benchmarks.
Note: More information about the correspondence of actions to frames in the dataset can be downloaded from the link.
 Homepage
 Research Paper
 GitHub
Summary #
EPIC-KITCHENS VISOR: VIdeo Segmentations and Object Relations is a dataset for semantic segmentation, object detection, and identification tasks. It is applicable or relevant across various domains. Also, it is used in the food industry.
The dataset consists of 50729 images with 367002 labeled objects belonging to 305 different classes including hand:right, hand:left, hob, and other: pan, sink, knife, board:chopping, tap, spoon, bowl, plate, water, cupboard, pot, lid, sponge, spatula, bag, fridge, package, drawer, fork, bottle, cup, onion, box, rack:drying, meat, and 277 more.
Images in the VISOR dataset have pixel-level semantic segmentation annotations. There are 10125 (20% of the total) unlabeled images (i.e. without annotations). There are 3 splits in the dataset: train (32857 images), test (10125 images), and val (7747 images). Additionally, every image marked with its subsequence, kitchen, action and video tags. Labels marked with its instance, exhaustively annotated, category and in contact tags. Explore it in Supervisely labeling tool. The dataset was released in 2022 by the University of Bristol, UK, University of Michigan, USA, and University of Toronto, Canada.
Here is a visualized example for randomly selected sample classes:
Explore #
VISOR dataset has 50729 images. Click on one of the examples below or open "Explore" tool anytime you need to view dataset images with annotations. This tool has extended visualization capabilities like zoom, translation, objects table, custom filters and more. Hover the mouse over the images to hide or show annotations.


Class balance #
There are 305 annotation classes in the dataset. Find the general statistics and balances for every class in the table below. Click any row to preview images that have labels of the selected class. Sort by column to find the most rare or prevalent classes.

Class ㅤ | Images ㅤ | Objects ㅤ | Count on image average | Area on image average |
|---|---|---|---|---|
hand:right➔ polygon | 33645 | 37890 | 1.13 | 4.49% |
hand:left➔ polygon | 31206 | 35872 | 1.15 | 3.86% |
hob➔ polygon | 9240 | 23184 | 2.51 | 14.85% |
pan➔ polygon | 8658 | 21620 | 2.5 | 5.83% |
sink➔ polygon | 8057 | 19790 | 2.46 | 25.19% |
knife➔ polygon | 7077 | 9027 | 1.28 | 0.64% |
board:chopping➔ polygon | 6739 | 20452 | 3.03 | 7.56% |
tap➔ polygon | 6285 | 7793 | 1.24 | 1.67% |
spoon➔ polygon | 5518 | 7344 | 1.33 | 0.57% |
bowl➔ polygon | 5034 | 10401 | 2.07 | 4.13% |
Images #
Explore every single image in the dataset with respect to the number of annotations of each class it has. Click a row to preview selected image. Sort by any column to find anomalies and edge cases. Use horizontal scroll if the table has many columns for a large number of classes in the dataset.
Class sizes #
The table below gives various size properties of objects for every class. Click a row to see the image with annotations of the selected class. Sort columns to find classes with the smallest or largest objects or understand the size differences between classes.
Class | Object count | Avg area | Max area | Min area | Min height | Min height | Max height | Max height | Avg height | Avg height | Min width | Min width | Max width | Max width |
|---|---|---|---|---|---|---|---|---|---|---|---|---|---|---|
hand:right polygon | 37890 | 3.96% | 64.88% | 0% | 2px | 0.19% | 1080px | 100% | 430px | 39.79% | 2px | 0.1% | 1920px | 100% |
hand:left polygon | 35872 | 3.33% | 47.99% | 0% | 2px | 0.19% | 1080px | 100% | 392px | 36.33% | 2px | 0.1% | 1870px | 97.4% |
hob polygon | 23184 | 5.92% | 59.19% | 0% | 2px | 0.19% | 1080px | 100% | 374px | 34.63% | 2px | 0.1% | 1748px | 91.04% |
pan polygon | 21620 | 2.56% | 33.12% | 0% | 2px | 0.19% | 1080px | 100% | 292px | 27% | 2px | 0.1% | 1501px | 78.18% |
board:chopping polygon | 20452 | 2.58% | 48.72% | 0% | 2px | 0.19% | 1080px | 100% | 232px | 21.44% | 2px | 0.1% | 1806px | 94.06% |
sink polygon | 19790 | 10.32% | 73.79% | 0% | 1px | 0.09% | 1080px | 100% | 472px | 43.73% | 1px | 0.05% | 1920px | 100% |
bowl polygon | 10401 | 2.12% | 46.71% | 0% | 2px | 0.19% | 1080px | 100% | 228px | 21.09% | 2px | 0.1% | 1075px | 55.99% |
plate polygon | 9389 | 2.35% | 43.09% | 0% | 2px | 0.19% | 1080px | 100% | 247px | 22.88% | 2px | 0.1% | 1805px | 94.01% |
knife polygon | 9027 | 0.49% | 7.05% | 0% | 7px | 0.65% | 820px | 75.93% | 220px | 20.38% | 4px | 0.21% | 1072px | 55.83% |
tap polygon | 7793 | 1.34% | 10.96% | 0% | 5px | 0.46% | 891px | 82.5% | 242px | 22.37% | 2px | 0.1% | 995px | 51.82% |
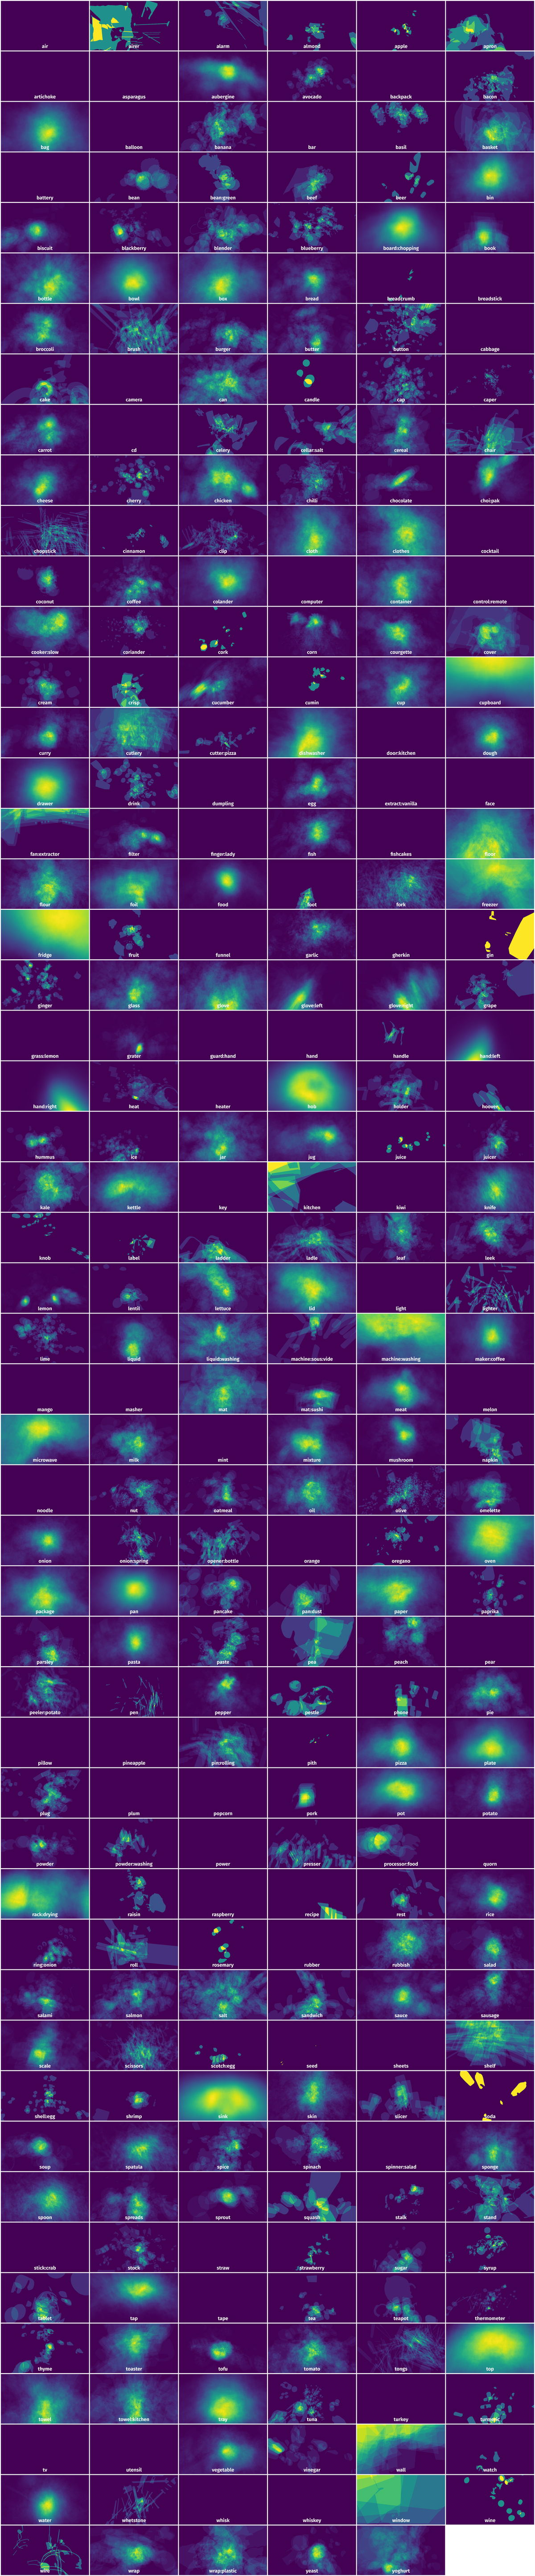
Spatial Heatmap #
The heatmaps below give the spatial distributions of all objects for every class. These visualizations provide insights into the most probable and rare object locations on the image. It helps analyze objects' placements in a dataset.
Objects #
Table contains all 100510 objects. Click a row to preview an image with annotations, and use search or pagination to navigate. Sort columns to find outliers in the dataset.
Object ID ㅤ | Class ㅤ | Image name click row to open | Image size height x width | Height ㅤ | Height ㅤ | Width ㅤ | Width ㅤ | Area ㅤ |
|---|---|---|---|---|---|---|---|---|
1➔ | colander polygon | P06_102_frame_0000007217.jpg | 1080 x 1920 | 591px | 54.72% | 410px | 21.35% | 6.15% |
2➔ | colander polygon | P06_102_frame_0000007217.jpg | 1080 x 1920 | 353px | 32.69% | 340px | 17.71% | 4.49% |
3➔ | hand:right polygon | P06_102_frame_0000007217.jpg | 1080 x 1920 | 354px | 32.78% | 231px | 12.03% | 2.16% |
4➔ | flour polygon | P06_102_frame_0000007217.jpg | 1080 x 1920 | 353px | 32.69% | 340px | 17.71% | 4.49% |
5➔ | hand:left polygon | P06_102_frame_0000007217.jpg | 1080 x 1920 | 369px | 34.17% | 427px | 22.24% | 2.66% |
6➔ | bowl polygon | P06_102_frame_0000007217.jpg | 1080 x 1920 | 408px | 37.78% | 171px | 8.91% | 0.87% |
7➔ | bowl polygon | P06_102_frame_0000007217.jpg | 1080 x 1920 | 172px | 15.93% | 220px | 11.46% | 0.49% |
8➔ | bowl polygon | P06_102_frame_0000007217.jpg | 1080 x 1920 | 34px | 3.15% | 117px | 6.09% | 0.09% |
9➔ | hand:right polygon | P06_101_frame_0000016830.jpg | 1080 x 1920 | 371px | 34.35% | 335px | 17.45% | 3.29% |
10➔ | board:chopping polygon | P06_101_frame_0000016830.jpg | 1080 x 1920 | 57px | 5.28% | 16px | 0.83% | 0.02% |
License #
All annotations are owned by the University of Bristol under the research license agreement 2021 - 3107, signed by all parties on Jan 2022.
All files in this dataset are copyright by us and published under the Creative Commons Attribution-NonCommerial 4.0 International License, found here. This means that you must give appropriate credit, provide a link to the license, and indicate if changes were made. You may do so in any reasonable manner, but not in any way that suggests the licensor endorses you or your use. You may not use the material for commercial purposes.
For commercial licenses, contact the University of Bristol at: uob-epic-kitchens@bristol.ac.uk
Citation #
If you make use of the Epic Kitchens VISOR data, please cite the following reference:
@inproceedings{VISOR2022,
  title = {EPIC-KITCHENS VISOR Benchmark: VIdeo Segmentations and Object Relations},
  author = {Darkhalil, Ahmad and Shan, Dandan and Zhu, Bin and Ma, Jian and Kar, Amlan and Higgins, Richard and Fidler, Sanja and Fouhey, David and Damen, Dima},
  booktitle = {Proceedings of the Neural Information Processing Systems (NeurIPS) Track on Datasets and Benchmarks},
  year = {2022}
}
If you are happy with Dataset Ninja and use provided visualizations and tools in your work, please cite us:
@misc{ visualization-tools-for-epic-kitchens-visor-dataset,
  title = { Visualization Tools for VISOR Dataset },
  type = { Computer Vision Tools },
  author = { Dataset Ninja },
  howpublished = { \url{ https://datasetninja.com/epic-kitchens-visor } },
  url = { https://datasetninja.com/epic-kitchens-visor },
  journal = { Dataset Ninja },
  publisher = { Dataset Ninja },
  year = { 2026 },
  month = { jul },
  note = { visited on 2026-07-28 },
}
Download #
Dataset VISOR can be downloaded in Supervisely format:
As an alternative, it can be downloaded with dataset-tools package:
pip install --upgrade dataset-tools
… using following python code:
import dataset_tools as dtools

dtools.download(dataset='VISOR', dst_dir='~/dataset-ninja/')
Make sure not to overlook the python code example available on the Supervisely Developer Portal. It will give you a clear idea of how to effortlessly work with the downloaded dataset.
The data in original format can be downloaded here.
Disclaimer #
Our gal from the legal dep told us we need to post this:
Dataset Ninja provides visualizations and statistics for some datasets that can be found online and can be downloaded by general audience. Dataset Ninja is not a dataset hosting platform and can only be used for informational purposes. The platform does not claim any rights for the original content, including images, videos, annotations and descriptions. Joint publishing is prohibited.
You take full responsibility when you use datasets presented at Dataset Ninja, as well as other information, including visualizations and statistics we provide. You are in charge of compliance with any dataset license and all other permissions. You are required to navigate datasets homepage and make sure that you can use it. In case of any questions, get in touch with us at hello@datasetninja.com.