

Introduction #
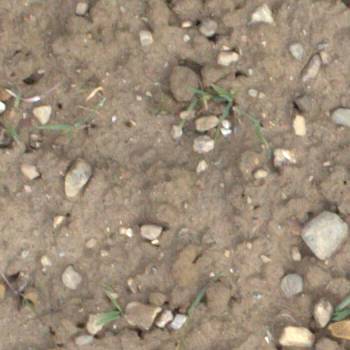
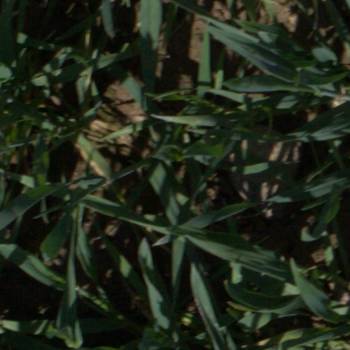
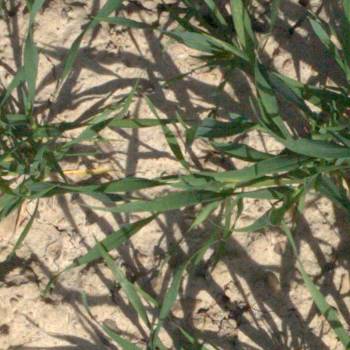
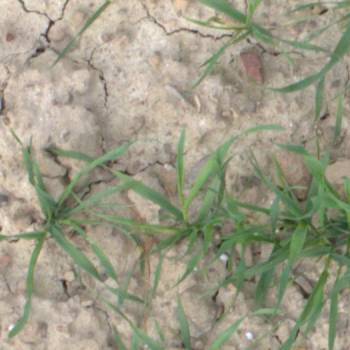
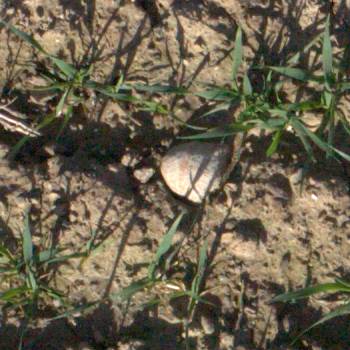
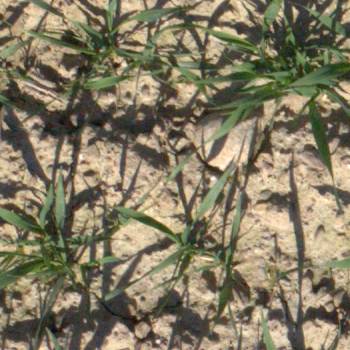
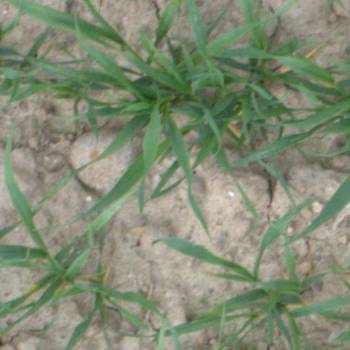
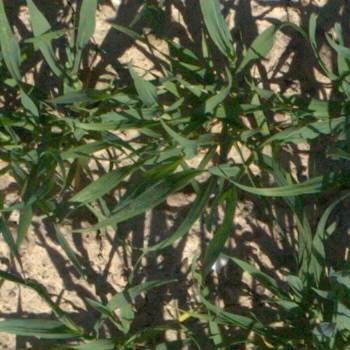
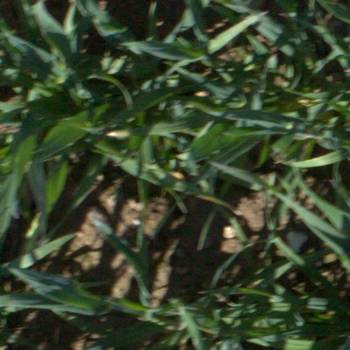
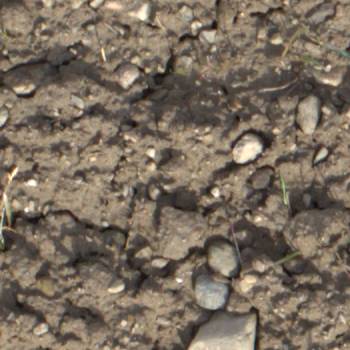
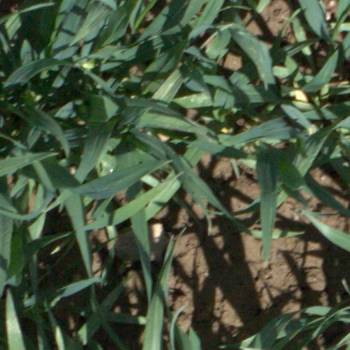
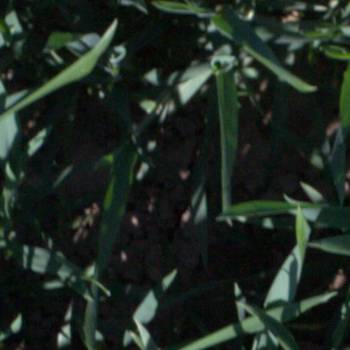
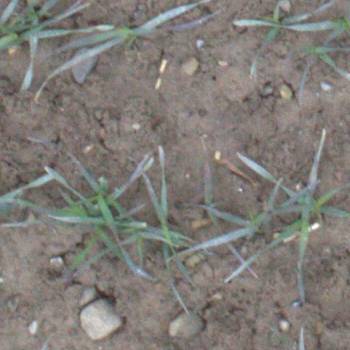
The authors of EWS: Eschikon Wheat Segmentation Dataset dataset emphasize the importance of robust automated leaf and background segmentation in high-throughput field phenotyping. They present a novel workflow utilizing DeepLab v3+ and a diverse dataset of 190 RGB images featuring winter wheat plants from various genotypes and developmental stages, captured under different outdoor conditions. The dataset comprises 350×350 pixel image patches sourced from a vast unlabeled dataset containing around 100,000 20 Mpx RGB images of diverse winter wheat genotypes, collected between 2017 and 2020 using a Canon 5D Mark II. These images were captured with varying ISO, aperture, and shutter speed settings to adapt to changing illumination conditions. The dataset spans the entire growth cycle of winter wheat, encompassing situations with fluctuating illumination and soil moisture levels.
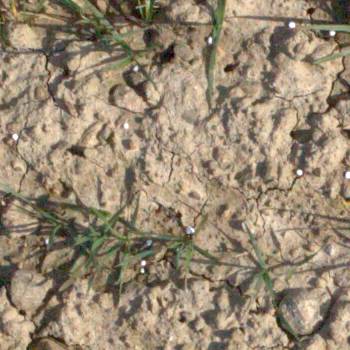
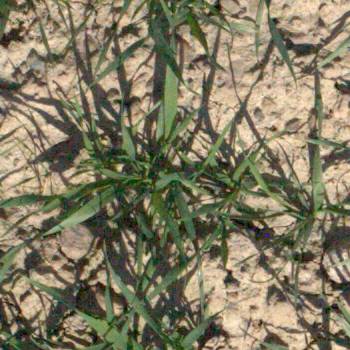
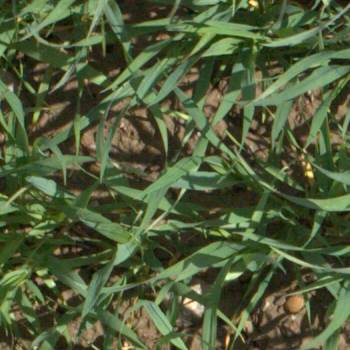
For the training set, the authors selected images of wheat canopies from emergence to stem elongation, striving for a balanced representation of different imaging scenarios. They prioritized the growth stage and limited the selection to recognizable seedlings up to stem elongation, a critical phase for yield component development. The images were further grouped based on illumination conditions (direct and diffuse light), although this grouping simplified the lighting dynamics. Consequently, the dataset includes an overrepresentation of images in the direct light category (approximately 55%). Additionally, the wheat genotypes were divided into random and specific categories, resulting in a partitioned EWS dataset.
The authors processed a subset of 190 RGB images, cropping them into 350×350 pixel patches and manually annotating binary masks for plants and soil using GIMP6. The chosen patch size ensured the visibility of at least two wheat rows, even after image rotations or cropping. The annotated masks were exported as lossless 8-bit monochromatic PNG images, requiring approximately 80 hours of combined annotation.
The dataset also includes metadata like image timestamps, camera settings, and weather station data. Data acquisition dates focus on spring and late fall, corresponding to the winter wheat growth cycle. Images were captured at various times of the day, with camera settings adjusted for lighting conditions\
 Homepage
 Research Paper
Summary #
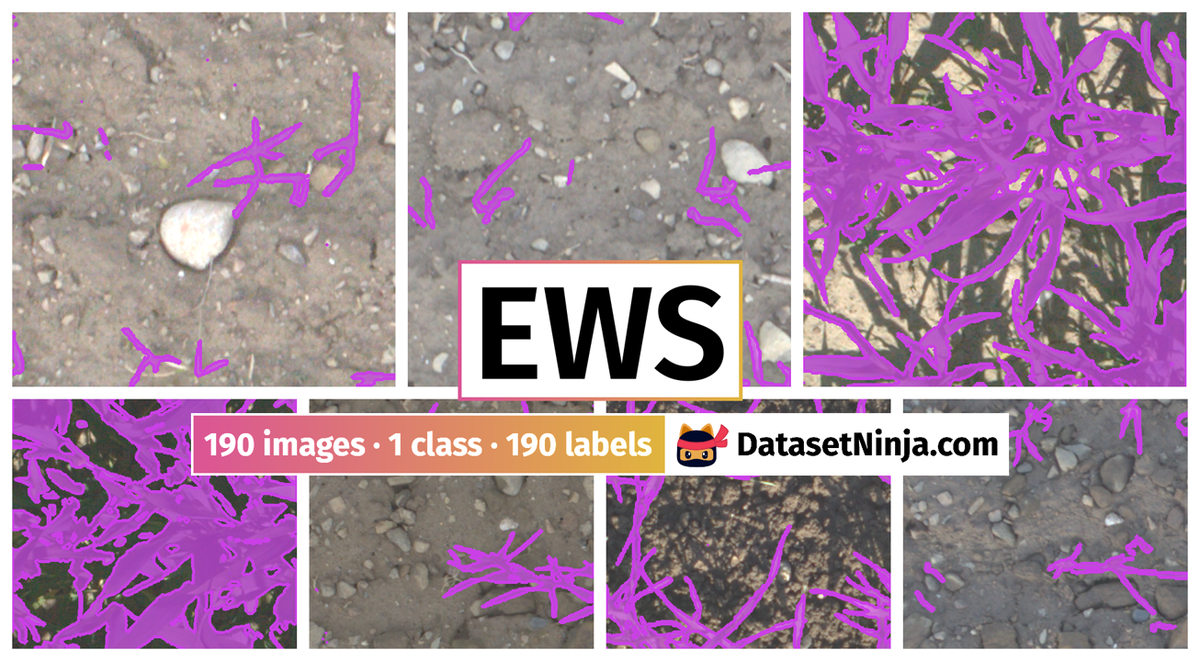
EWS: Eschikon Wheat Segmentation Dataset is a dataset for semantic segmentation and unsupervised learning tasks. It is used in the agricultural industry.
The dataset consists of 190 images with 190 labeled objects belonging to 1 single class (plant).
Images in the EWS dataset have pixel-level semantic segmentation annotations. All images are labeled (i.e. with annotations). There are 3 splits in the dataset: train (142 images), test (24 images), and validation (24 images). The dataset was released in 2021 by the ETH Zurich, Switzerland and Agroscope, Switzerland.
Explore #
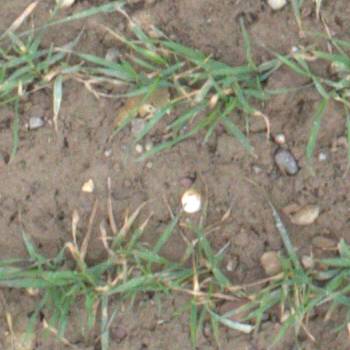
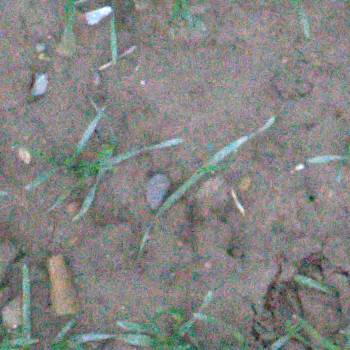
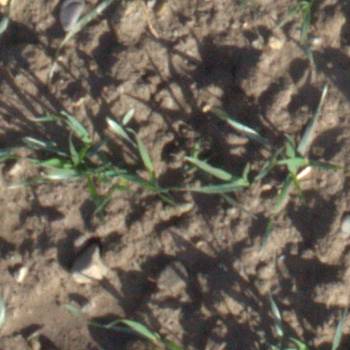
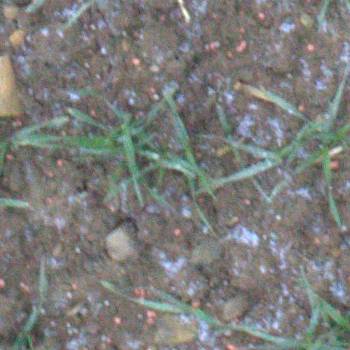
EWS dataset has 190 images. Click on one of the examples below or open "Explore" tool anytime you need to view dataset images with annotations. This tool has extended visualization capabilities like zoom, translation, objects table, custom filters and more. Hover the mouse over the images to hide or show annotations.


Class balance #
There are 1 annotation classes in the dataset. Find the general statistics and balances for every class in the table below. Click any row to preview images that have labels of the selected class. Sort by column to find the most rare or prevalent classes.

Class ㅤ | Images ㅤ | Objects ㅤ | Count on image average | Area on image average |
|---|---|---|---|---|
plant➔ mask | 190 | 190 | 1 | 23.78% |
Images #
Explore every single image in the dataset with respect to the number of annotations of each class it has. Click a row to preview selected image. Sort by any column to find anomalies and edge cases. Use horizontal scroll if the table has many columns for a large number of classes in the dataset.
Object distribution #
Interactive heatmap chart for every class with object distribution shows how many images are in the dataset with a certain number of objects of a specific class. Users can click cell and see the list of all corresponding images.
Class sizes #
The table below gives various size properties of objects for every class. Click a row to see the image with annotations of the selected class. Sort columns to find classes with the smallest or largest objects or understand the size differences between classes.
Class | Object count | Avg area | Max area | Min area | Min height | Min height | Max height | Max height | Avg height | Avg height | Min width | Min width | Max width | Max width |
|---|---|---|---|---|---|---|---|---|---|---|---|---|---|---|
plant mask | 190 | 23.78% | 76.57% | 0.47% | 244px | 69.71% | 350px | 100% | 342px | 97.7% | 204px | 58.29% | 350px | 100% |
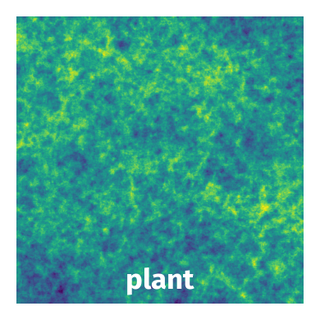
Spatial Heatmap #
The heatmaps below give the spatial distributions of all objects for every class. These visualizations provide insights into the most probable and rare object locations on the image. It helps analyze objects' placements in a dataset.
Objects #
Table contains all 190 objects. Click a row to preview an image with annotations, and use search or pagination to navigate. Sort columns to find outliers in the dataset.
Object ID ㅤ | Class ㅤ | Image name click row to open | Image size height x width | Height ㅤ | Height ㅤ | Width ㅤ | Width ㅤ | Area ㅤ |
|---|---|---|---|---|---|---|---|---|
1➔ | plant mask | FPWW0180135_RGB1_20170505_154117_6.png | 350 x 350 | 350px | 100% | 350px | 100% | 50.03% |
2➔ | plant mask | FPWW0180741_RGB1_20170308_135245_6.png | 350 x 350 | 328px | 93.71% | 350px | 100% | 2.77% |
3➔ | plant mask | FPWW0180375_RGB1_20170222_133519_6.png | 350 x 350 | 345px | 98.57% | 334px | 95.43% | 2.04% |
4➔ | plant mask | FPWW0180049_RGB1_20170315_102908_6.png | 350 x 350 | 340px | 97.14% | 350px | 100% | 7.95% |
5➔ | plant mask | FPWW0180357_RGB1_20170405_173042_6.png | 350 x 350 | 350px | 100% | 350px | 100% | 23.65% |
6➔ | plant mask | FPWW0180591_RGB1_20170510_160229_6.png | 350 x 350 | 350px | 100% | 350px | 100% | 58.82% |
7➔ | plant mask | FPWW0180139_RGB1_20170412_134921_6.png | 350 x 350 | 350px | 100% | 350px | 100% | 31.26% |
8➔ | plant mask | FPWW0180367_RGB1_20170412_145913_6.png | 350 x 350 | 350px | 100% | 350px | 100% | 46.53% |
9➔ | plant mask | FPWW0180049_RGB1_20170517_142522_6.png | 350 x 350 | 350px | 100% | 350px | 100% | 57.37% |
10➔ | plant mask | FPWW0180094_RGB1_20170308_114711_6.png | 350 x 350 | 348px | 99.43% | 350px | 100% | 2.23% |
License #
EWS: Eschikon Wheat Segmentation Dataset is under CC BY-SA 4.0 license.
Citation #
If you make use of the EWS data, please cite the following reference:
@MISC{20.500.11850/512332,
  copyright = {Creative Commons Attribution-ShareAlike 4.0 International},
  year = {2021-11-30},
  type = {Dataset},
  author = {Zenkl, Radek and Kirchgessner, Norbert and Roth, Lukas and Hund, Andreas and Walter, Achim and Aasen, Helge},
  size = {98.4 MB},
  language = {en},
  address = {Zurich},
  publisher = {ETH Zurich},
  DOI = {10.3929/ethz-b-000512332},
  title = {Eschikon Wheat Segmentation (EWS) Dataset},
  Note = {When using this dataset, please cite the following publication https://doi.org/10.3389/fpls.2021.774068}
}
If you are happy with Dataset Ninja and use provided visualizations and tools in your work, please cite us:
@misc{ visualization-tools-for-eschikon-wheat-segmentation-dataset,
  title = { Visualization Tools for EWS Dataset },
  type = { Computer Vision Tools },
  author = { Dataset Ninja },
  howpublished = { \url{ https://datasetninja.com/eschikon-wheat-segmentation } },
  url = { https://datasetninja.com/eschikon-wheat-segmentation },
  journal = { Dataset Ninja },
  publisher = { Dataset Ninja },
  year = { 2026 },
  month = { jul },
  note = { visited on 2026-07-26 },
}
Download #
Dataset EWS can be downloaded in Supervisely format:
As an alternative, it can be downloaded with dataset-tools package:
pip install --upgrade dataset-tools
… using following python code:
import dataset_tools as dtools

dtools.download(dataset='EWS', dst_dir='~/dataset-ninja/')
Make sure not to overlook the python code example available on the Supervisely Developer Portal. It will give you a clear idea of how to effortlessly work with the downloaded dataset.
The data in original format can be downloaded here.
Disclaimer #
Our gal from the legal dep told us we need to post this:
Dataset Ninja provides visualizations and statistics for some datasets that can be found online and can be downloaded by general audience. Dataset Ninja is not a dataset hosting platform and can only be used for informational purposes. The platform does not claim any rights for the original content, including images, videos, annotations and descriptions. Joint publishing is prohibited.
You take full responsibility when you use datasets presented at Dataset Ninja, as well as other information, including visualizations and statistics we provide. You are in charge of compliance with any dataset license and all other permissions. You are required to navigate datasets homepage and make sure that you can use it. In case of any questions, get in touch with us at hello@datasetninja.com.