
Introduction #
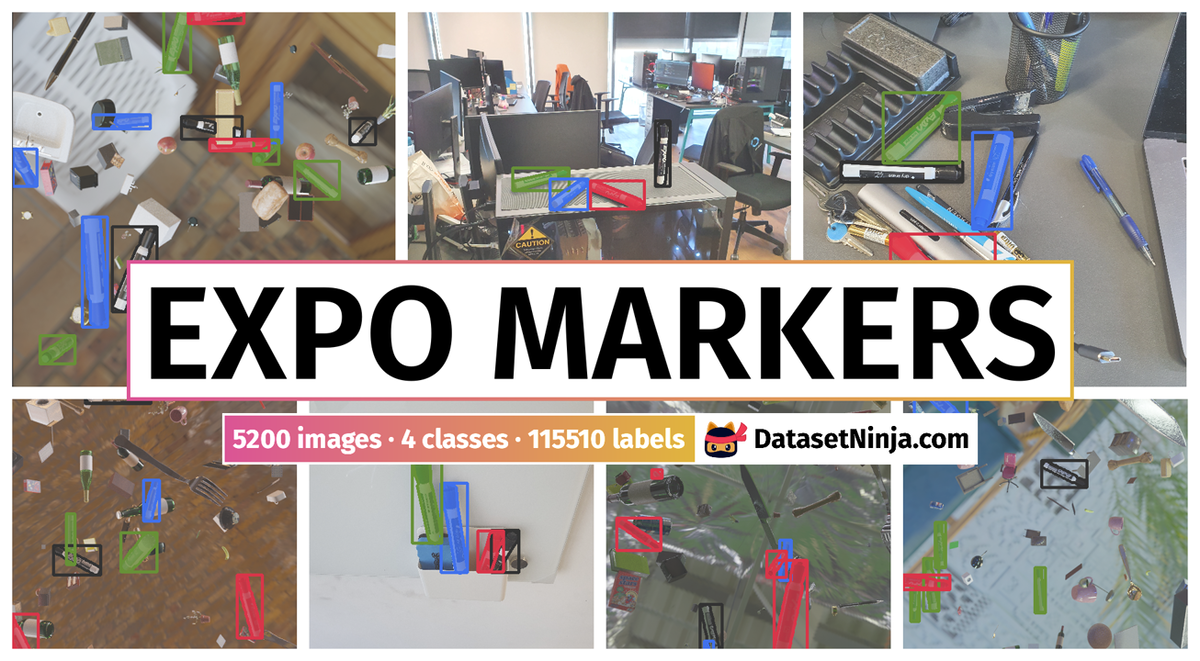
The authors created the Expo Markers Dataset - new public synthetic dataset intended for detection and segmentation tasks. The dataset comprises 5,000 synthetic photorealistic images along with 200 real images, each accompanied by its corresponding pixel-perfect segmentation ground truth. The authors aimed to achieve superior performance on manually gathered and annotated real-world data featuring custom objects. To accomplish this, they generated 3D models of the target objects as well as potential distraction objects, situating them within a simulated environment.
Motivation
In contemporary times, supervised deep learning algorithms, particularly Convolutional Neural Networks (CNNs), have surpassed classical machine learning and computer vision algorithms in performance across standard tasks. While these algorithms achieve state-of-the-art results, they demand large volumes of labeled data to deliver robust solutions for real-world scenarios. However, the process of data collection and labeling is both costly and time-consuming, and the quality of available data varies significantly among providers, especially in tasks requiring pixel-wise accuracy such as segmentation. In some instances, extracting labels manually becomes nearly impossible. Thus, labeled data continues to present a bottleneck in enhancing outcomes. In numerous computer vision applications like autonomous driving, security systems, smart stores, and interactive robotics, end-users anticipate high-quality, dependable results. Therefore, employing well-established and superior quality supervised machine learning algorithms trained on extensive datasets remains the preferred approach. Although techniques like few-shot learning, weakly supervised learning, unsupervised learning, and deep feature extraction are gaining traction and displaying promising results, supervised learning remains straightforward, efficient, and easily trainable.
The potential of synthetic data has been apparent since its inception: datasets generated through computational algorithms capable of replicating semantic and visual patterns observed in the real world. Synthetic data facilitates the training of machine learning algorithms without compromising privacy (e.g., facial data) or succumbing to inherent biases in the data (e.g., ensuring equal representation of genders in the dataset). Furthermore, synthetic data offers scalability, as additional data can always be generated, and it addresses edge cases—instances where manually gathering data proves arduous or impractical. Over recent years, synthetic data has shown promise across various domains, from medical research, where patient privacy is paramount, to fraud detection, where synthetic datasets aid in testing and bolstering the robustness of security solutions. Within the computer vision field, synthetic data generation has gained significant traction as a solution to the data bottleneck challenge.
Dataset description
The Expo Markers Dataset contains 5,000 synthetic photorealistic images and 200 real images with their corresponding pixel-perfect segmentation ground truth. Image resolution is 1024x1024 and each image contains, on average, 13 marker object instances and 80 distractor object instances.
Samples from Synthetic dataset.
To assess and compare the performance of the synthetic data generated by the authors, they collected two manually gathered datasets named Real A and Real B. These datasets were acquired using different devices and in distinct environments, which the authors perceive as representing two distinct domains. Both datasets exhibit a mix of simplicity and complexity, featuring images with varying levels of occlusions and objects resembling markers, such as pens, pencils, and other brands of markers. The majority of images in the manually-gathered datasets contain four markers, each representing a different marker color. Real A comprises 250 images captured with a Samsung S10+ camera and is specifically utilized for evaluation purposes. On the other hand, Real B consists of 1,000 images captured with an Apple iPhone 7 camera, serving dual purposes for both training and evaluation.
Note: The authors provided only 200 real images for download, without division into Real A and Real B.
Expo Markers Dataset.
Initially, the authors developed a highly realistic 3D representation of the target class, focusing on Expo markers. Skilled 3D artists meticulously crafted these representations, ensuring precise modeling for authenticity. Additionally, a collection of photorealistic items served as distractors for the algorithm.
Within the 3D environment, the target markers were strategically positioned to be visible to the simulated camera lens. Concurrently, the distractor items were incorporated into the same scene, intensifying the visual complexity. Notably, the composition of objects, backgrounds, scene lighting, occlusions, and the randomness of orientation deliberately deviated from real-world distributions. Instead, they aimed to challenge the algorithm by providing a more demanding dataset for training. The primary objective was to equip the algorithm with the capability to learn a resilient representation capable of addressing extreme scenarios encountered in real-world settings.
The images were rendered using the Cycles rendering engine, accompanied by the creation of segmentation maps. This approach ensures the generation of photorealistic images coupled with pixel-level annotations. Several calibration iterations were undertaken to establish appropriate parameter values governing the placement of objects, lighting conditions, and frequency of appearances. Leveraging the simplicity of synthetic data generation, subsequent iterations were swiftly executed, allowing for experimentation with various parameters until desirable outcomes were attained.
 Homepage
 Research Paper
 Blog Post
Summary #
Expo Markers Dataset is a dataset for instance segmentation, object detection, and semantic segmentation tasks. It is used in the surveillance domain.
The dataset consists of 5200 images with 115510 labeled objects belonging to 4 different classes including marker green, marker blue, marker red, and other: marker black.
Images in the Expo Markers dataset have pixel-level instance segmentation and bounding box annotations. Due to the nature of the instance segmentation task, it can be automatically transformed into a semantic segmentation task (only one mask for every class). All images are labeled (i.e. with annotations). There are 2 splits in the dataset: synthetic (5000 images) and real (200 images). The dataset was released in 2021 by the Datagen Tech, Israel.
Explore #
Expo Markers dataset has 5200 images. Click on one of the examples below or open "Explore" tool anytime you need to view dataset images with annotations. This tool has extended visualization capabilities like zoom, translation, objects table, custom filters and more. Hover the mouse over the images to hide or show annotations.


Class balance #
There are 4 annotation classes in the dataset. Find the general statistics and balances for every class in the table below. Click any row to preview images that have labels of the selected class. Sort by column to find the most rare or prevalent classes.

Class ㅤ | Images ㅤ | Objects ㅤ | Count on image average | Area on image average |
|---|---|---|---|---|
marker green➔ any | 4915 | 28936 | 5.89 | 3.38% |
marker blue➔ any | 4910 | 28631 | 5.83 | 3.39% |
marker red➔ any | 4890 | 28925 | 5.92 | 3.42% |
marker black➔ any | 4888 | 29018 | 5.94 | 3.42% |
Co-occurrence matrix #
Co-occurrence matrix is an extremely valuable tool that shows you the images for every pair of classes: how many images have objects of both classes at the same time. If you click any cell, you will see those images. We added the tooltip with an explanation for every cell for your convenience, just hover the mouse over a cell to preview the description.
Images #
Explore every single image in the dataset with respect to the number of annotations of each class it has. Click a row to preview selected image. Sort by any column to find anomalies and edge cases. Use horizontal scroll if the table has many columns for a large number of classes in the dataset.
Object distribution #
Interactive heatmap chart for every class with object distribution shows how many images are in the dataset with a certain number of objects of a specific class. Users can click cell and see the list of all corresponding images.
Class sizes #
The table below gives various size properties of objects for every class. Click a row to see the image with annotations of the selected class. Sort columns to find classes with the smallest or largest objects or understand the size differences between classes.
Class | Object count | Avg area | Max area | Min area | Min height | Min height | Max height | Max height | Avg height | Avg height | Min width | Min width | Max width | Max width |
|---|---|---|---|---|---|---|---|---|---|---|---|---|---|---|
marker black any | 29018 | 0.81% | 9.74% | 0% | 2px | 0.33% | 1498px | 49.54% | 80px | 12.24% | 2px | 0.33% | 1519px | 50.23% |
marker green any | 28936 | 0.81% | 9.79% | 0% | 2px | 0.33% | 1427px | 47.19% | 80px | 12.22% | 2px | 0.33% | 1301px | 41.53% |
marker red any | 28925 | 0.81% | 9.47% | 0% | 2px | 0.33% | 1862px | 61.57% | 80px | 12.27% | 2px | 0.33% | 1105px | 40.17% |
marker blue any | 28631 | 0.82% | 9.96% | 0% | 2px | 0.33% | 1346px | 44.51% | 81px | 12.34% | 2px | 0.33% | 1578px | 40% |
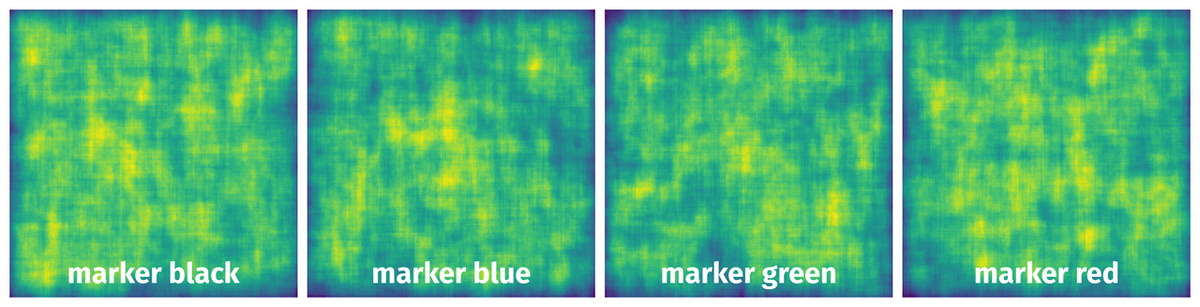
Spatial Heatmap #
The heatmaps below give the spatial distributions of all objects for every class. These visualizations provide insights into the most probable and rare object locations on the image. It helps analyze objects' placements in a dataset.
Objects #
Table contains all 100276 objects. Click a row to preview an image with annotations, and use search or pagination to navigate. Sort columns to find outliers in the dataset.
Object ID ㅤ | Class ㅤ | Image name click row to open | Image size height x width | Height ㅤ | Height ㅤ | Width ㅤ | Width ㅤ | Area ㅤ |
|---|---|---|---|---|---|---|---|---|
1➔ | marker black any | Image03587.png | 600 x 600 | 82px | 13.67% | 56px | 9.33% | 0.4% |
2➔ | marker black any | Image03587.png | 600 x 600 | 82px | 13.67% | 56px | 9.33% | 1.28% |
3➔ | marker black any | Image03587.png | 600 x 600 | 88px | 14.67% | 80px | 13.33% | 0.51% |
4➔ | marker black any | Image03587.png | 600 x 600 | 88px | 14.67% | 80px | 13.33% | 1.96% |
5➔ | marker black any | Image03587.png | 600 x 600 | 88px | 14.67% | 53px | 8.83% | 0.37% |
6➔ | marker black any | Image03587.png | 600 x 600 | 88px | 14.67% | 53px | 8.83% | 1.3% |
7➔ | marker black any | Image03587.png | 600 x 600 | 68px | 11.33% | 33px | 5.5% | 0.26% |
8➔ | marker black any | Image03587.png | 600 x 600 | 68px | 11.33% | 33px | 5.5% | 0.62% |
9➔ | marker black any | Image03587.png | 600 x 600 | 55px | 9.17% | 76px | 12.67% | 0.31% |
10➔ | marker black any | Image03587.png | 600 x 600 | 55px | 9.17% | 76px | 12.67% | 1.16% |
License #
License is unknown for the Expo Markers Dataset dataset.
Citation #
If you make use of the Expo Markers data, please cite the following reference:
@misc{ron2021detection,
  title={Detection and Segmentation of Custom Objects using High Distraction Photorealistic Synthetic Data},
  author={Roey Ron and Gil Elbaz},
  year={2021},
  eprint={2007.14354},
  archivePrefix={arXiv},
  primaryClass={cs.CV}
}
If you are happy with Dataset Ninja and use provided visualizations and tools in your work, please cite us:
@misc{ visualization-tools-for-expo-markers-dataset,
  title = { Visualization Tools for Expo Markers Dataset },
  type = { Computer Vision Tools },
  author = { Dataset Ninja },
  howpublished = { \url{ https://datasetninja.com/expo-markers } },
  url = { https://datasetninja.com/expo-markers },
  journal = { Dataset Ninja },
  publisher = { Dataset Ninja },
  year = { 2026 },
  month = { jul },
  note = { visited on 2026-07-20 },
}
Download #
Please visit dataset homepage to download the data.
Disclaimer #
Our gal from the legal dep told us we need to post this:
Dataset Ninja provides visualizations and statistics for some datasets that can be found online and can be downloaded by general audience. Dataset Ninja is not a dataset hosting platform and can only be used for informational purposes. The platform does not claim any rights for the original content, including images, videos, annotations and descriptions. Joint publishing is prohibited.
You take full responsibility when you use datasets presented at Dataset Ninja, as well as other information, including visualizations and statistics we provide. You are in charge of compliance with any dataset license and all other permissions. You are required to navigate datasets homepage and make sure that you can use it. In case of any questions, get in touch with us at hello@datasetninja.com.