

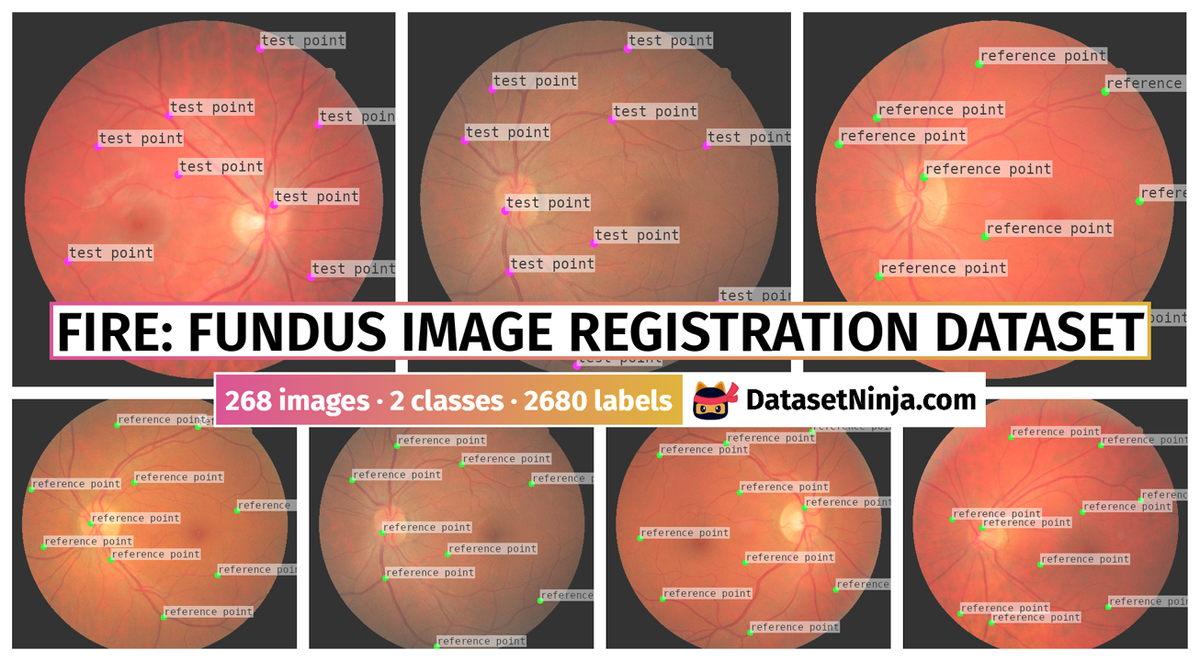
Introduction #
The authors created FIRE: Fundus Image Registration Dataset for the evaluation of retinal image registration methods. It contains 134 retinal image pairs with the aim of assessing the accuracy of retinal image registration. Additionally, ground truth image point correspondences are provided for each image pair, so that they can be used to validate the accuracy of an image registration algorithm. The dataset could also be utilized for other purposes, such as vessel segmentation and optic disc feature analysis or diagnosis, potentially in a comparative way due to the registration of images.
Motivation
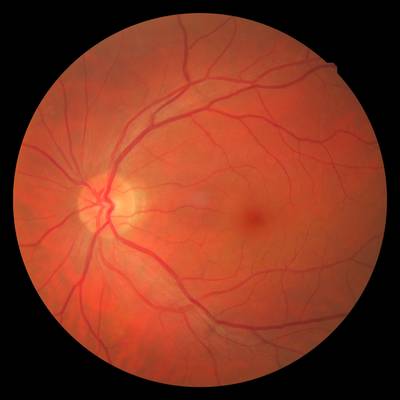
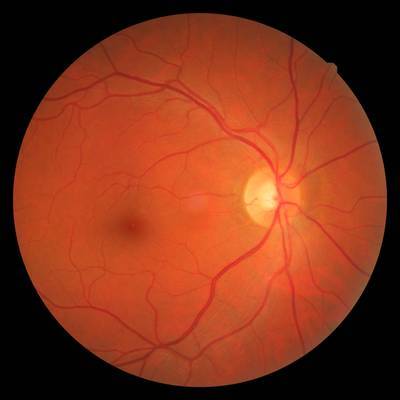
Fundoscopy allows for non-invasive observation of microvascular circulation, aiding in the diagnosis and monitoring of diseases characterized by vasculopathy, such as diabetes and hypertension. Assessing microcirculation by measuring and monitoring vascular morphology is essential in these cases. Image registration—a technique that aligns a test image to the coordinate frame of a reference image so that corresponding points match in both images—can significantly enhance this process in various retinal imaging applications, including super resolution, mosaicing, and longitudinal studies.
Each of these applications involves image pairs with distinct characteristics. In super resolution, overlapping images are combined to create higher resolution and definition images, enabling more precise measurements. Mosaicing stitches together images to provide a larger field of view (FOV), covering a greater retinal surface area, even with minimal overlap between input images. Longitudinal studies track disease progression or regression by comparing images from different examination sessions.
Despite its importance and practical significance, retinal image registration presents challenges. Image pairs often exhibit variations in illumination, color, and contrast, as well as small overlapping areas. Additionally, structural changes in the retina due to disease progression or remission can complicate registration. Accurate measurements are crucial for medical diagnosis, necessitating effective methods, datasets, and protocols to quantify the accuracy of retinal image analysis methods.
Dataset description
FIRE comprises a collection of 129 retinal images forming 134 image pairs. Multiple images may be available for a single eye, allowing for various pair combinations. The images were captured using a Nidek AFC-210 fundus camera with a resolution of 2912 × 2912 pixels and a 45° × 45° field of view (FOV). These images were obtained at the Hypertension Unit of the 3rd Department of Internal Medicine, Papageorgiou Hospital, Aristotle University of Thessaloniki, Greece, from 39 male and female patients aged 19-67 during their regular appointments between 2006 and 2015. Written informed consent was obtained prior to data acquisition and processing.
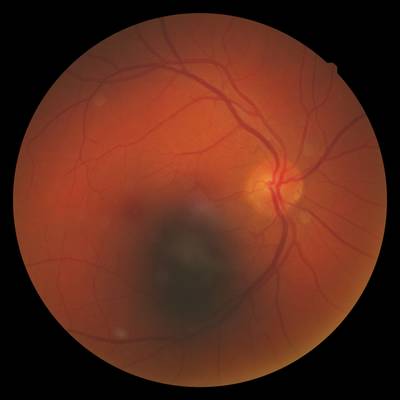
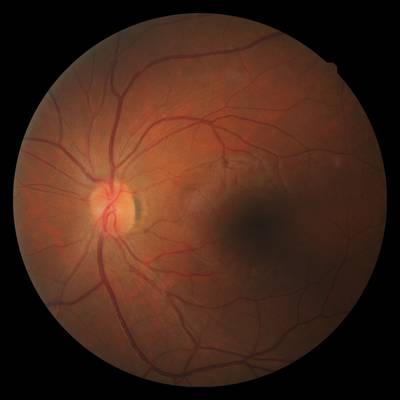
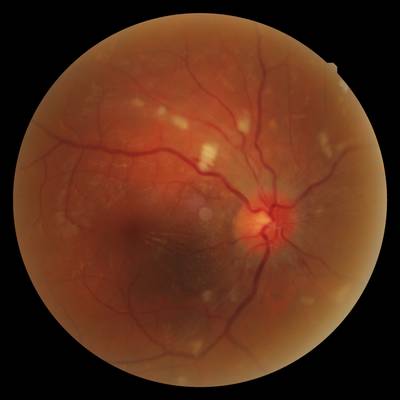
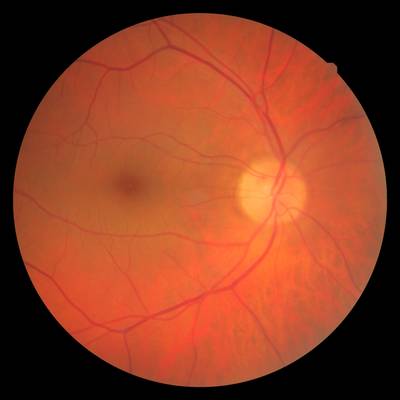
The image pairs are categorized into three types based on their characteristics. Each pair belongs to a single category. Category S includes 71 image pairs with a large spatial overlap (> 75%) and no visual anatomical differences, making them suitable for super resolution applications. Category P comprises 49 image pairs, also lacking visual anatomical differences but with a smaller overlap (< 75%), which are useful for mosaicing applications. Category A consists of 14 image pairs with a large overlap, acquired during different examinations, and featuring visual anatomical differences due to the progression or remission of retinopathy. These differences may manifest as increased vessel tortuosity, microaneurysms, cotton-wool spots, etc., making them ideal for longitudinal studies.
Categories S and P may also include pathological cases affecting the retina’s structure, but as these images lack anatomical differences, retinopathy remains unchanged within each pair. All three categories can feature eye shape deformations caused by myopia or hypermetropia.
| Category S | Category P | Category A | |
|---|---|---|---|
| # Image pairs | 71 | 49 | 14 |
| Approximate overlap | > 75% | < 75% | > 75% |
| Anatomical changes | No | No | Yes |
| Indicative registration application | Super Resolution | Mosaicing | Longitudinal Study |
Characteristics of the FIRE dataset image pair categories.
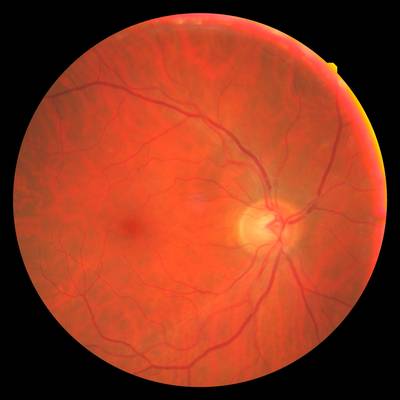
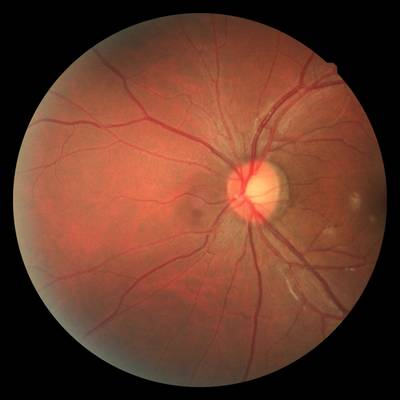
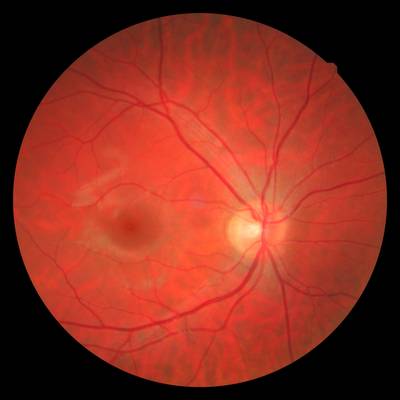
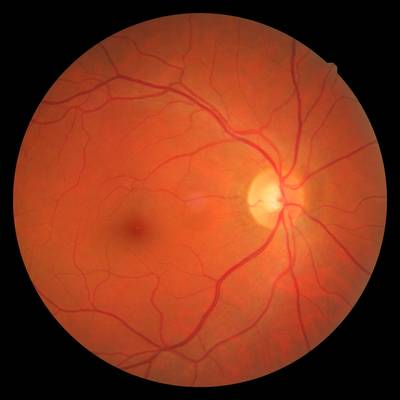
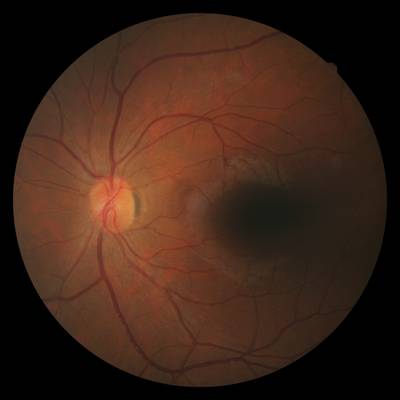
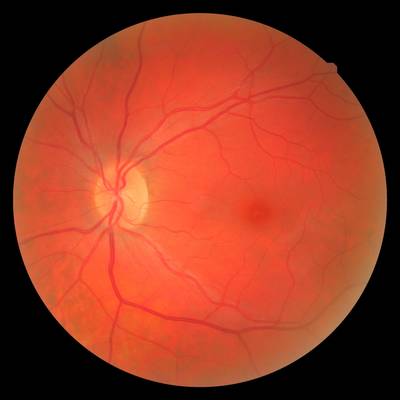
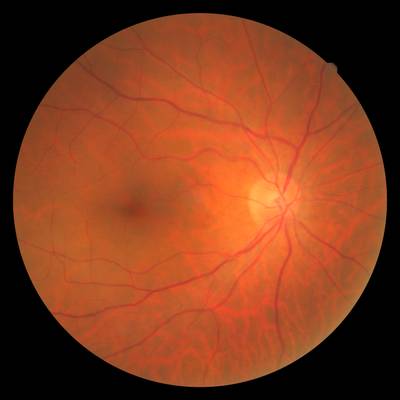
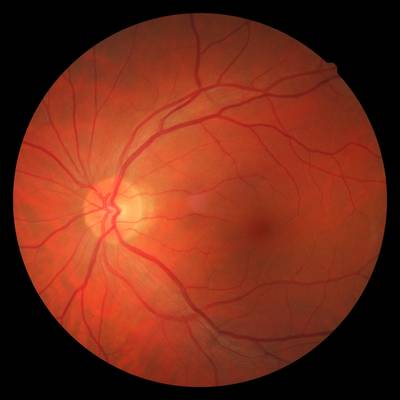
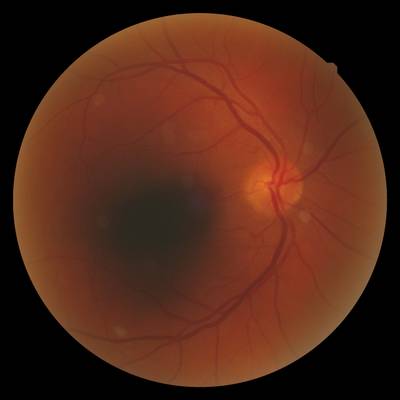
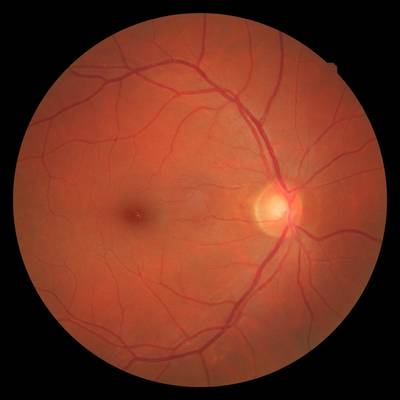
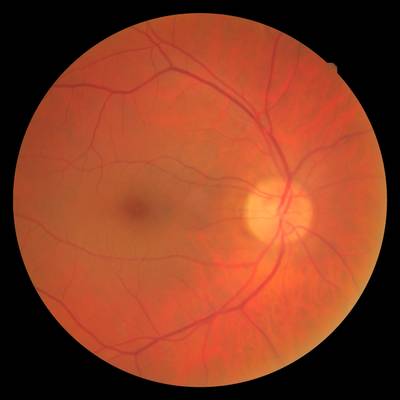
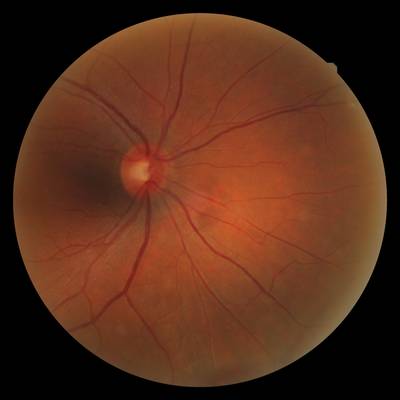
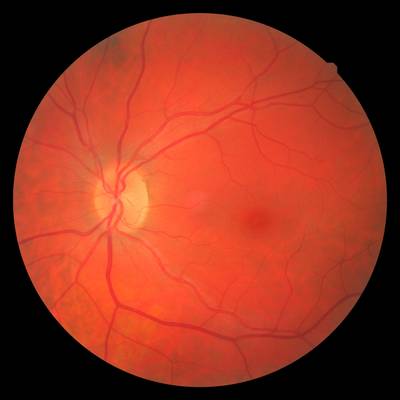
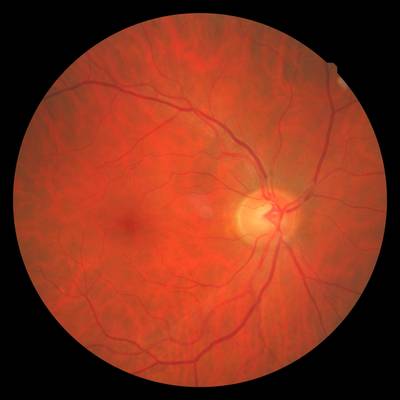
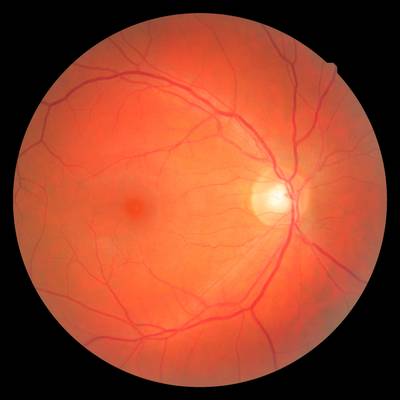
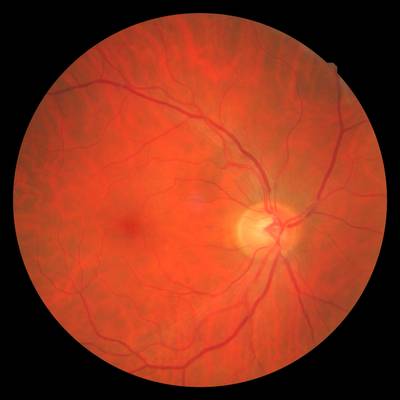
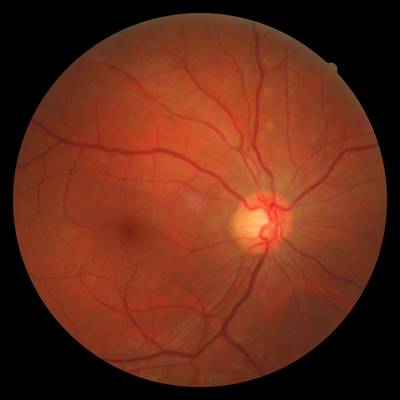
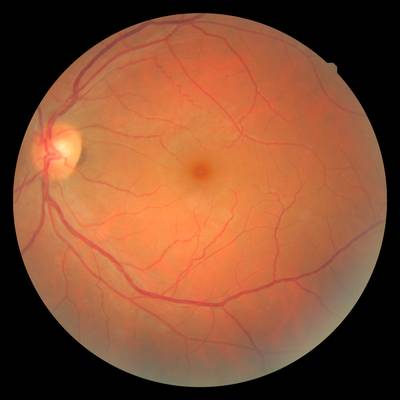
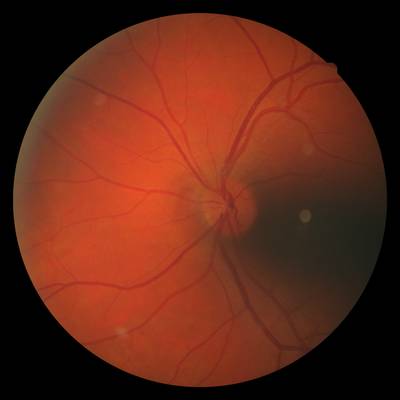
Image pairs from the FIRE dataset. The left column shows a pair from Category S, the second column a pair from Category P, and the two rightmost pairs from Category A. White dots indicate control point locations.
The authors provide ground truth for calculating the registration error in the form of corresponding points between the images in the pair. These are hereafter referred to as control points. The location of a control point j in the reference image is denoted as cj, and the corresponding point in the test image as tj . A registration method takes the points tj as input and maps them to the new coordinates rj. Thus, the rj points are the tj points after registration. If registration is perfect, points cj and rj coincide and their distance (in image pixels) is 0. Ten corresponding points are provided for each image pair. An annotator manually selected these correspondences, locating approximately eight of them towards the edges of the overlapping area and the remaining points towards the center.
Points were chosen to be widespread across the image, providing a broad coverage of the overlapping surface between images, so that the accuracy across the whole image can be calculated. Given that they were manually selected, points are mainly located on vessels and crossings as they allowed the annotator to provide accurate initial markings, which is a challenging task with uncertain outcome in other image areas that lack image structure. The number of correspondences was selected by balancing the trade-on between the time availability of the annotator, accuracy of annotations, and number of marked images.
 Homepage
 Research Paper
Summary #
FIRE: Fundus Image Registration Dataset is a dataset for an object detection task. It is used in the medical industry.
The dataset consists of 268 images with 2680 labeled objects belonging to 2 different classes including reference point and test point.
Images in the FIRE dataset have bounding box annotations. All images are labeled (i.e. with annotations). There are no pre-defined train/val/test splits in the dataset. Alternatively, the dataset could be split into 3 categories: S (142 images), P (98 images), and A (28 images). Additionally, every image grouped with its im_id tag. The dataset was released in 2017 by the Institute of Computer Science, Greece, University of Crete, Greece, and Aristotle University of Thessaloniki, Greece.
Explore #
FIRE dataset has 268 images. Click on one of the examples below or open "Explore" tool anytime you need to view dataset images with annotations. This tool has extended visualization capabilities like zoom, translation, objects table, custom filters and more. Hover the mouse over the images to hide or show annotations.


Class balance #
There are 2 annotation classes in the dataset. Find the general statistics and balances for every class in the table below. Click any row to preview images that have labels of the selected class. Sort by column to find the most rare or prevalent classes.

Class ㅤ | Images ㅤ | Objects ㅤ | Count on image average | Area on image average |
|---|---|---|---|---|
test point➔ point | 134 | 1340 | 10 | 0% |
reference point➔ point | 134 | 1340 | 10 | 0% |
Co-occurrence matrix #
Co-occurrence matrix is an extremely valuable tool that shows you the images for every pair of classes: how many images have objects of both classes at the same time. If you click any cell, you will see those images. We added the tooltip with an explanation for every cell for your convenience, just hover the mouse over a cell to preview the description.
Images #
Explore every single image in the dataset with respect to the number of annotations of each class it has. Click a row to preview selected image. Sort by any column to find anomalies and edge cases. Use horizontal scroll if the table has many columns for a large number of classes in the dataset.
Object distribution #
Interactive heatmap chart for every class with object distribution shows how many images are in the dataset with a certain number of objects of a specific class. Users can click cell and see the list of all corresponding images.
Class sizes #
The table below gives various size properties of objects for every class. Click a row to see the image with annotations of the selected class. Sort columns to find classes with the smallest or largest objects or understand the size differences between classes.
Class | Object count | Avg area | Max area | Min area | Min height | Min height | Max height | Max height | Avg height | Avg height | Min width | Min width | Max width | Max width |
|---|---|---|---|---|---|---|---|---|---|---|---|---|---|---|
test point point | 1340 | 0% | 0% | 0% | 1px | 0.03% | 1px | 0.03% | 1px | 0.03% | 1px | 0.03% | 1px | 0.03% |
reference point point | 1340 | 0% | 0% | 0% | 1px | 0.03% | 1px | 0.03% | 1px | 0.03% | 1px | 0.03% | 1px | 0.03% |
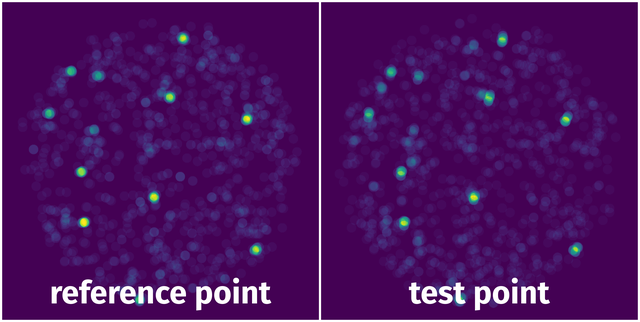
Spatial Heatmap #
The heatmaps below give the spatial distributions of all objects for every class. These visualizations provide insights into the most probable and rare object locations on the image. It helps analyze objects' placements in a dataset.
License #
The FIRE: Fundus Image Registration Dataset is publicly available.
Citation #
If you make use of the FIRE: Fundus Image Registration Dataset data, please cite the following reference:
@dataset{FIRE: Fundus Image Registration Dataset,
  author={Carlos Hernandez Matas and Xenophon Zabulis and Areti Triantafyllou and Panagiota Anyfanti and Stella Douma and Antonis Argyros},
  title={FIRE: Fundus Image Registration Dataset},
  year={2017},
  url={https://projects.ics.forth.gr/cvrl/fire/}
}
If you are happy with Dataset Ninja and use provided visualizations and tools in your work, please cite us:
@misc{ visualization-tools-for-fire-fundus-dataset,
  title = { Visualization Tools for FIRE Dataset },
  type = { Computer Vision Tools },
  author = { Dataset Ninja },
  howpublished = { \url{ https://datasetninja.com/fire-fundus } },
  url = { https://datasetninja.com/fire-fundus },
  journal = { Dataset Ninja },
  publisher = { Dataset Ninja },
  year = { 2026 },
  month = { jul },
  note = { visited on 2026-07-29 },
}
Download #
Dataset FIRE can be downloaded in Supervisely format:
As an alternative, it can be downloaded with dataset-tools package:
pip install --upgrade dataset-tools
… using following python code:
import dataset_tools as dtools

dtools.download(dataset='FIRE', dst_dir='~/dataset-ninja/')
Make sure not to overlook the python code example available on the Supervisely Developer Portal. It will give you a clear idea of how to effortlessly work with the downloaded dataset.
The data in original format can be downloaded here.
Disclaimer #
Our gal from the legal dep told us we need to post this:
Dataset Ninja provides visualizations and statistics for some datasets that can be found online and can be downloaded by general audience. Dataset Ninja is not a dataset hosting platform and can only be used for informational purposes. The platform does not claim any rights for the original content, including images, videos, annotations and descriptions. Joint publishing is prohibited.
You take full responsibility when you use datasets presented at Dataset Ninja, as well as other information, including visualizations and statistics we provide. You are in charge of compliance with any dataset license and all other permissions. You are required to navigate datasets homepage and make sure that you can use it. In case of any questions, get in touch with us at hello@datasetninja.com.